RACE: Cornering And Likely Nearing The Next Straightaway
 By
Levi
By
Levi
This one appears to be cornering into a bullish setup. Our task is to examine the probable paths, weigh their likelihood, and prepare for whichever track unfolds. Lyn Alden’s recent snapshot provides the first clues.
“RACE is holding up pretty well in terms of revenue and earnings in a difficult global auto market, and has a strong balance sheet, but even after this correction it remains somewhat expensive relative to current earnings and most forward estimates of earnings growth.” — Lyn Alden
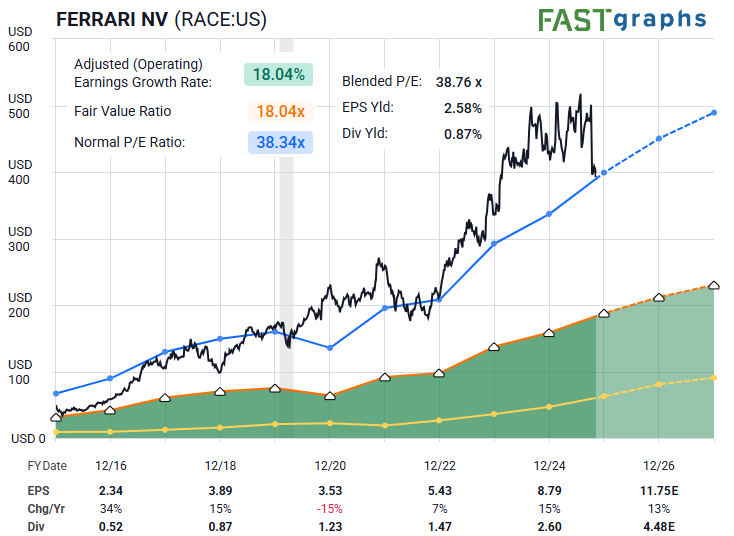
Note on Lyn’s attached F.A.S.T. graph that the stock price has now come back to RACE’s normal P/E. It would also stand to reason that a premium brand such as Ferrari would command a premium price. But there were two prior occasions when this happened. Zac took note of these as well in his reply to Lyn: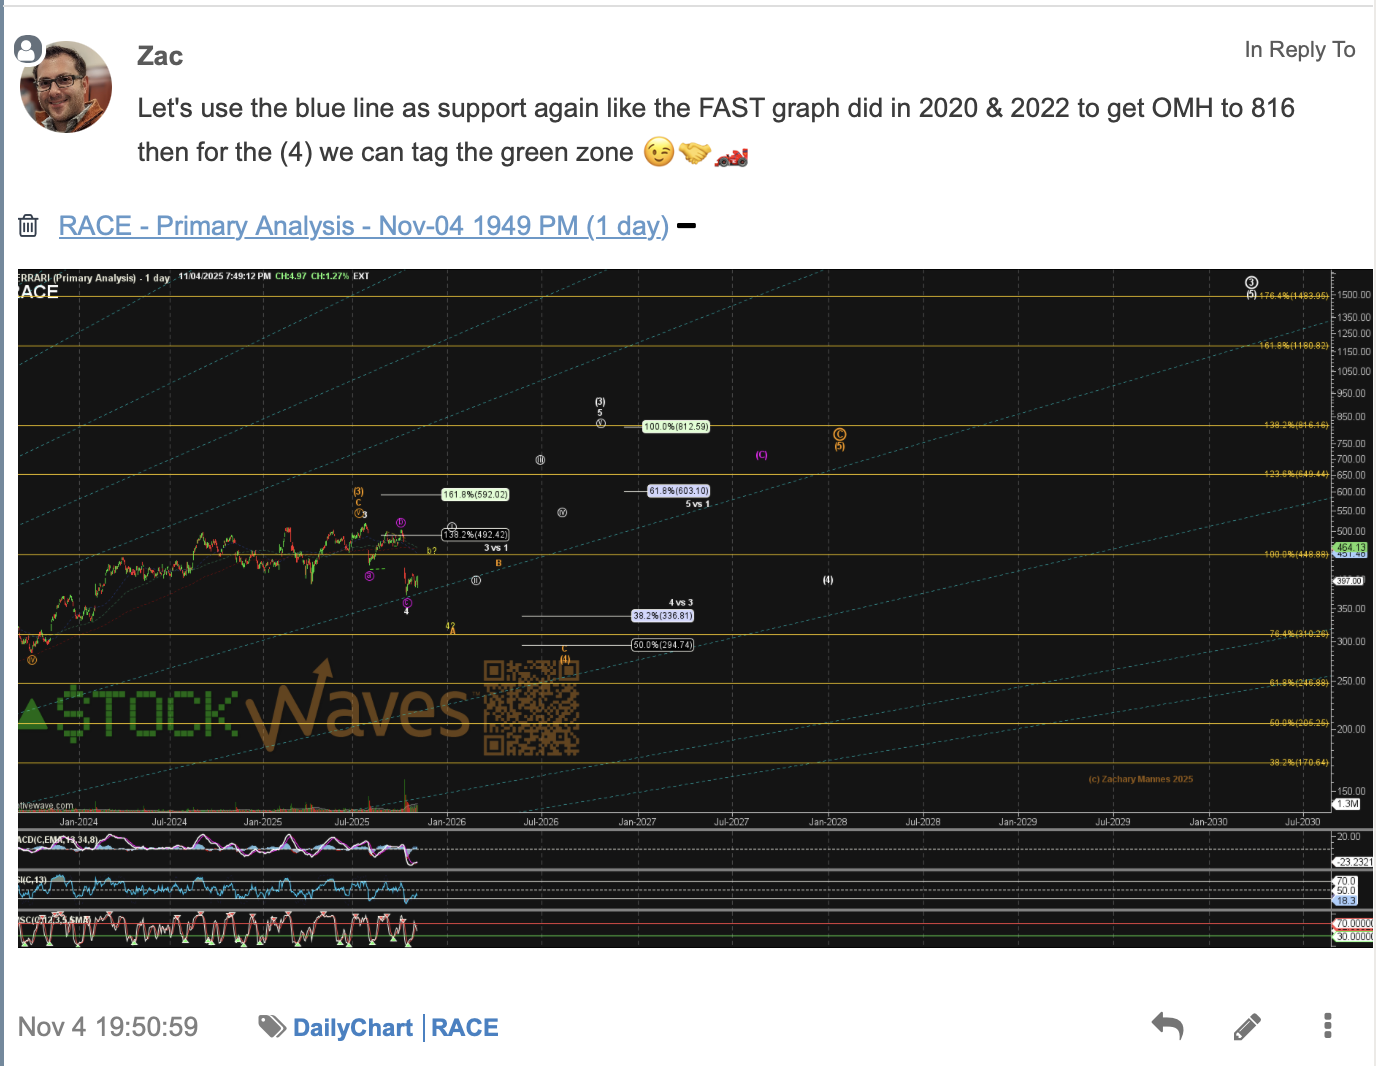
We love his sense of humor — but behind these quips is also some keen market insight. It would fit well that fundamentals would look great in the middle and the end of a third wave as projected on the chart.
To sharpen our risk-versus-reward lens, we now turn to what crowd behavior reveals in the near term.
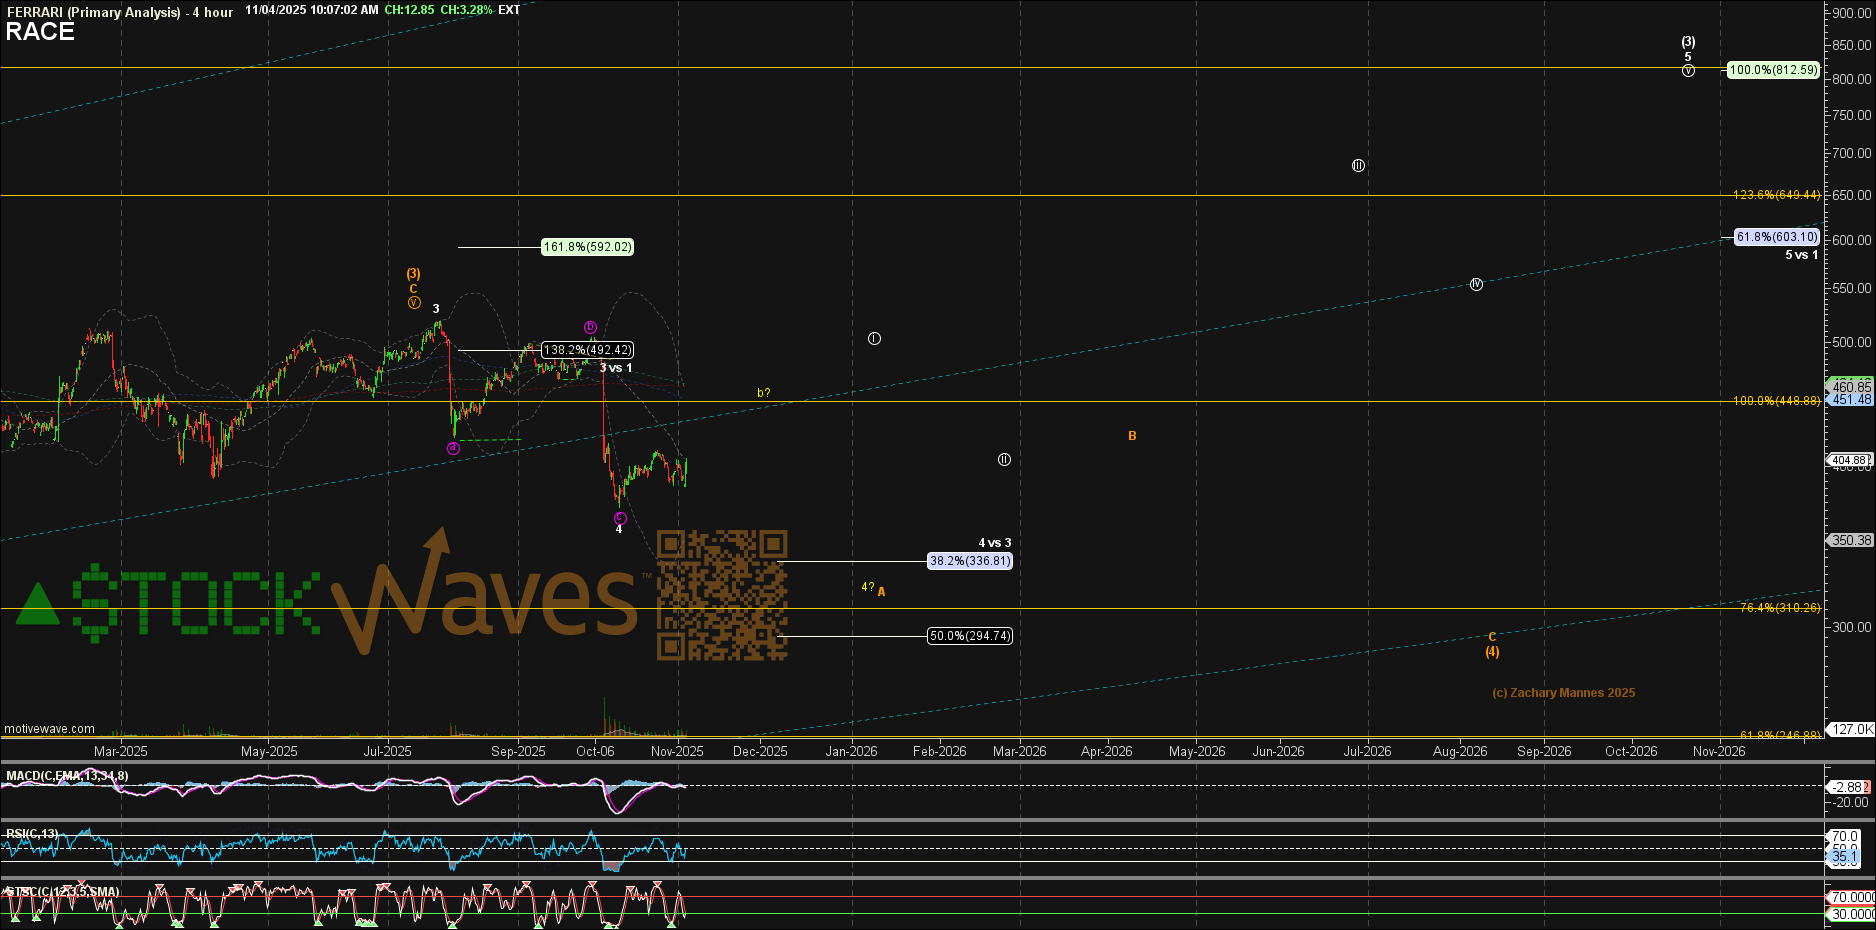
At first glance, Zac’s chart may seem busy with its multiple paths. The primary (white) path assumes that the recent low near $372 on October 13 marked wave 4 of a larger Intermediate wave (3). However, a slightly deeper retrace toward the .382 level near $337 remains plausible. Still, price is close enough to merit the bullish benefit of the doubt.
What might the next leg of the primary path look like? This would be a continuation of the larger impulsive move up and would form the circle ‘i’ as shown. Likely this reaches back near the prior ‘b’ wave high before a corrective pullback in circle ‘ii’. Ultimately, the primary path points to much higher levels into 2026.
But now, why the yellow and orange on the chart? Markets are not linear — they are dynamic, fluid, and ever-adapting. The system used to track and project probabilities must have the versatility and agility to adapt as these unfold. So, while we are projecting the primary path, should price only form 3 waves up from this last low and then turn down, it would become more likely that there is more to go in this current correction.
The yellow path assumes a ‘b’ wave bounce and then price would form 5 waves down to finally finish off the wave 4 shown. Or, it is plausible that the orange path is yet underway as a larger diagonal. Those two paths present as lesser probability cases at this moment. So, Zac is projecting the primary path as the impulse you see on the chart.
How could one best use this information? Third waves in impulses are often the strongest. So, for RACE, if one chose to await completion of circle ‘i’ and then track the pullback in ‘ii’, that would provide a high probability setup where risk would be defined by the low struck back in mid-October.
These are the favorable risk versus reward setups that we seek to identify. If RACE has indeed completed its chicane-like correction, then the straightaway ahead could be swift — and thrilling — as this wave (3) rally accelerates.
