Quick Update - Market Analysis for Jul 13th, 2017
I just wanted to put this out to the entire membership now that we broke 21.70GDX. The preponderance of evidence suggests this was a corrective rally and we are potentially moving into what was the yellow count on the daily chart of the GDX, targeting the 20.31 region. The main reason is that the rally off the low was an a=c move, which then broke below the .618 extension up. This usually means this was a corrective rally the great majority of the time.
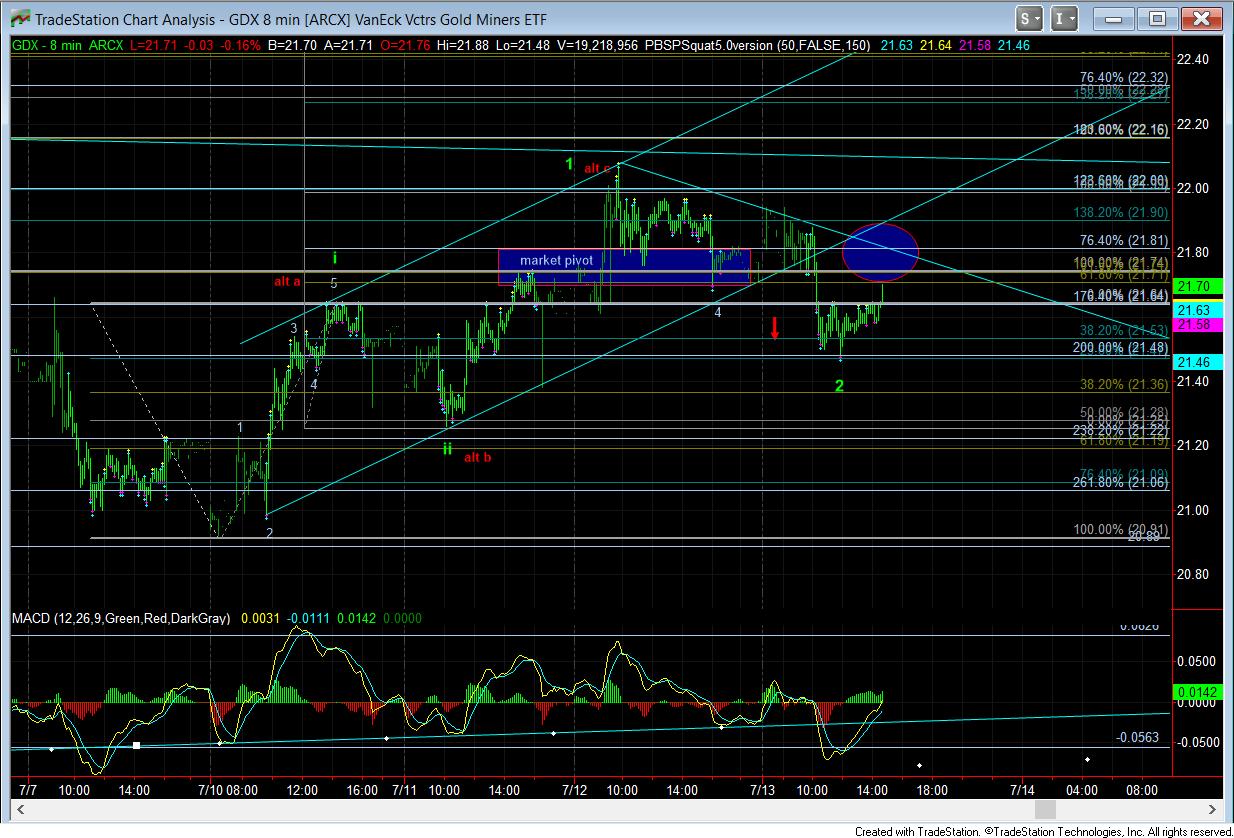
However, if the market is able to prove itself with a break out over this week's high, rather than continuing lower, it opens the potential that we had a I-ii, 1-2 off the lows, as presented in green. Again, I don't think this is what is playing out at this time, as the second 1-2 is not usually coming off what is normally viewed as an a=c rally. But, I am going to maintain an open mind.
For now, we are simply testing the break down point from below, and as long as we remain below the ellipse, I see the potential for 20.31.