Pushed To The Limits
When engaging in trading precious metals, one has to come to realization quite quickly that they are much more volatile than standard equity markets. And, due to this realization, one must learn how to approach this market in a different manner than you would equities.
You see, when the metals rally or when they decline, they often push us to the limits of our expectations. When we were topping this past spring, and everyone was so sure that we were going to break out, I kept trying to lower your expectations, as the structure suggested that a larger pullback was likely to be seen first, as we likely needed a 2nd wave before that break out was going to happen.
We are now well within that 2nd wave pullback. And it has now taken us longer and deeper than we would normally want to see. But, if you want to be involved in the metals complex, you have to accept these types of movements.
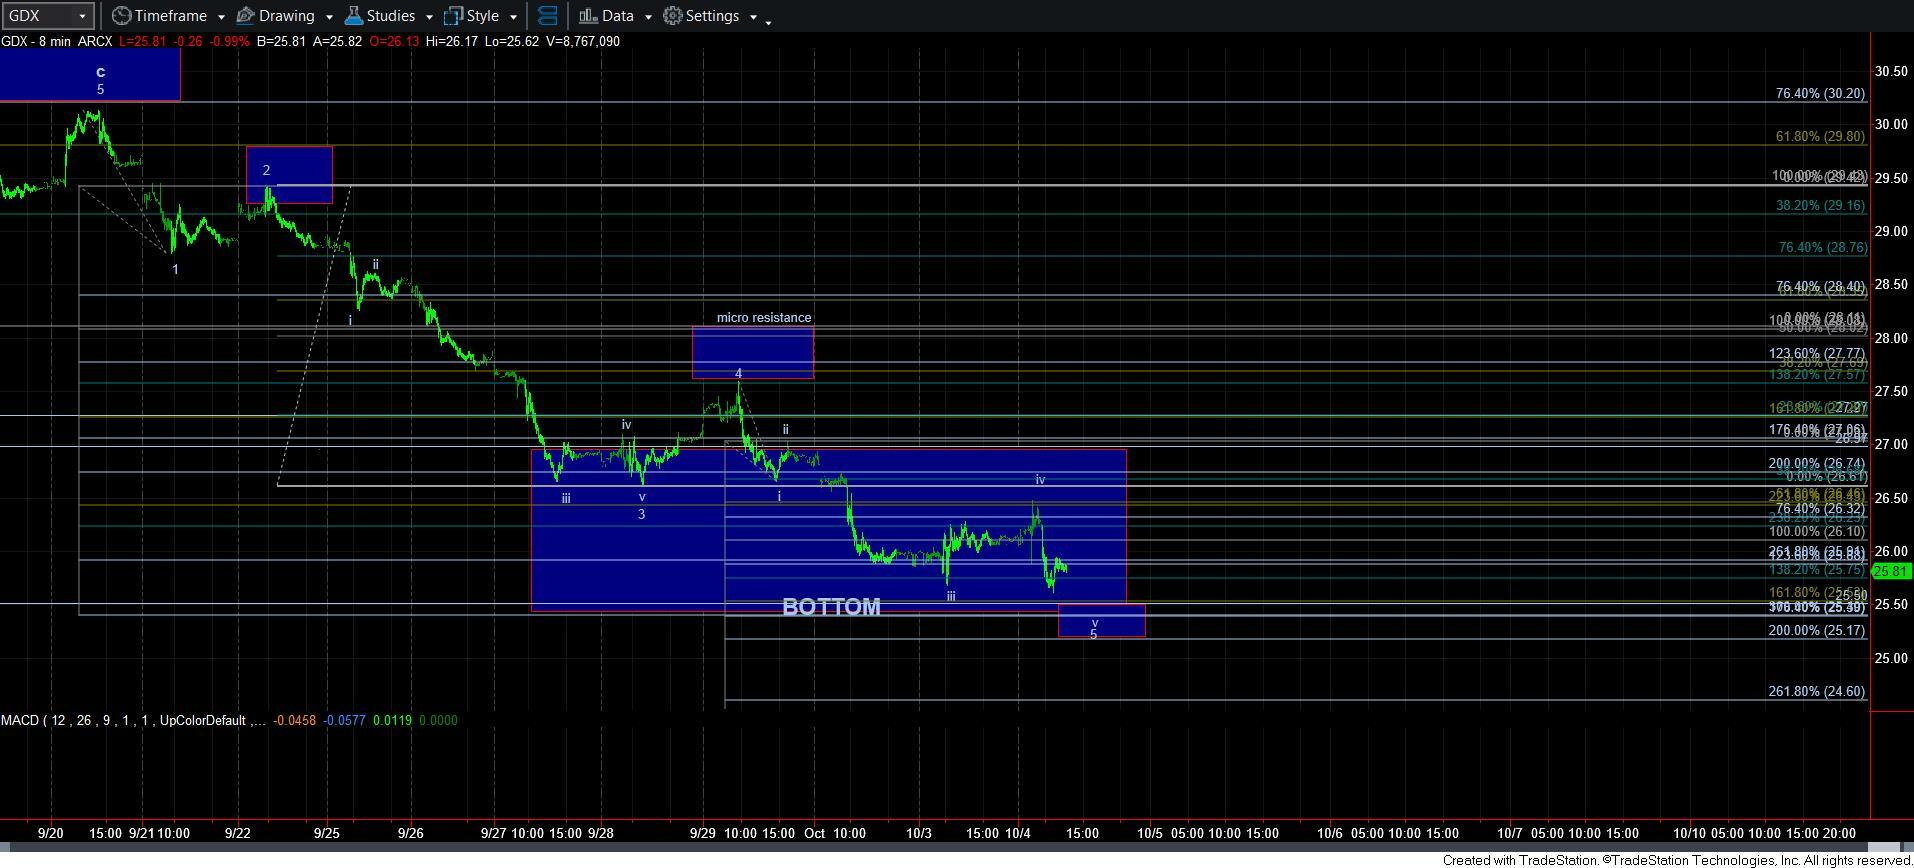
At this time, the one chart that still remains well within expectations is GDX. I have slightly expanded the bottom potential on GDX due to the projections within this final 5th wave structure from the wave 4 high noted on the 8-minute chart.
If you have been following this 8-minute chart, it would have given you some tremendous opportunity to have hedged your long positions, as I outlined near the highs. I noted that there were two points at which you could choose to do so . . the first was as we approached the c-wave box, and the second was during the 2nd wave bounce. Since that time, this downside structure has been almost perfect to track on the upside and downside. And, if we continue to play out according to this chart, then we really should not see a break down below the 25.17 level or else I have to consider that a deeper pullback is in store.
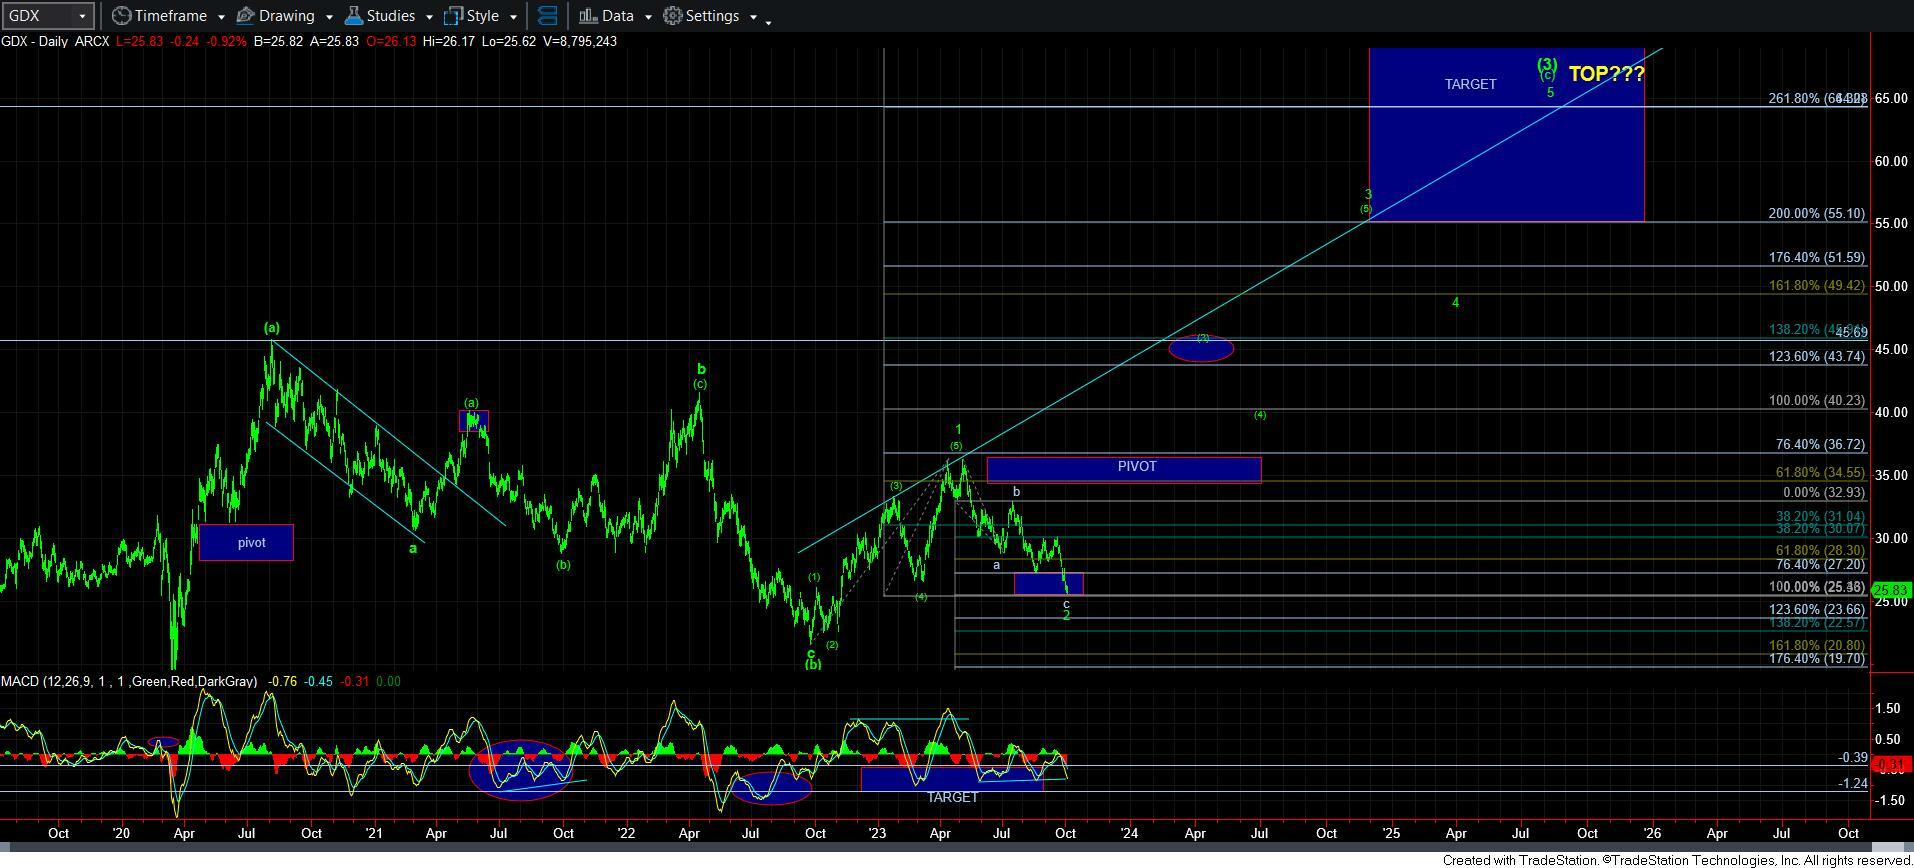
Again, this chart really maintains the 2nd wave count rather well. Even the daily chart is still holding is divergences. Yet, it means we need to see a bottom relatively soon, and then begin an impulsive move back up through 27 to suggest that a bottom is likely in place.
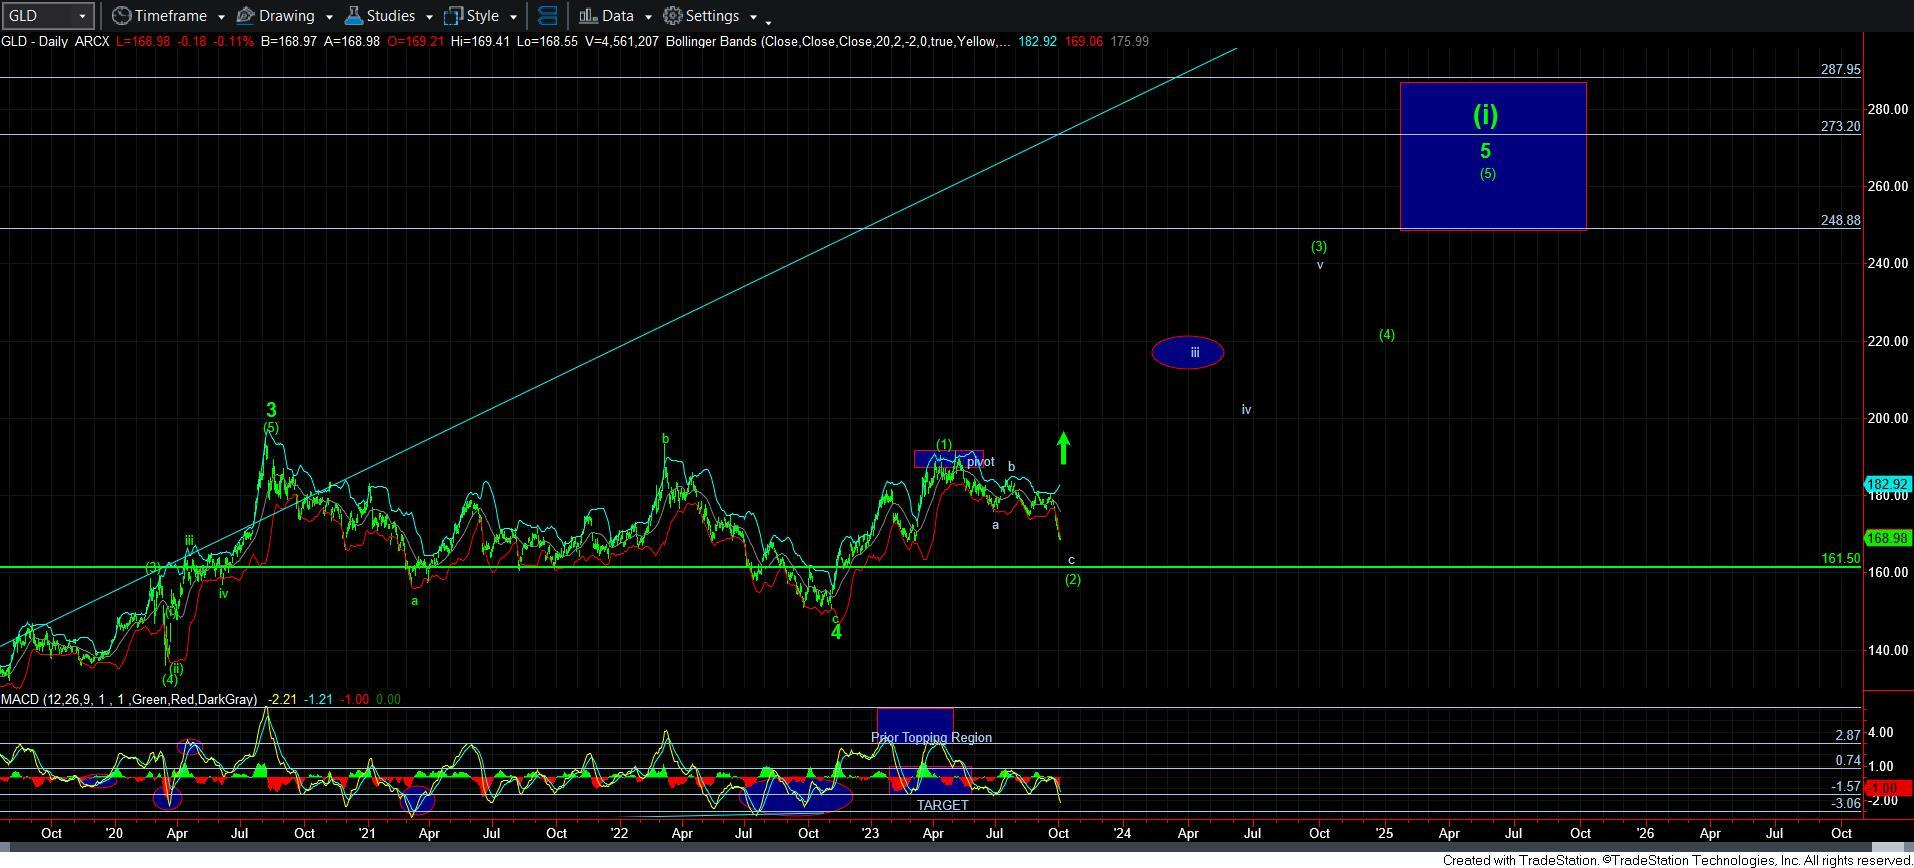
GLD and silver are more of an issue. GLD’s daily chart MACD has lost its divergence. Moreover, the size and strength of this decline suggest that it could be more in the wave of a 3rd wave within a deeper c-wave. I would need to see an impulsive rally begin that takes us back to or over the 180 region to keep a more immediate bullish count alive.
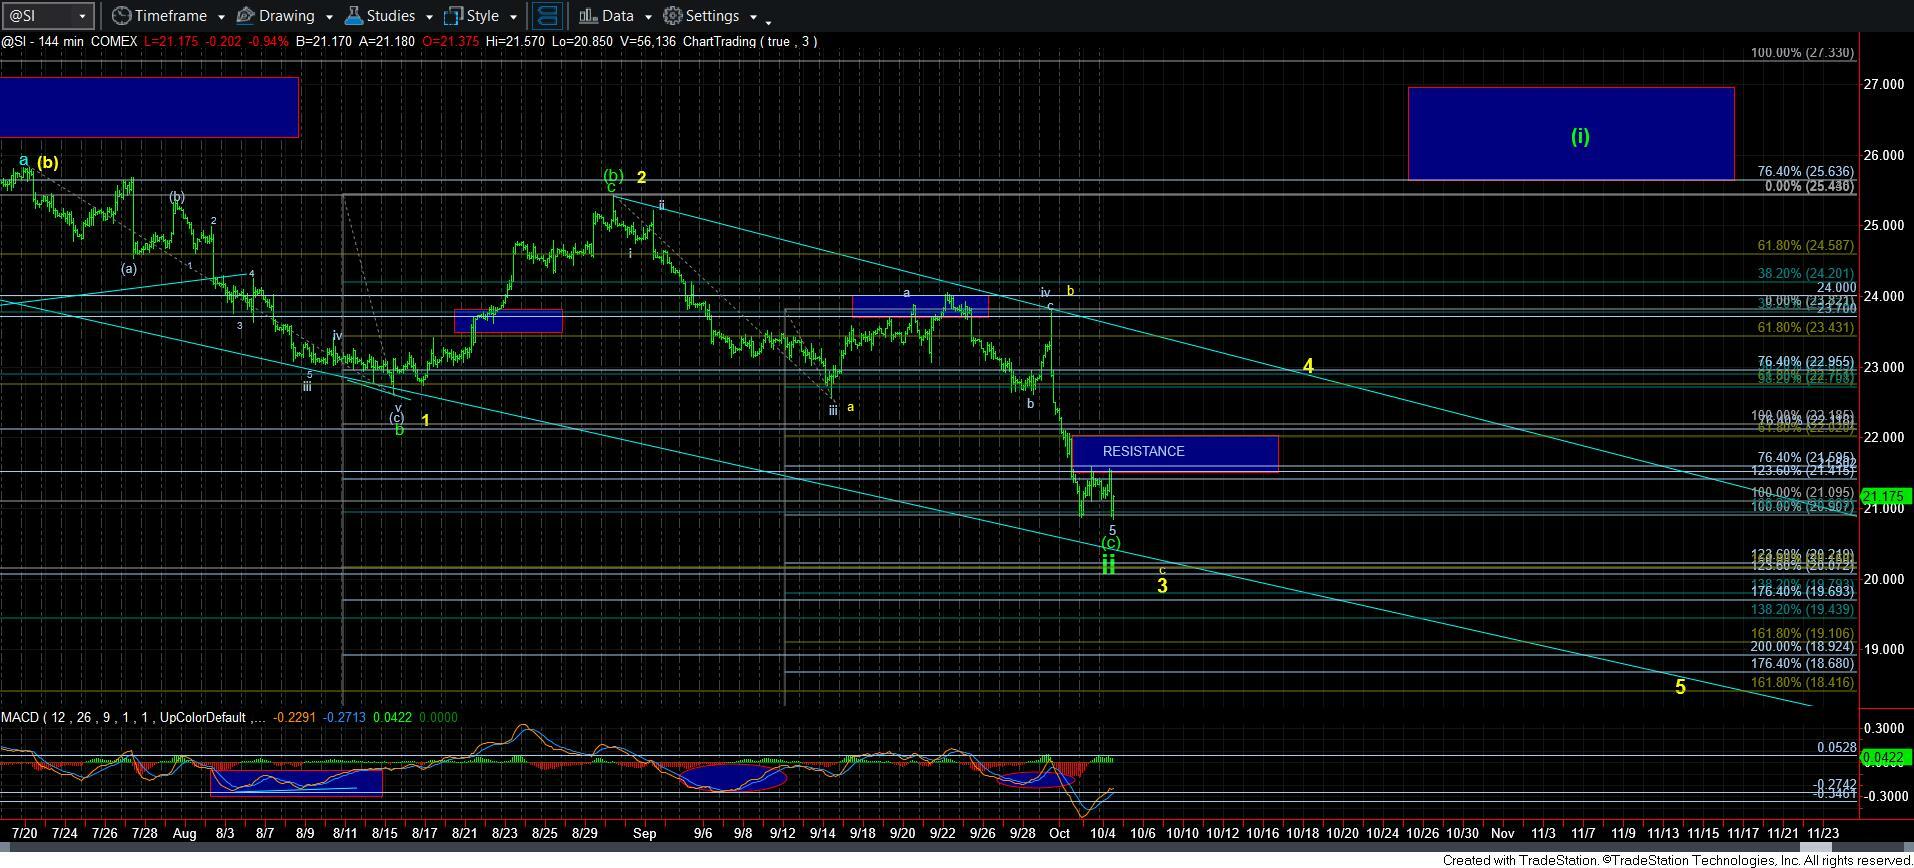
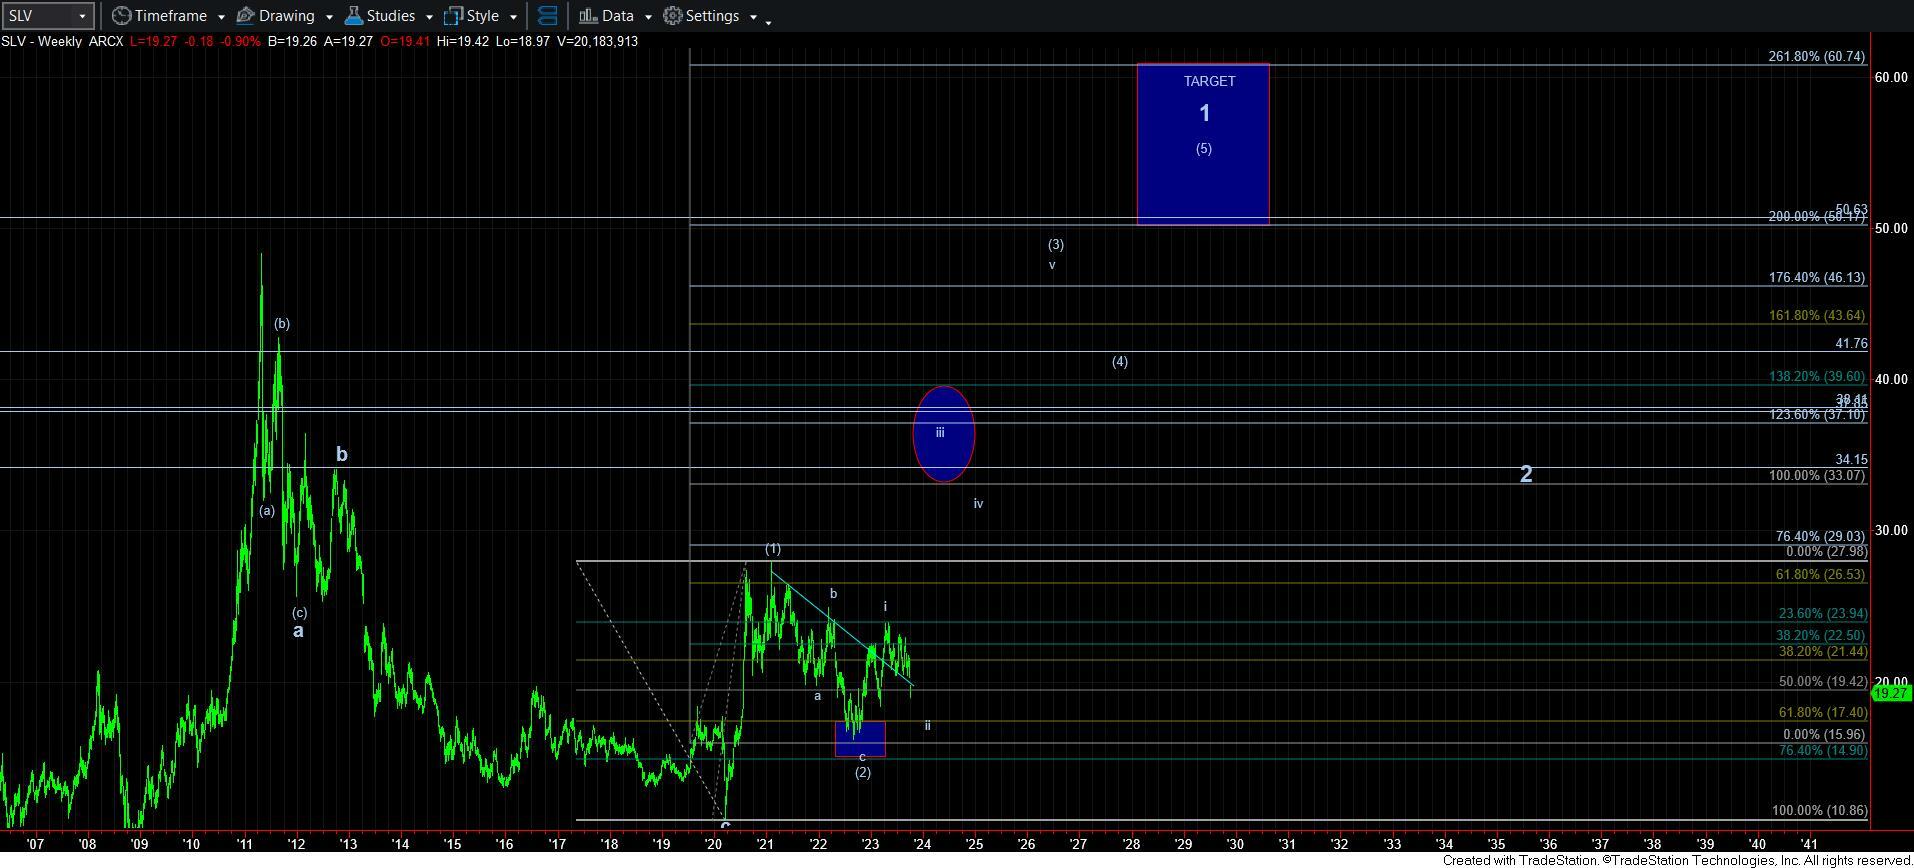
As far as silver is concerned, it has dropped a bit deeper than I had wanted to see for this to remain as a conclusion for wave ii. I outlined the other night that the maximum I really want to see for this decline is the 20.90 region, and, thus far, we have basically held that. So, I am going to give silver a little more room to prove itself.
I am going to need to see an impulsive rally begin off today’s low or else I am going to adopt the yellow wave count, which suggests that we will likely spend more time in this mess before we complete this larger degree wave ii.
However, if we go lower in the coming days, then I really have to adopt the yellow count as my primary, and silver will have to prove to me otherwise, with an impulsive move through 23.
After thinking about this long and hard, I am going to give it one more opportunity to prove to me a bottom has been struck. But, I am not going to be giving it a large leash.
Now, I know many of you are disappointed that we have to consider a potential longer and deeper pullback scenario. While it is still not a foregone conclusion, you may want to look at it as an opportunity rather than a disappointment. I have said over and over that any buy in silver below 20 is likely an amazing opportunity. So, for you silver fans, you MAY get yet another opportunity.
I also want to add one more point I made in the live video this morning. Not all the charts will bottom at the same time. And, this is quite typical of the metals market. If you may remember, silver topped in April of 2011, whereas gold did not top until September of that same year. Then, we saw the mining stocks bottom in the early fall of 2015, whereas gold did not bottom until the final days of 2015. In fact, silver did not strike its bottom until April of 2020.
So, it is entirely possible that GDX may bottom before we see that in the other charts. But, for now, I am trying to keep an objective perspective, and am giving it a bit of room to still prove a bottom in all the charts. Otherwise, this will take us a bit longer and a bit deeper than the charts suggested only a month or so ago.