Purple Is Facing Its First Test
I decided to write the metals report now as we seem to be sitting on a support region.
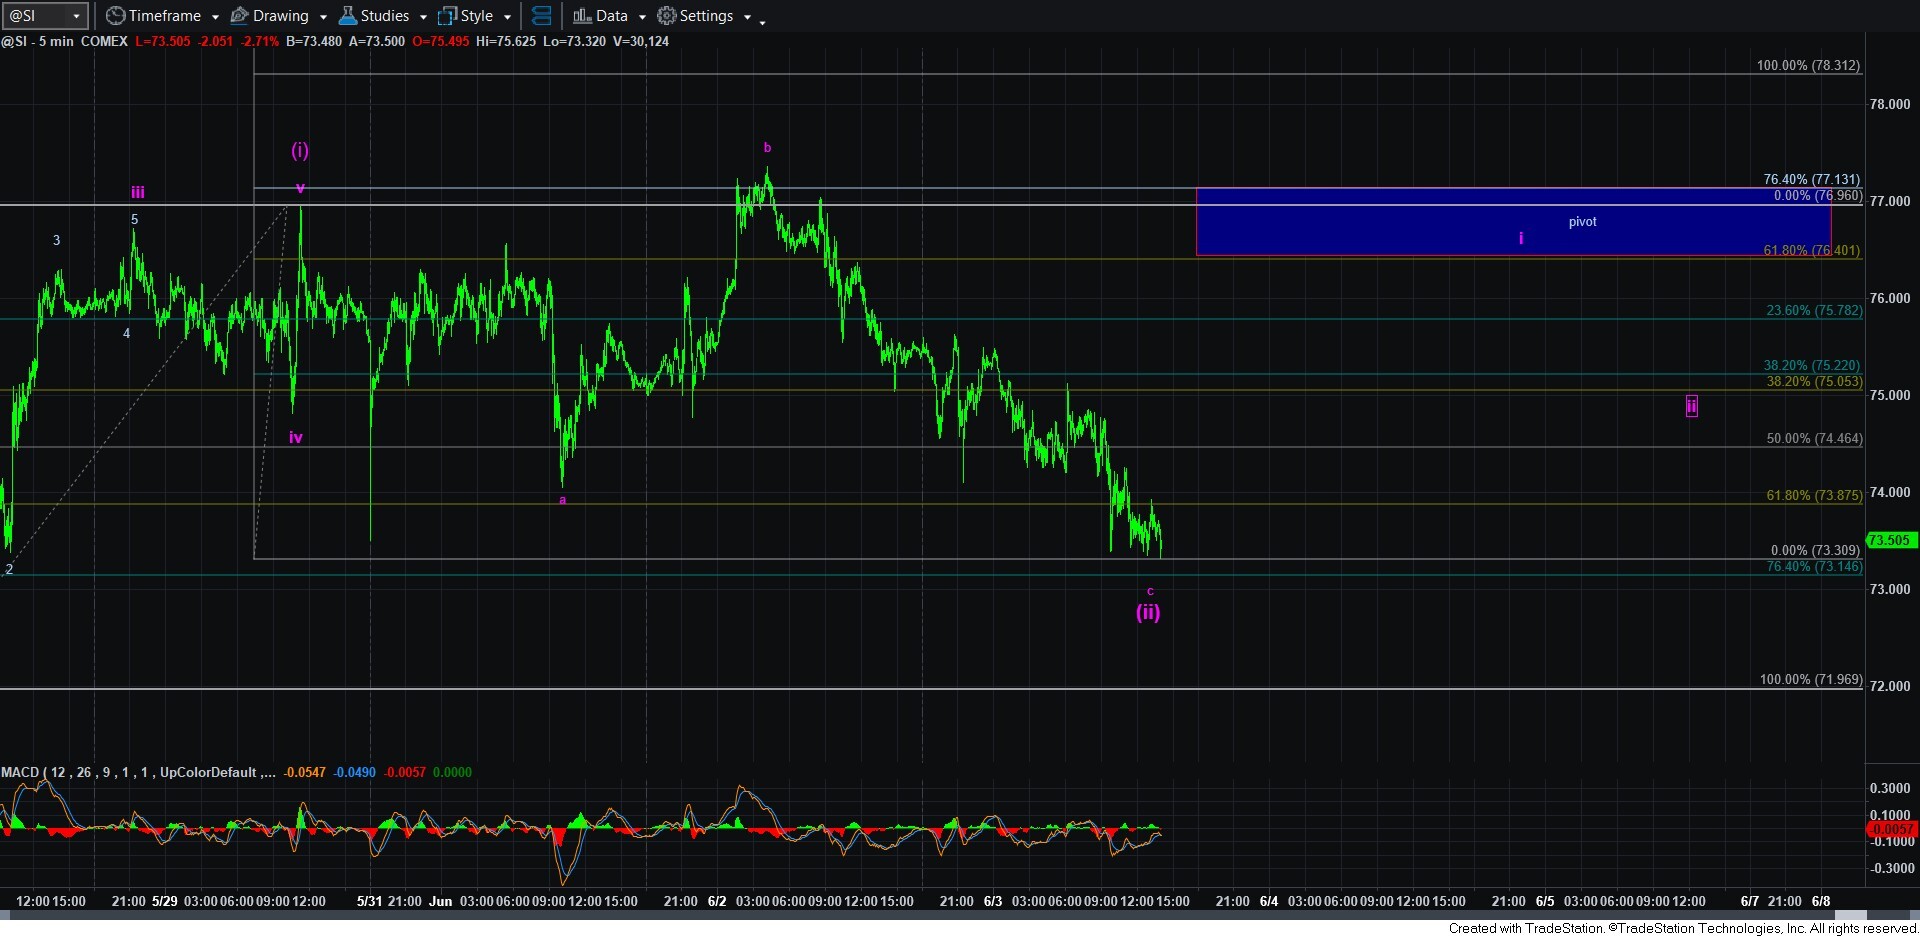
As we said over the weekend, we were looking for a 2nd wave pullback in the purple count. And, thus far, the market has provided us with that expected pullback.
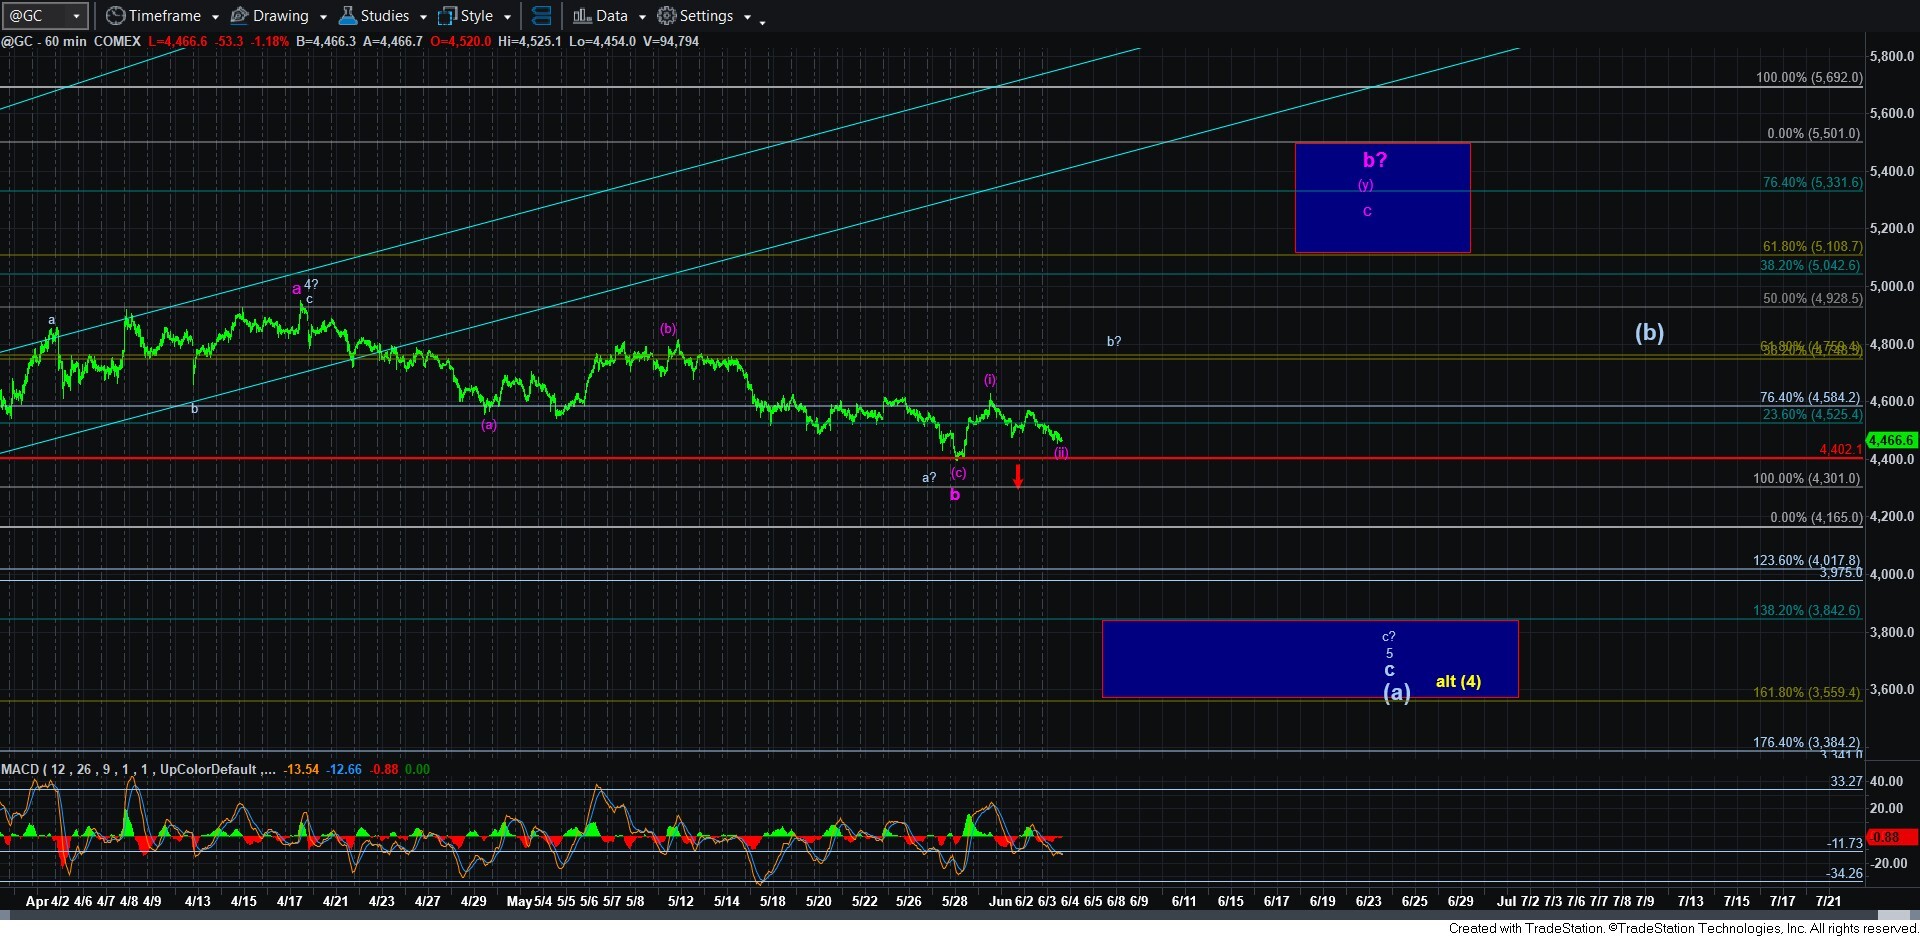
But, I am again going to remind you that we are still likely within a larger degree corrective wave. And, unless the purple provides us with a full (i)(ii) i-ii structure, followed by a break out over the high of waves (i)/i, we have to view this action with a bit of a jaundiced eye.
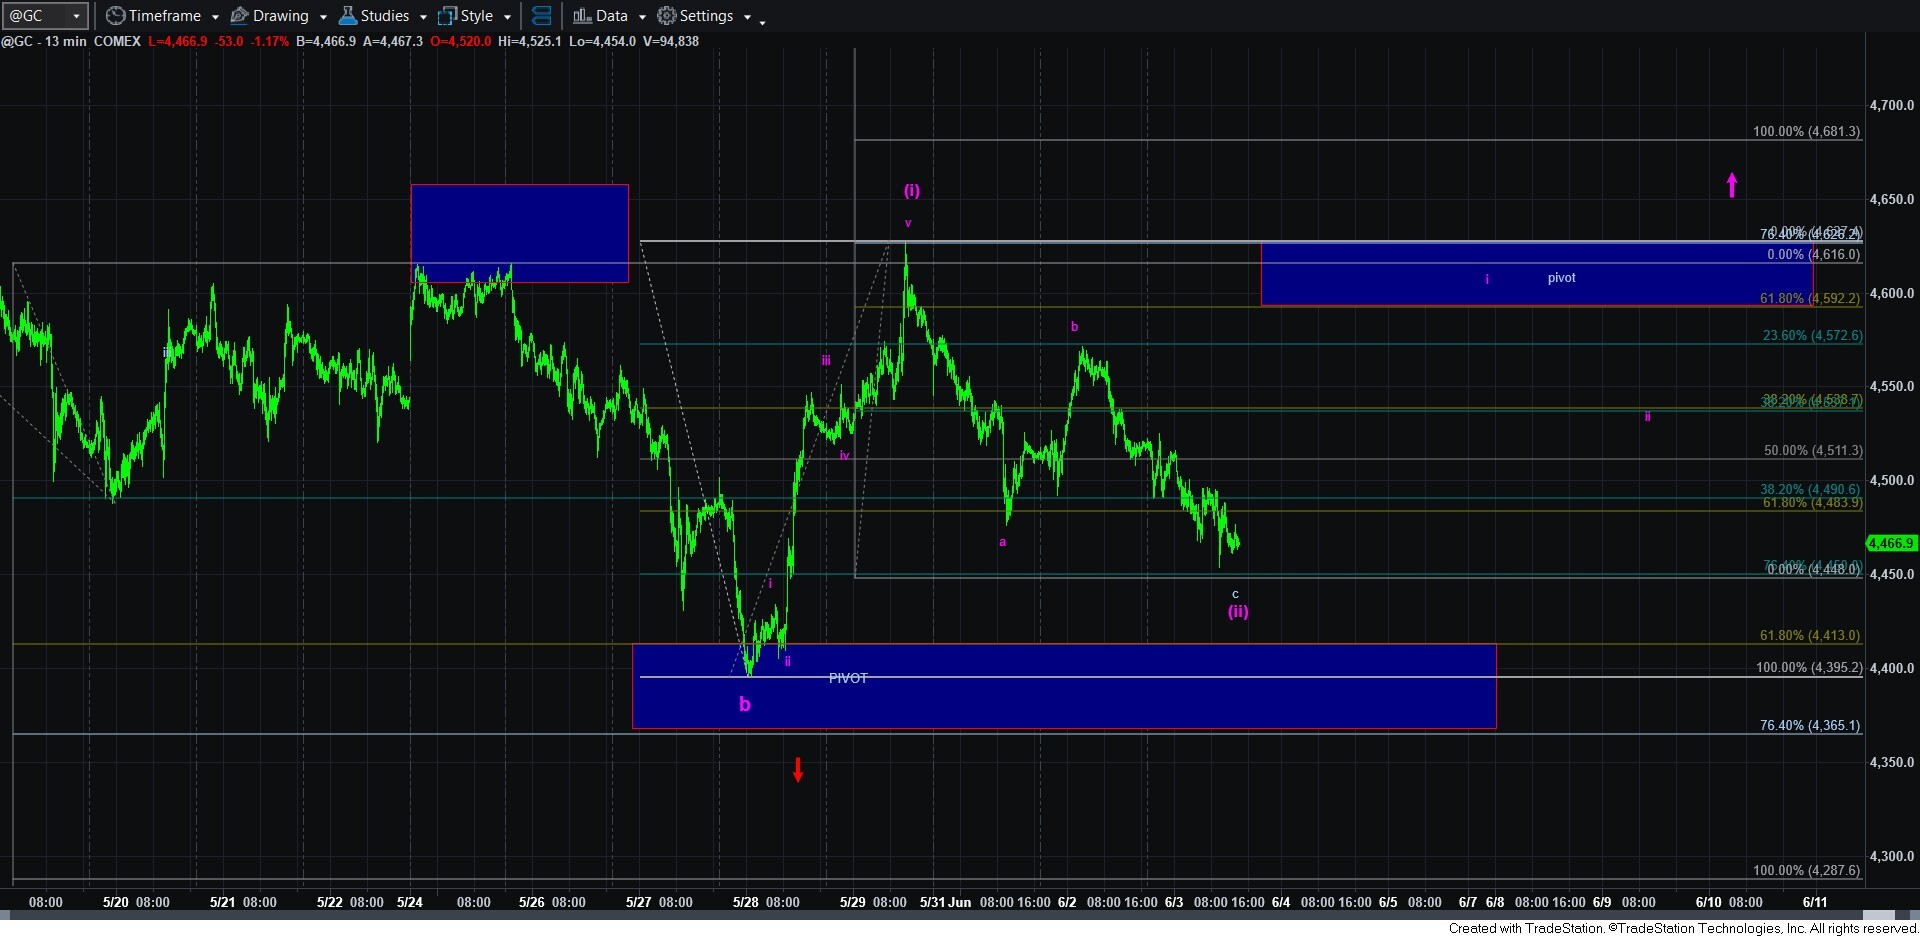
With gold being the “cleanest” set up of the charts, I am viewing this as an a-b-c corrective pullback for wave (ii), with the c-wave dropping us down to the .764 retracement of wave (i), and the c-wave being equal to .764 the size of the a-wave into that support region.
So, for those that are seeking a much more reliable long trade, you will want to wait until the market proves that it will hold this support with a 5-wave rally taking us back towards the pivot box overhead for wave i of wave (iii). You can then choose to buy a wave ii pullback, with your stops being placed at the low of wave (ii). Another potential point to buy is to wait until the (i)(ii) i-ii has fully completed, and then buy on the break out over the respective waves (i)/i.
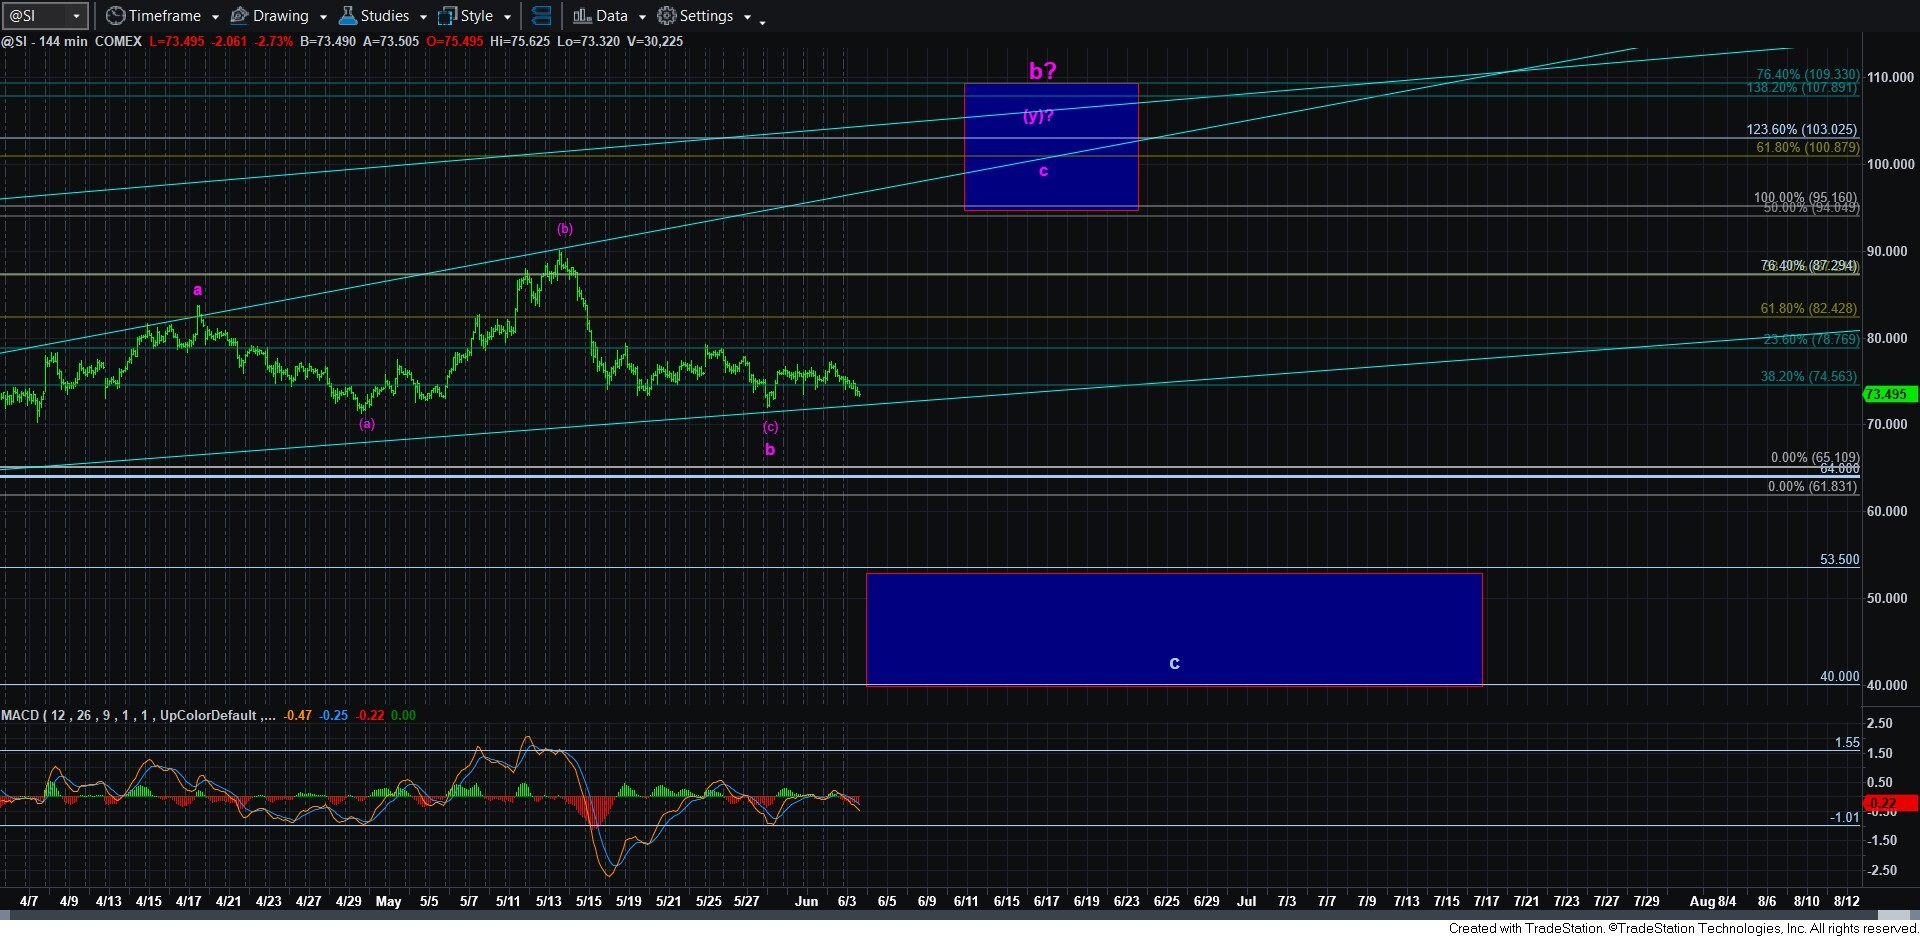
I am also counting silver in a similar fashion, as it seems to be making an attempt to complete its c-wave of (ii) also at the .764 retracement of the potential wave (i). The same analysis above for gold applies for silver as well.
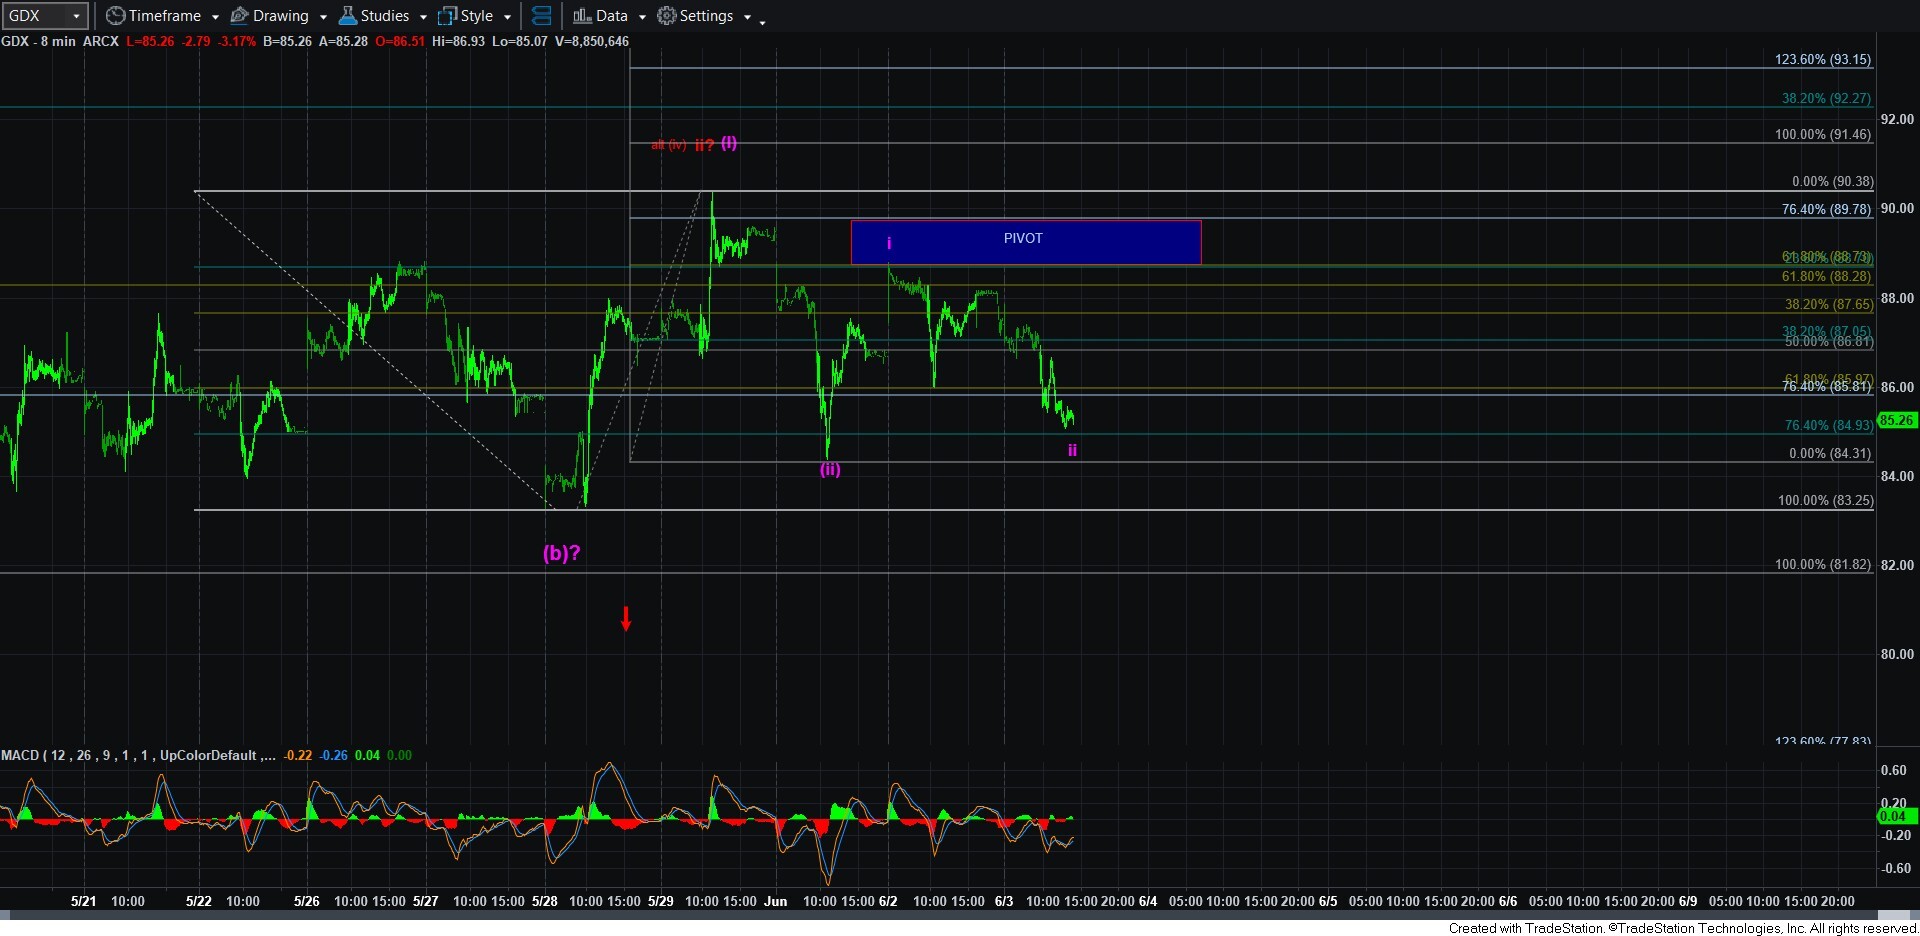
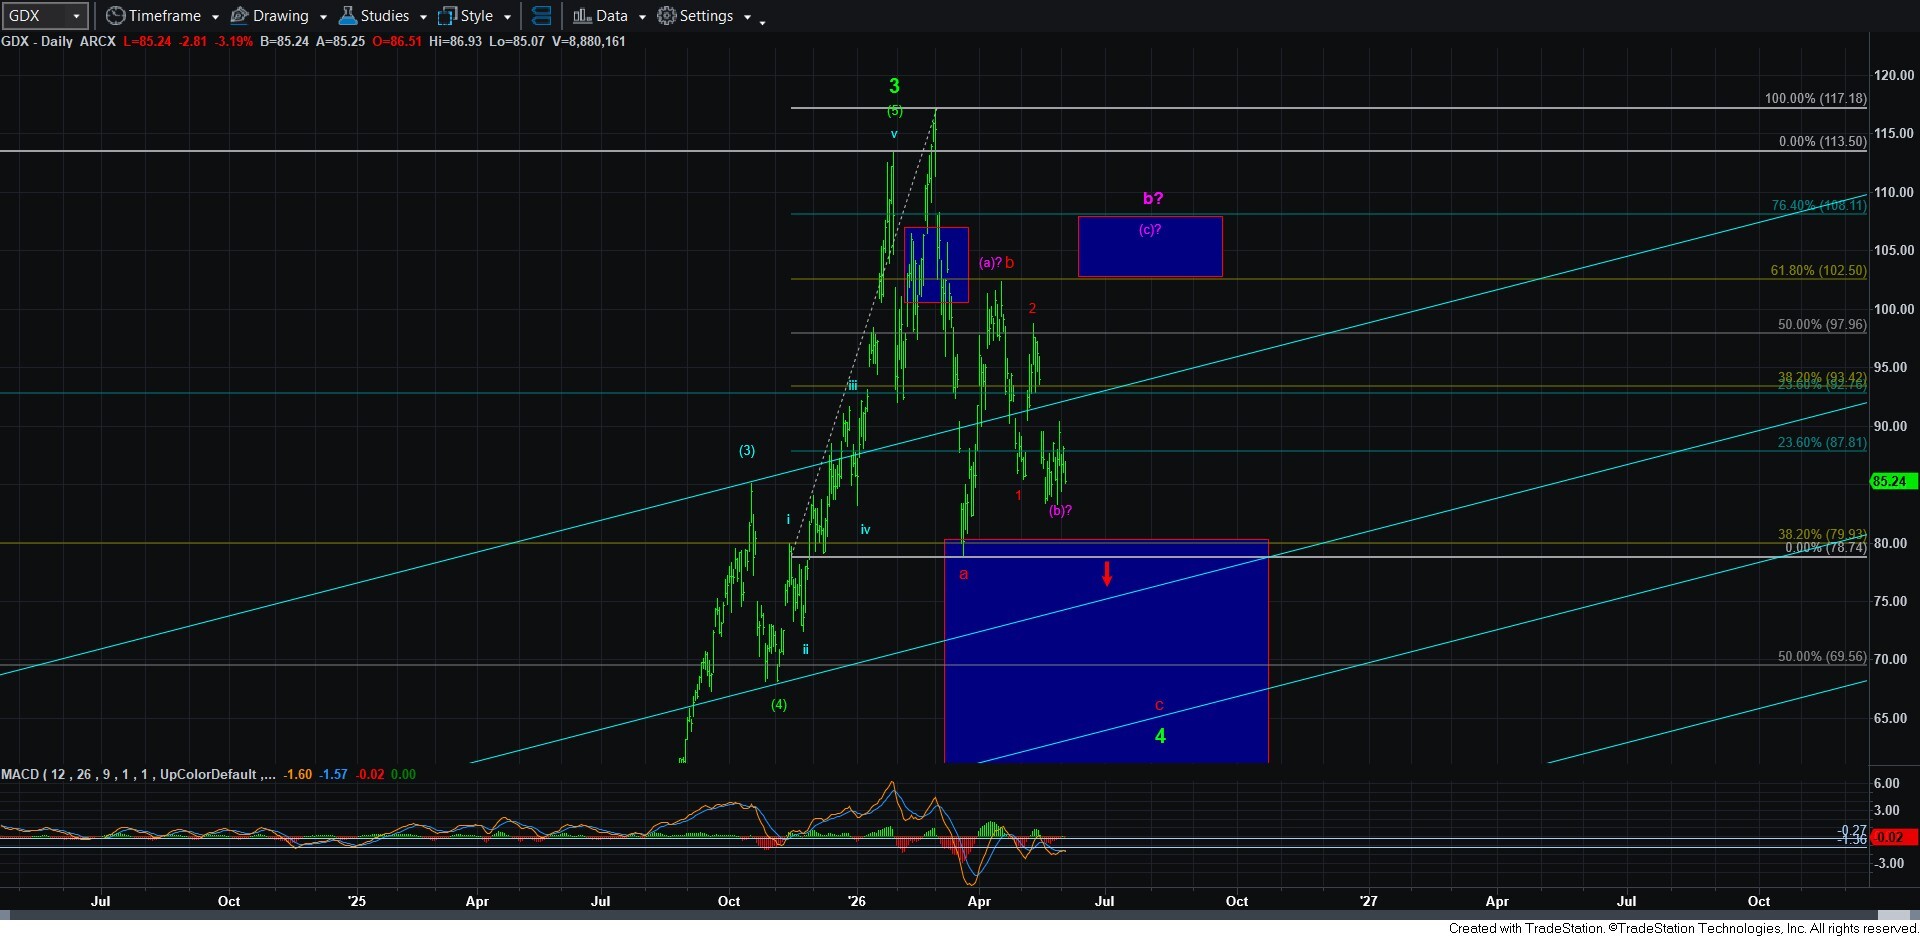
GDX’s structure is a bit more concerning, but I would suggest to wait on this pattern developing a bit more in order to gain greater confidence in this potential. Moreover, take note that I have lowered the target for a potential rally and the box overhead on the daily chart now represents the ideal target if we should get this purple rally.
In summary, the metals are trying to develop a set up for a rally to complete the purple b-wave. For most of you, it would be prudent to allow that set up to develop further to gain greater confidence in its potential before trying to trade for a rally within a complex corrective structure.
Alternatively, should this set up break, then it puts us back into the potential for more direct lower lows and the completion of this correction which began in January. The nature of the rally after we bottom will tell us if this correction has a lot longer to run, or if it is over and we are beginning to rally to new highs across the complex.