Probable Bottom Zones for Bitcoin & Ethereum
 By
Ryan Wilday
By
Ryan Wilday
Red Path Confirmed
Summary:
I'm going to keep this short as Bitcoin and Ethereum have both followed their respective red counts, although not as a triangle for 4. That's academic though. What is key now is that we hold one more low, which should be 5 of V of C in both counts. While I still count support as $3320 in Bitcoin and $94 in Ethereum, these counts are more than 'full'. And, if we see correction action out of these levels in this coming week, I will presume a break of support is coming, at least as far as trading goes. By that I mean risk management will be more important than trying to catch a low, at least until five up toward the range of the .382 and .618 extension.
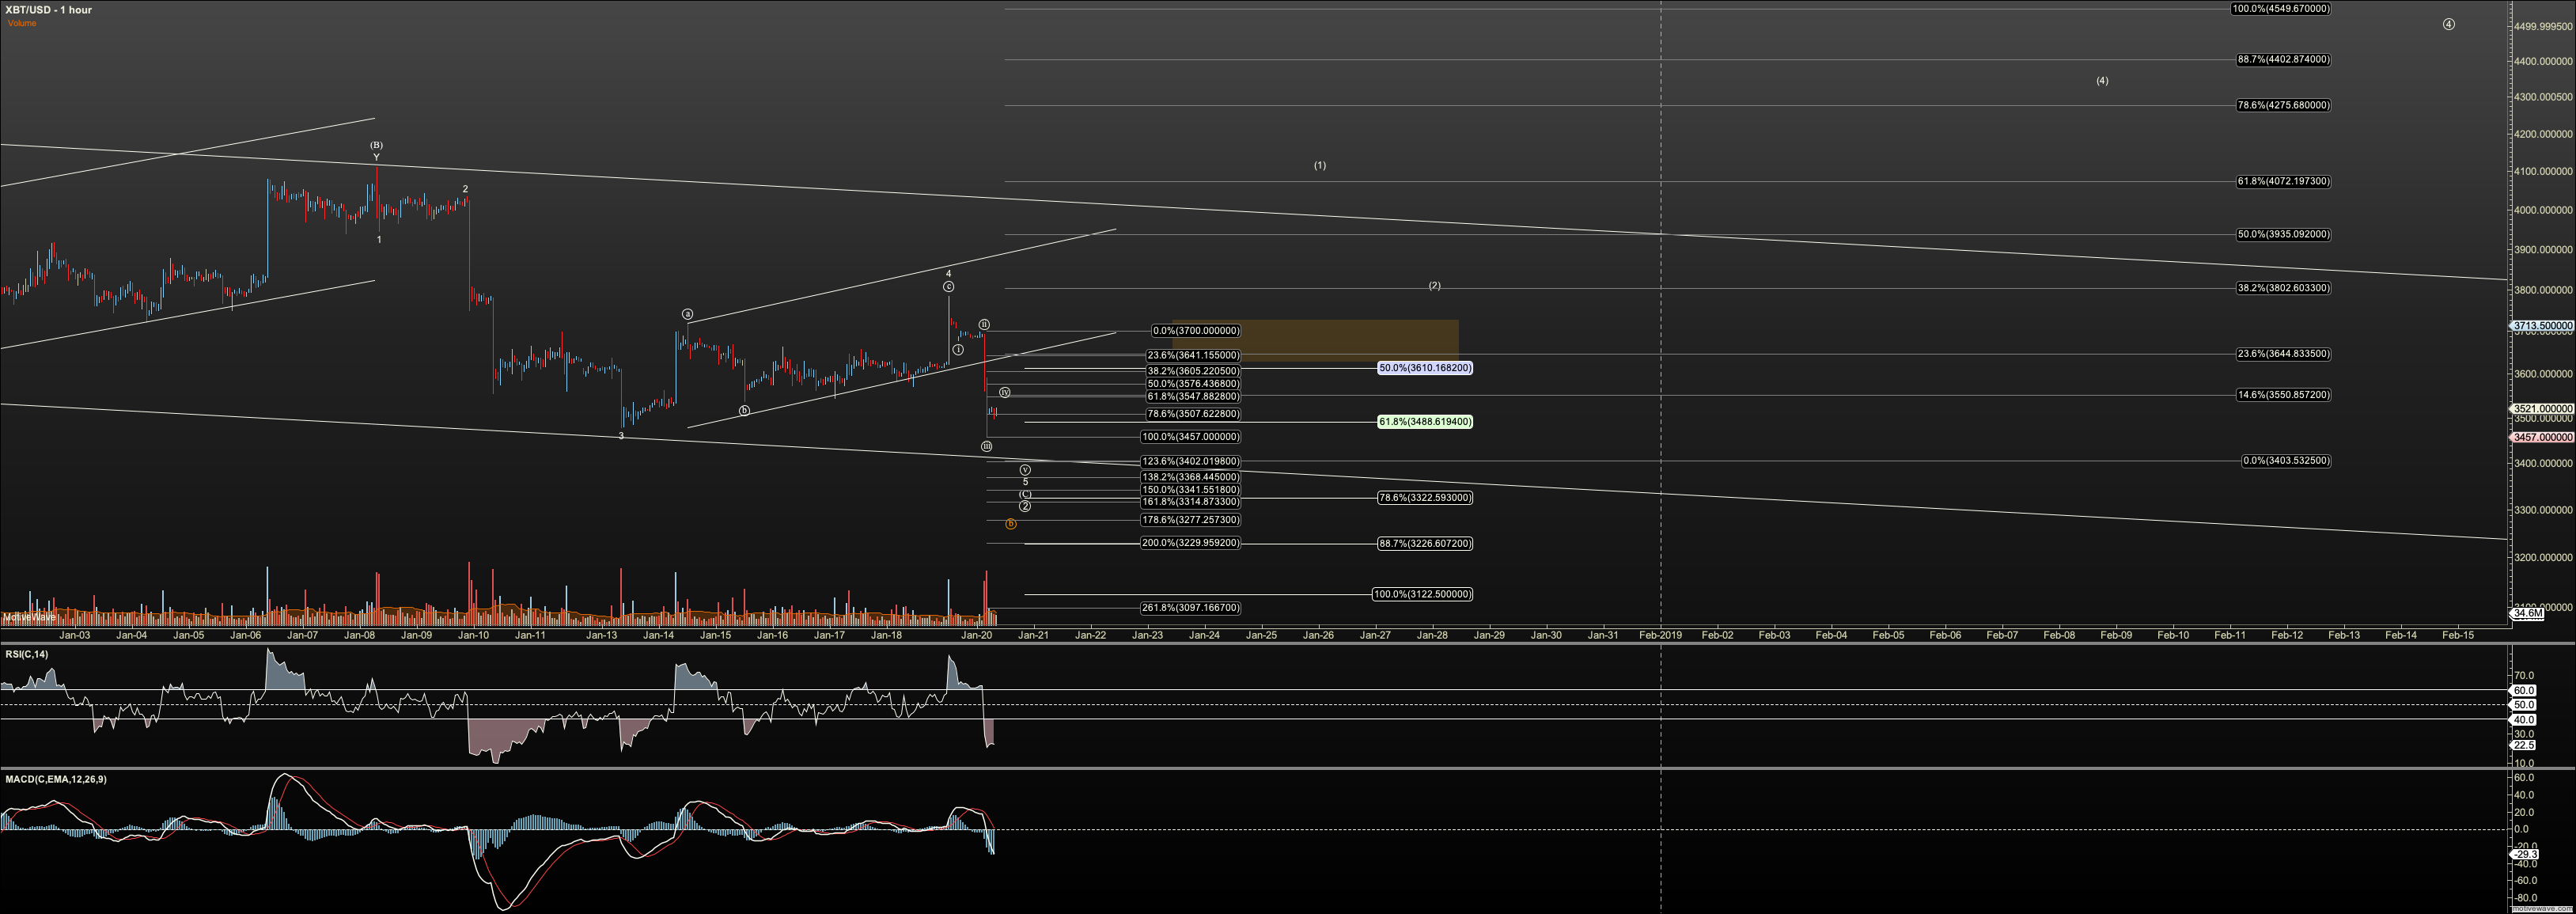
Bitcoin
I currently have $3368-$3400 as the probable zone for a bottom, and strong over $3575 suggests this small wave 5 is complete. We saw a nominal break of resistance for 4, but only a spike through that did not follow through. Obviously, we then came back down.
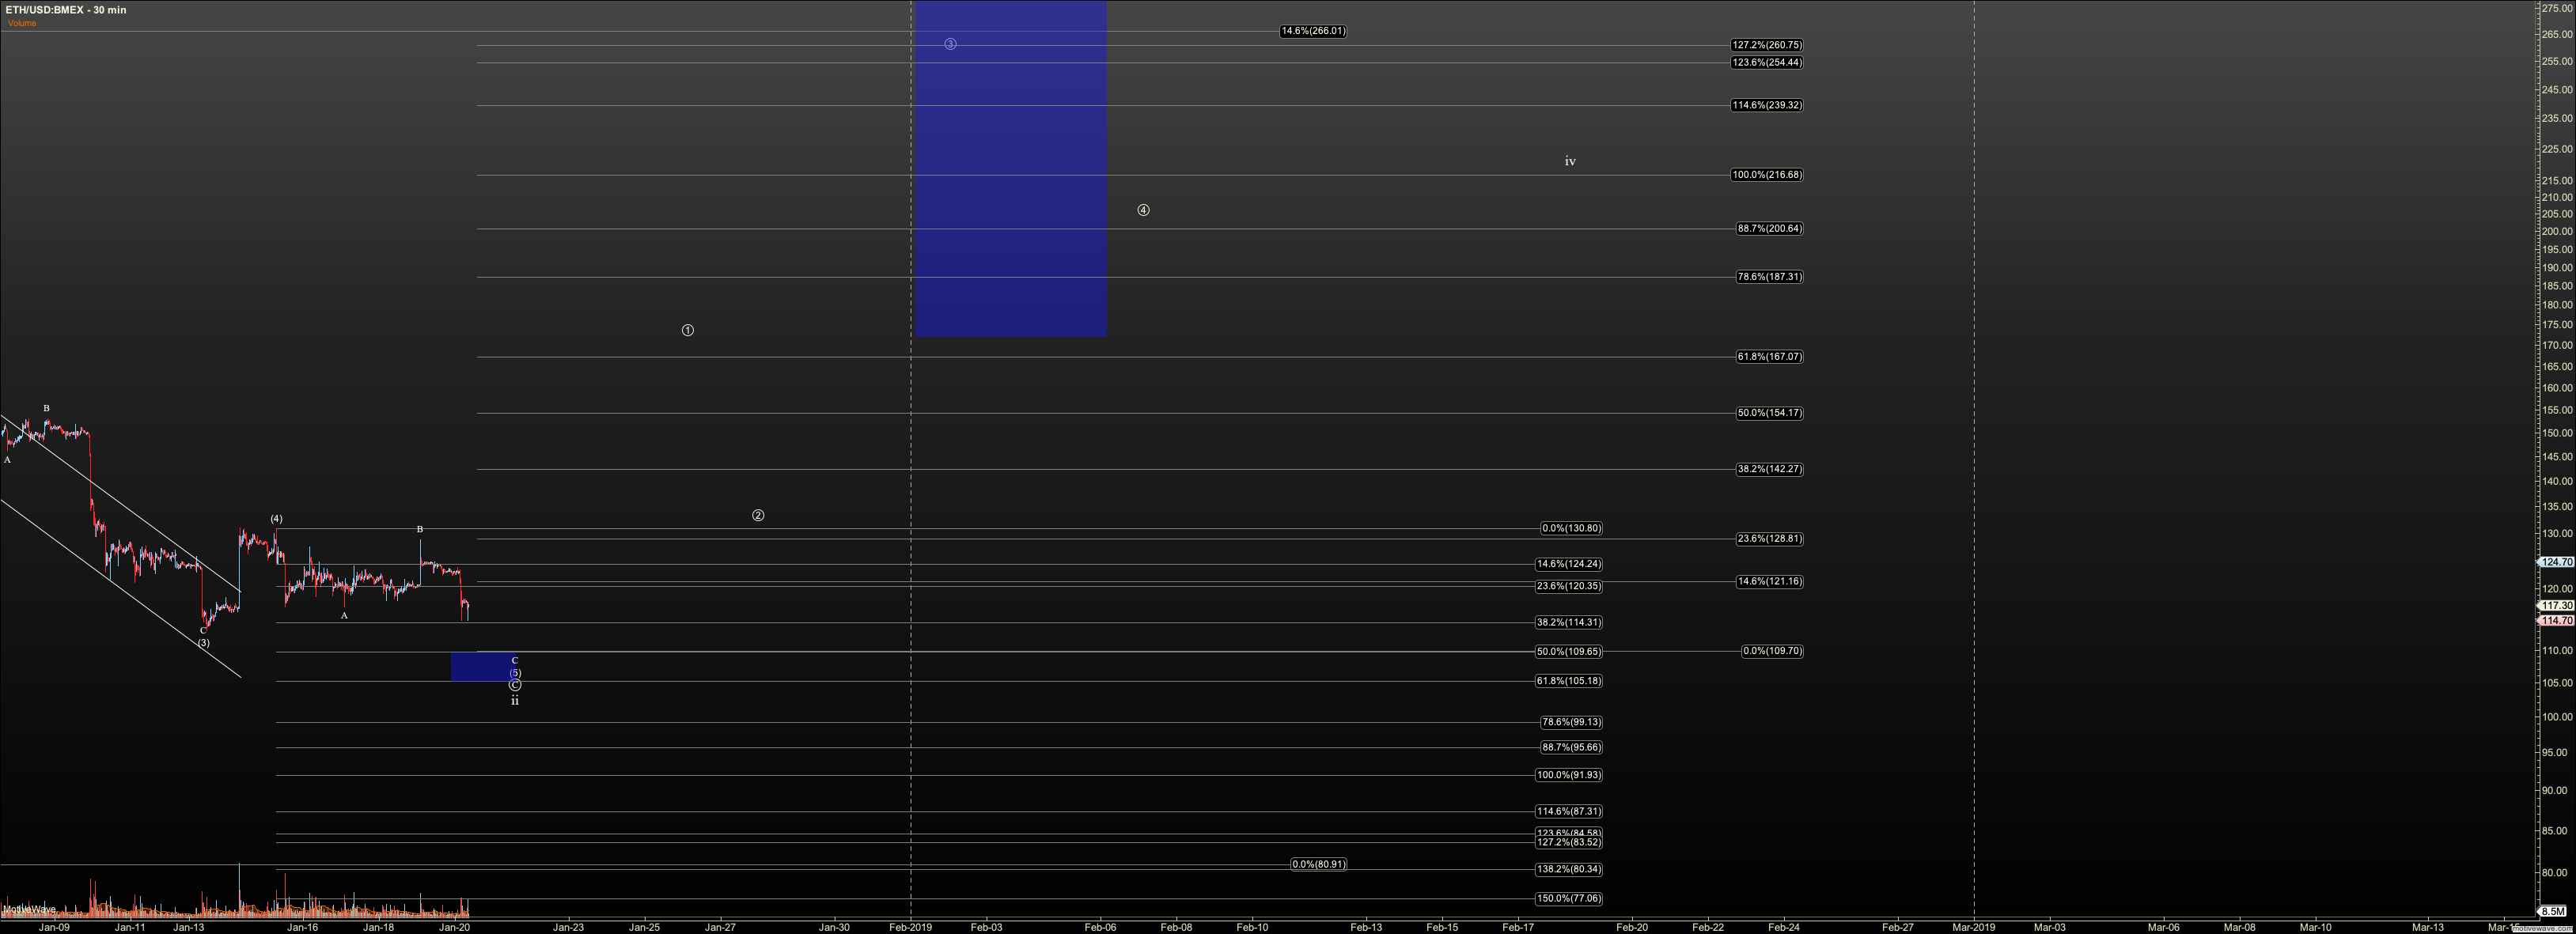
Ethereum
I currently have $105 to $109 as the probable zone for a bottom, and strong over $121 suggests this small wave 5 is complete.
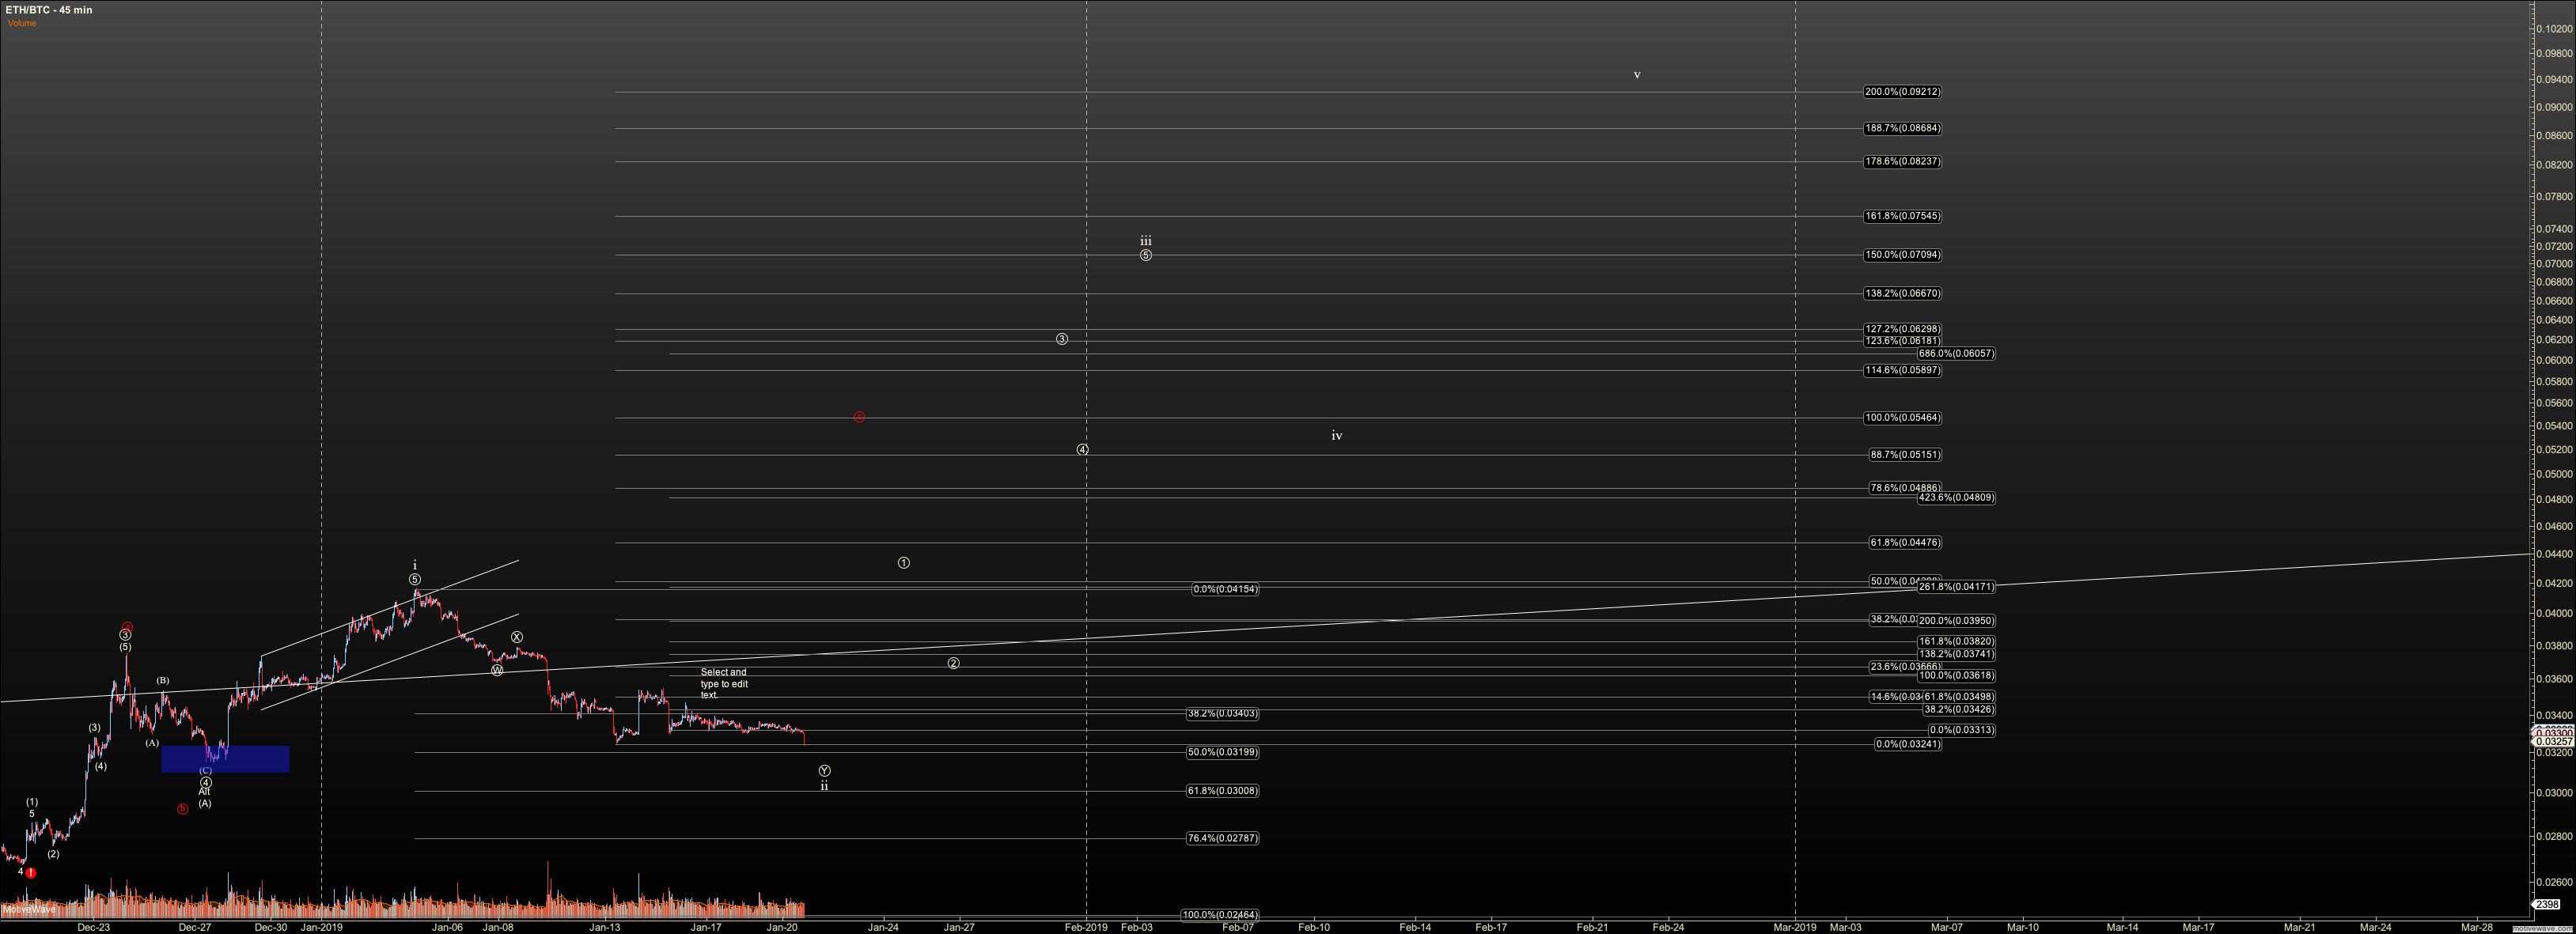
I have ETHBTC wrapping up a WXY as long as it holds .03
No change to GBTC at this time, and still quite unclear.