Price Action Attempting To Stabilize, Still Threatened By Prolonged Correction
 By
Ricky Wen
By
Ricky Wen
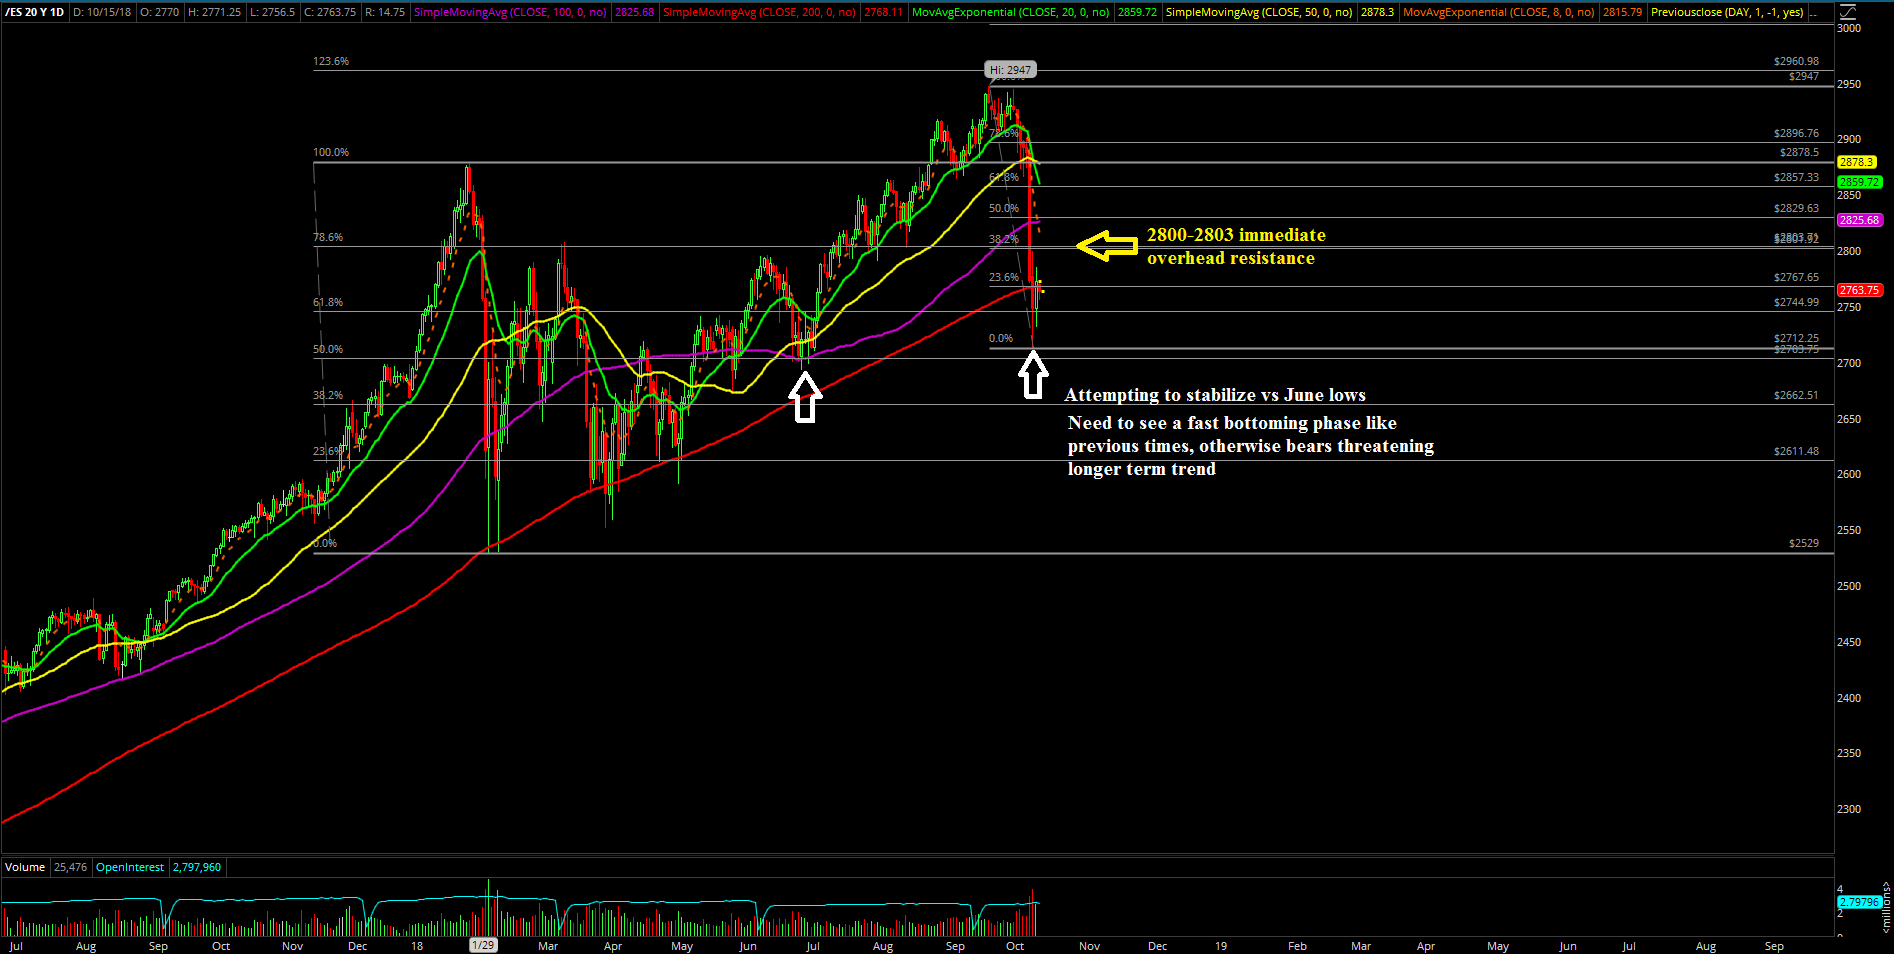
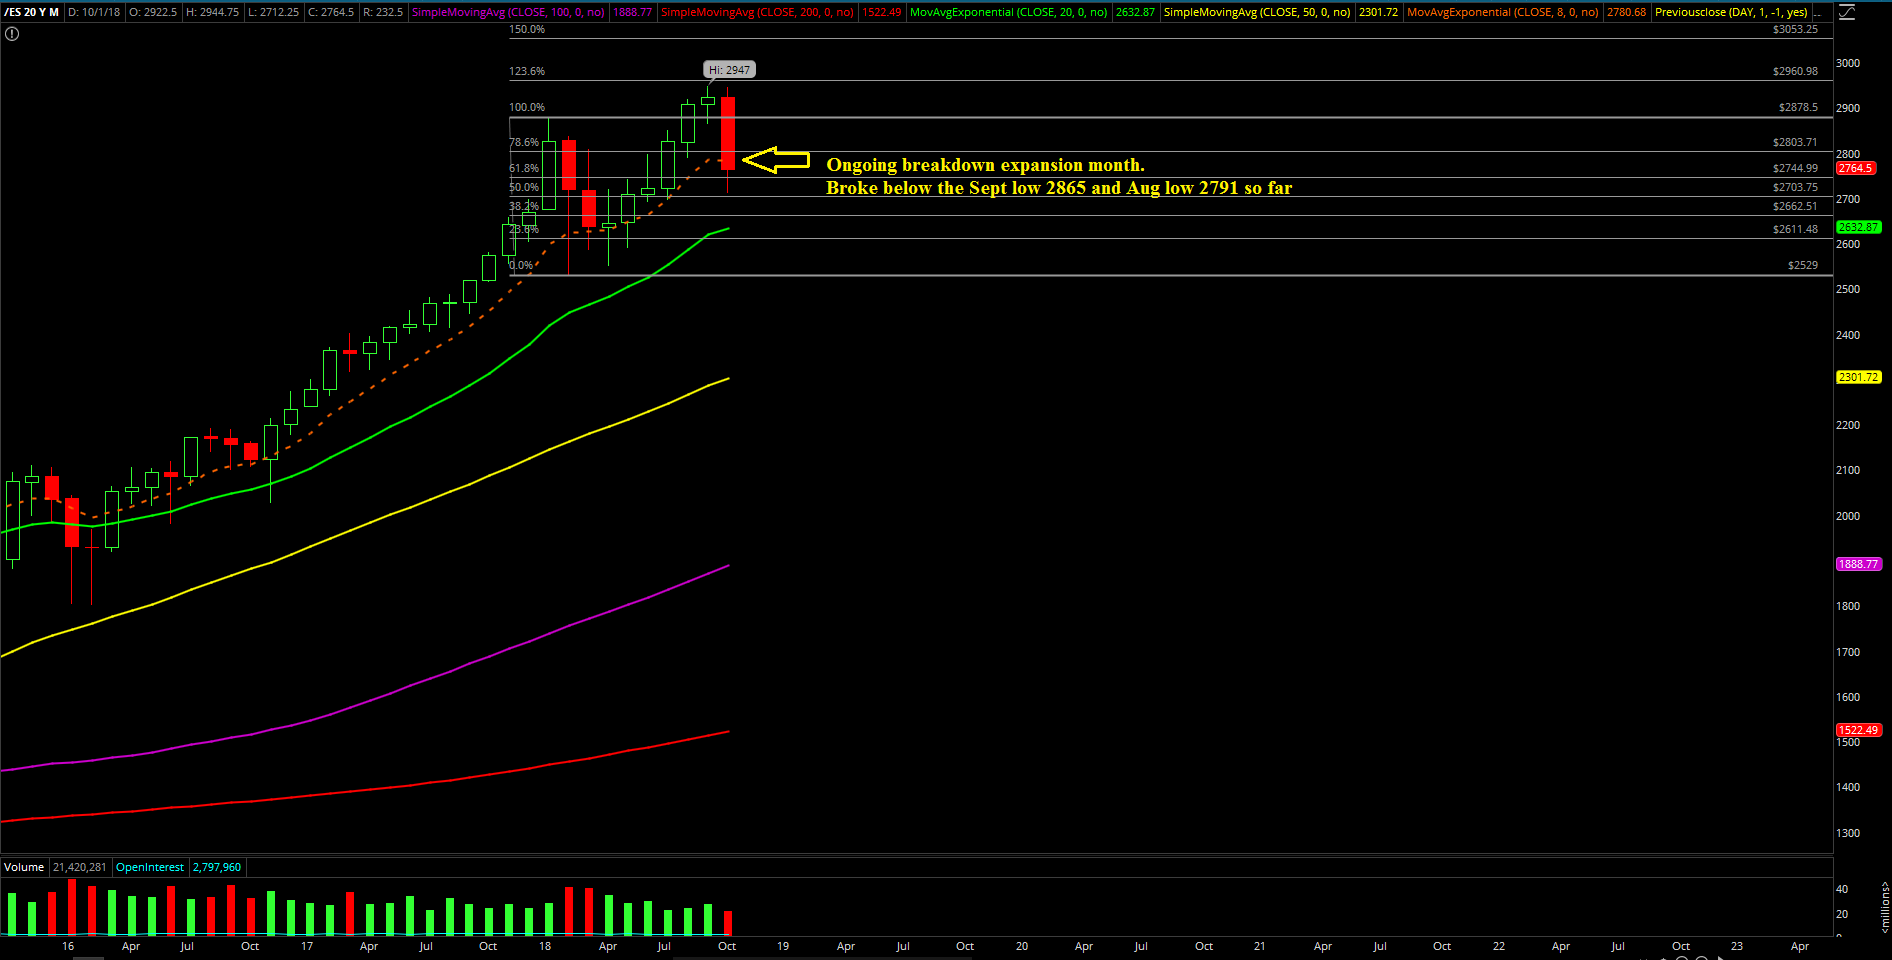
The second week of October was a fast-paced breakdown that went from inside month context (2947-2865 on the S&P 500) into a downside range expansion month. This was given what transpired with the 2865 must-hold support from Sept lows being broken and immediately opening up the next supports at 2820 and 2803. Those levels were quickly blown through on Wednesday as the bears accelerated towards the macro 200 day trending support in the 2760s by the end of the session.
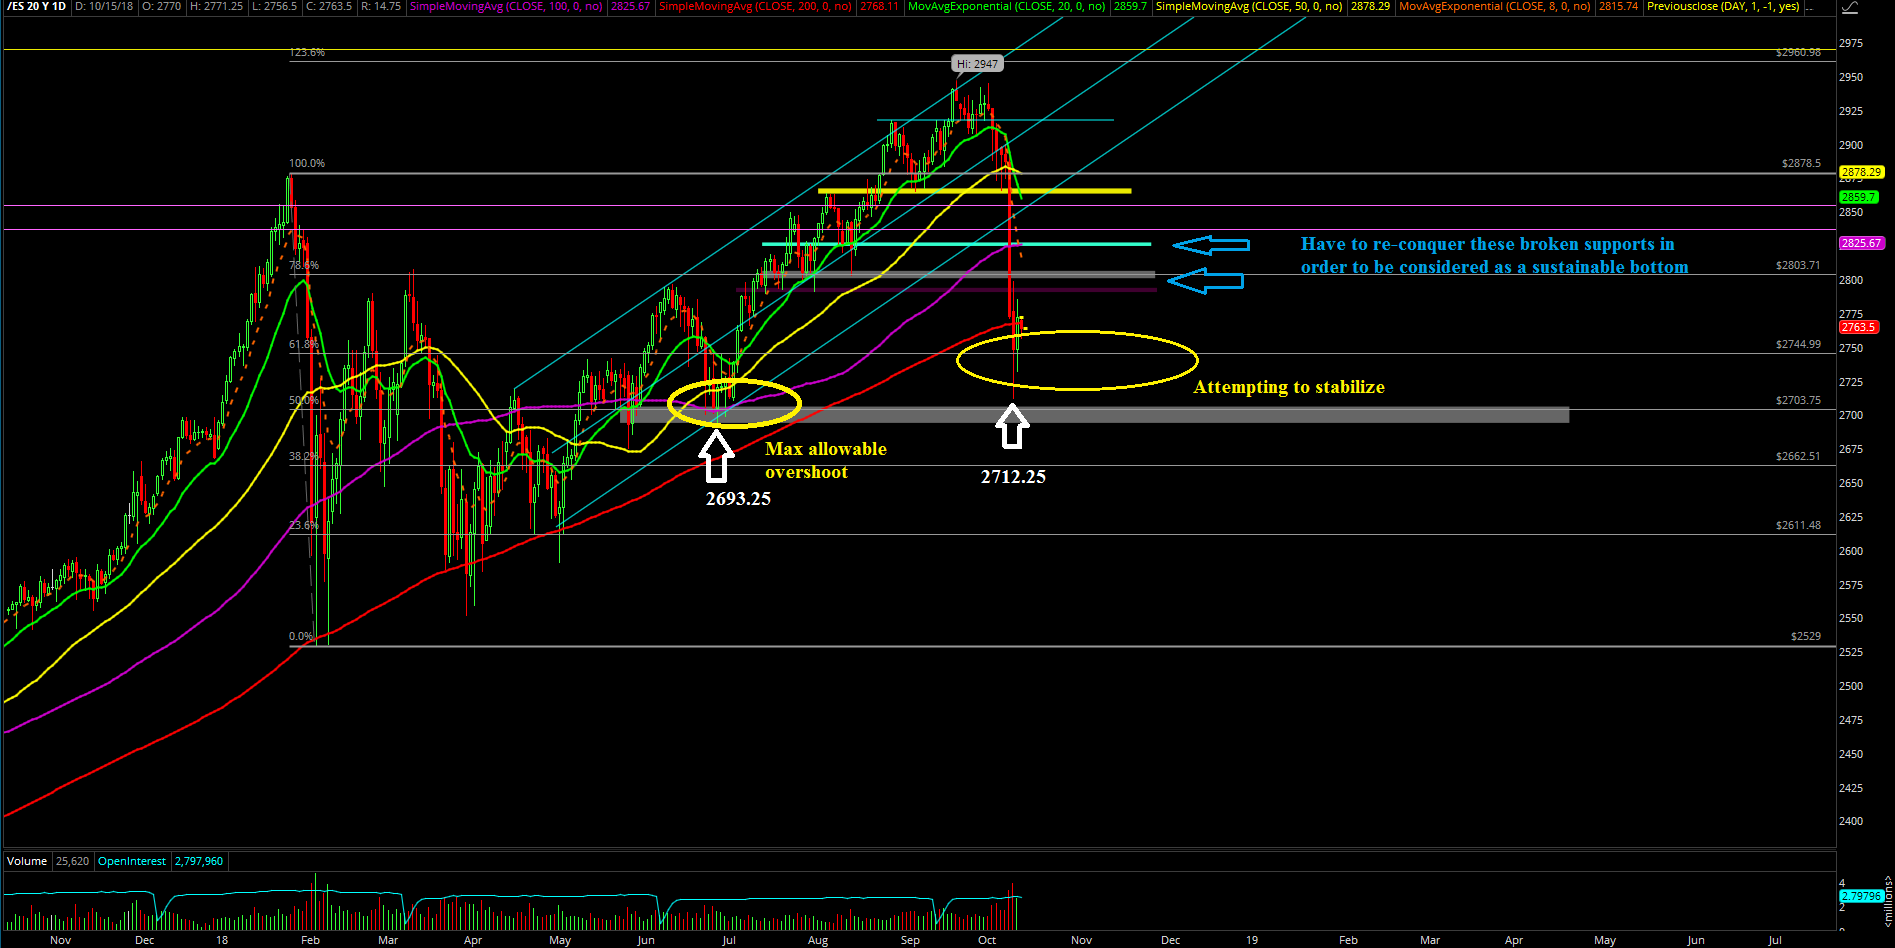
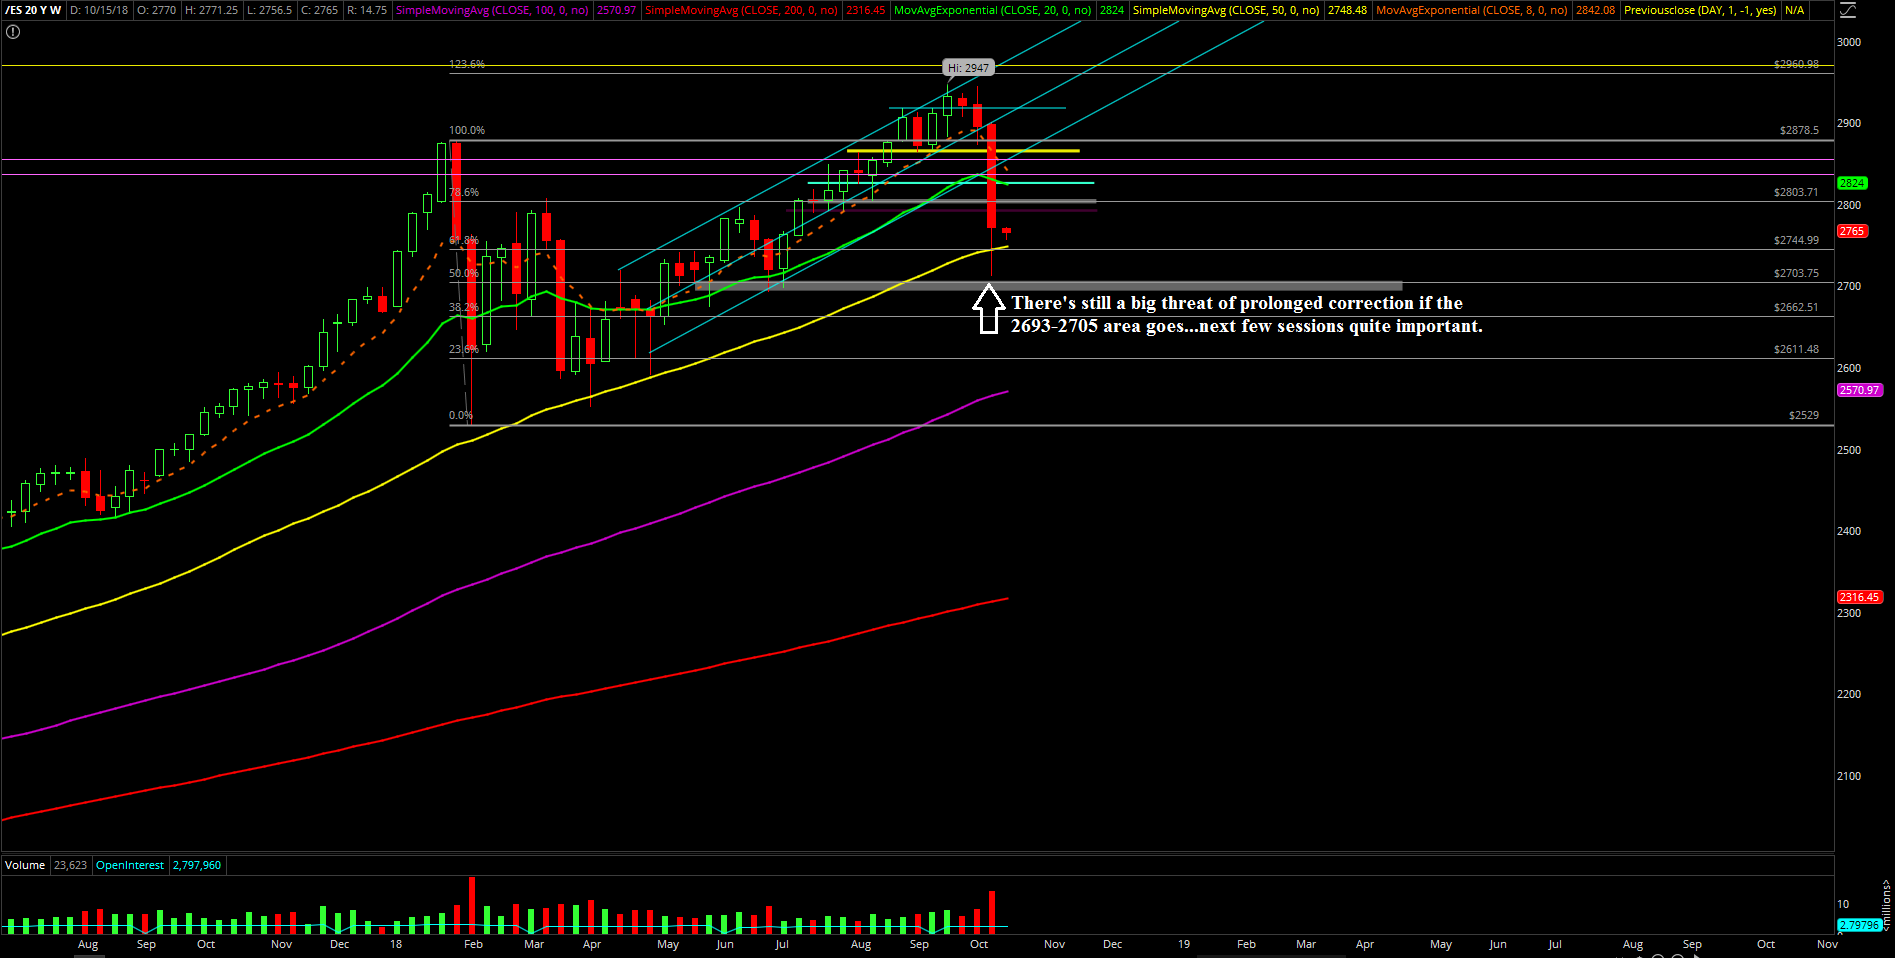
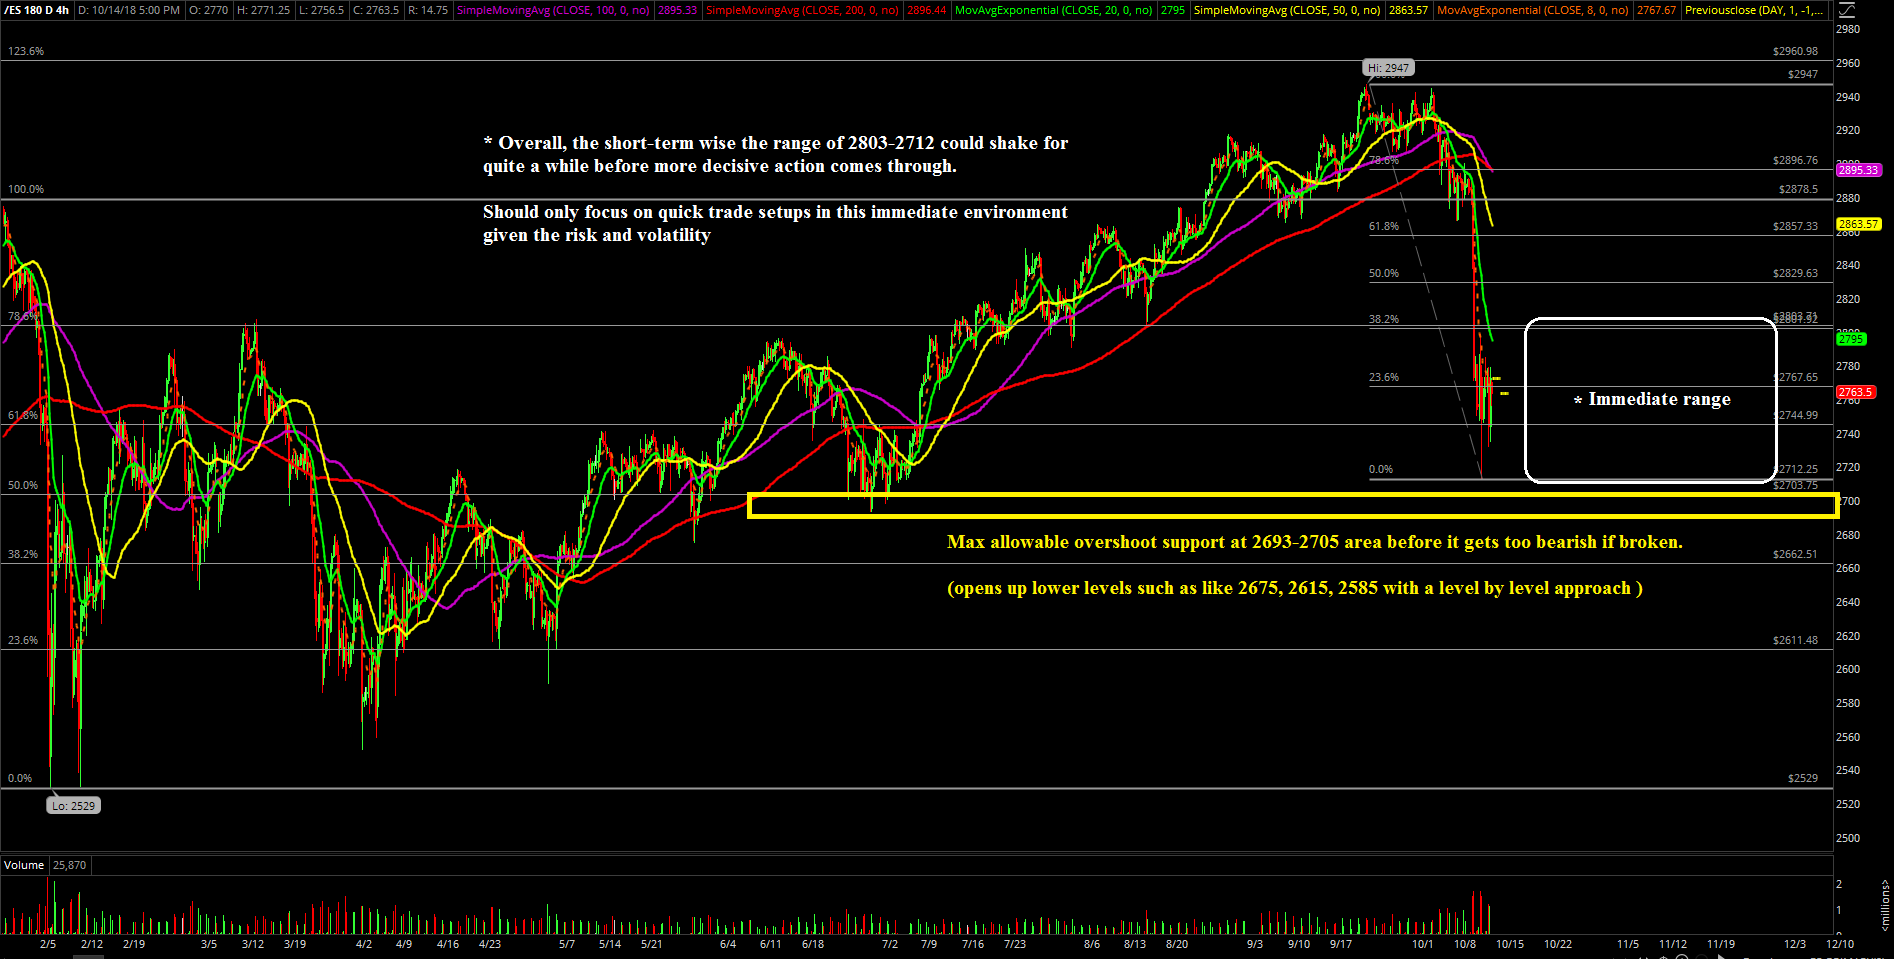
The action from the rest of the week was trying to stabilize above the 2693-2705 June low supports before things got way too bearish across the board. The bulls are holding onto a temporary low of 2712.25 from Thursday so far that acts as an ongoing sticksave pattern heading into the new week if resistances such as 2803/2820 gets re-conquered soon enough to further enhance the odds of a reversal bottom. Otherwise, the threat of a prolonged correction is still active if our max allowable area from the 2693-2705 June lows goes, opening up 2675, 2615 and 2550 on a level by level basis approach.
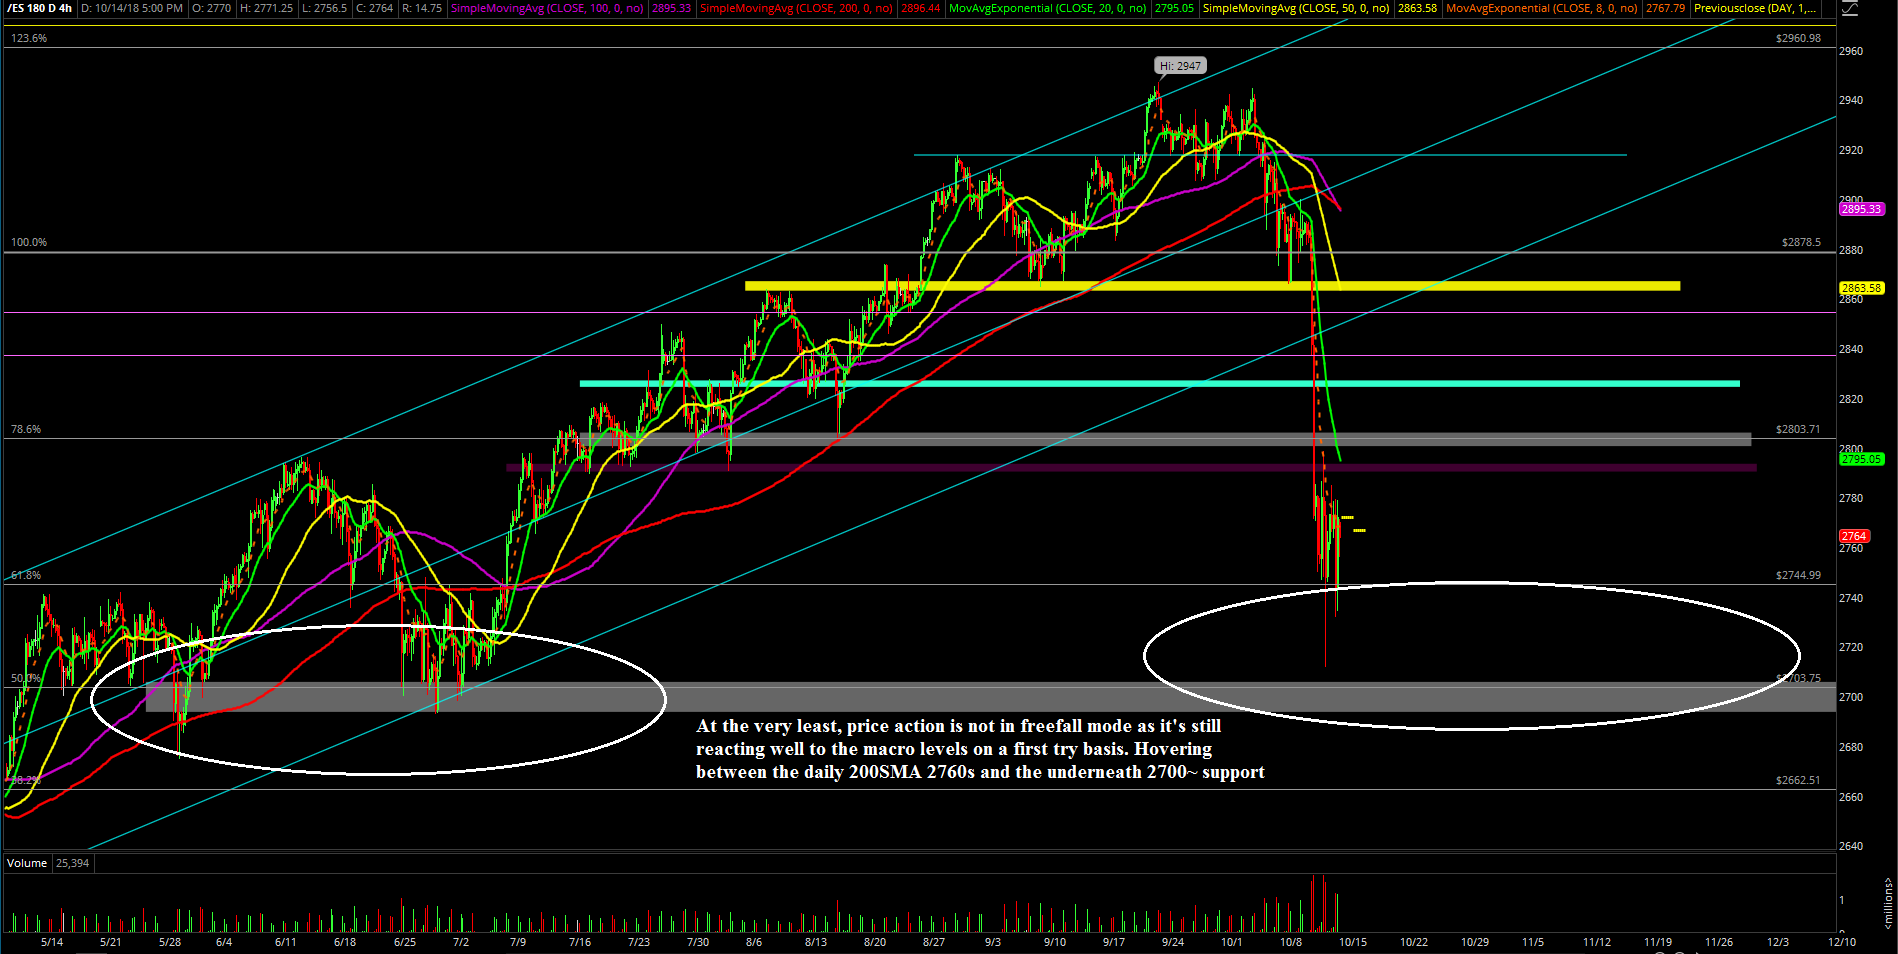
The main takeaway from this week is that the market is currently backtesting one of the key macro trending supports with the hover around the 2760s, which is coincidentally the daily 200SMA area. In addition, the market is being threatened by a prolonged correction phase to much lower levels if a quick reversal/stabilization does not occur soon versus the current support area here or around the max allowable overshoot to June lows.
Obviously, the overall risk appetite and volatility has increased dramatically in this environment, so traders should be aware of their position sizing and risk management going forward. Also, traders need to separate the intraday opportunities versus the mid/long term positioning here given the huge inflection point on whether it’s going to get another typical reversal like previous times or whether something new is actually happening.
What’s next?
Friday closed at 2772.25 with the price action trying to work off a micro double bottom setup (Thurs low 2712.25, Friday low 2732.25). The overall pattern still has a lot to prove given it is currently being sandwiched between our max allowable overshoot at 2693-2705 support and the daily 200SMA in the 2760s. Max allowable overshoot means the support area has to hold before things turn too bearish or very bearish in the short-term. The 2712.25 temp low is a good start, but needs a lot more such as 2803/2820 getting re-conquered in order to enhance the odds of a reversal pattern playing out instead of the prolonged correction threat.
In the former case, if price action showcases the stabilization needed by taking back 2803 and 2820 decisively in a quick manner during this next week or next, then the odds of a temporary bottom into a sustainable bottom becomes more valid. In the latter case, if price action doesn’t get back above the immediate resistance levels, then that max allowable overshoot 2693-2705 would get threatened and a breakdown would open up the risk of much lower levels such as 2675, 2620 and 2590 from earlier this year.
Micro wise, we’re expecting this relatively large immediate range of 2803-2730 or the bigger 2820-2693 to be focused as quick in and out action so intraday traders ought to be more nimble in this environment in order to capture some points. Conservative players could focus on the extreme range levels rather than play the middle ground when the opportunity comes along. For now, we must stick with a level by level approach as mid/long term timeframes are at an inflection point/huge support area, and knowing the different timeframes at hand here is pivotal.
Overall, we think the approach of stalking for setups and building out mid/long term positions in individual stocks given the clear risk vs. reward when combined with short-term ES trading here may be the best strategy in this type of environment -- unless, of course, the respective macro supports 2760s/2693-2705 start breaking and we have to use the 2675, 2620, 2590 downside levels as they open up. (Some of our favorite tech stocks may be ready soon if we see some stabilization take place over the next few sessions.)
The main underlying context/thesis of the broad market is that the price action is still working within a macro bull trend basis for the time being, so we’re going to stick with has been working in terms of the longer term trend as it’s not a freefall correction. The obvious main reason is that the risk vs. reward would be tremendous around here if this is part of a reversal pattern bottoming around the macro support like the past few instances in the last two years that eventually make its way towards a new all-time high.
Too soon to tell in terms of odds, but at least the very first bounce would still be tradable if you do your timeframes correctly.