Pressure Remains Down In Metals . . For Now
 By
Avi Gilburt
By
Avi Gilburt
As of my writing this update just before 2PM on Wednesday, the pressure remains down in the metals complex. So, let’s look at each of the 3 charts individually.
As we know, we have been trying to determine if this pullback is a 2nd wave (or even a b-wave when it comes to silver and gold), or whether we are going to see levels lower than seen this past summer before the next rally begins. And, the market has not yet made that clear.
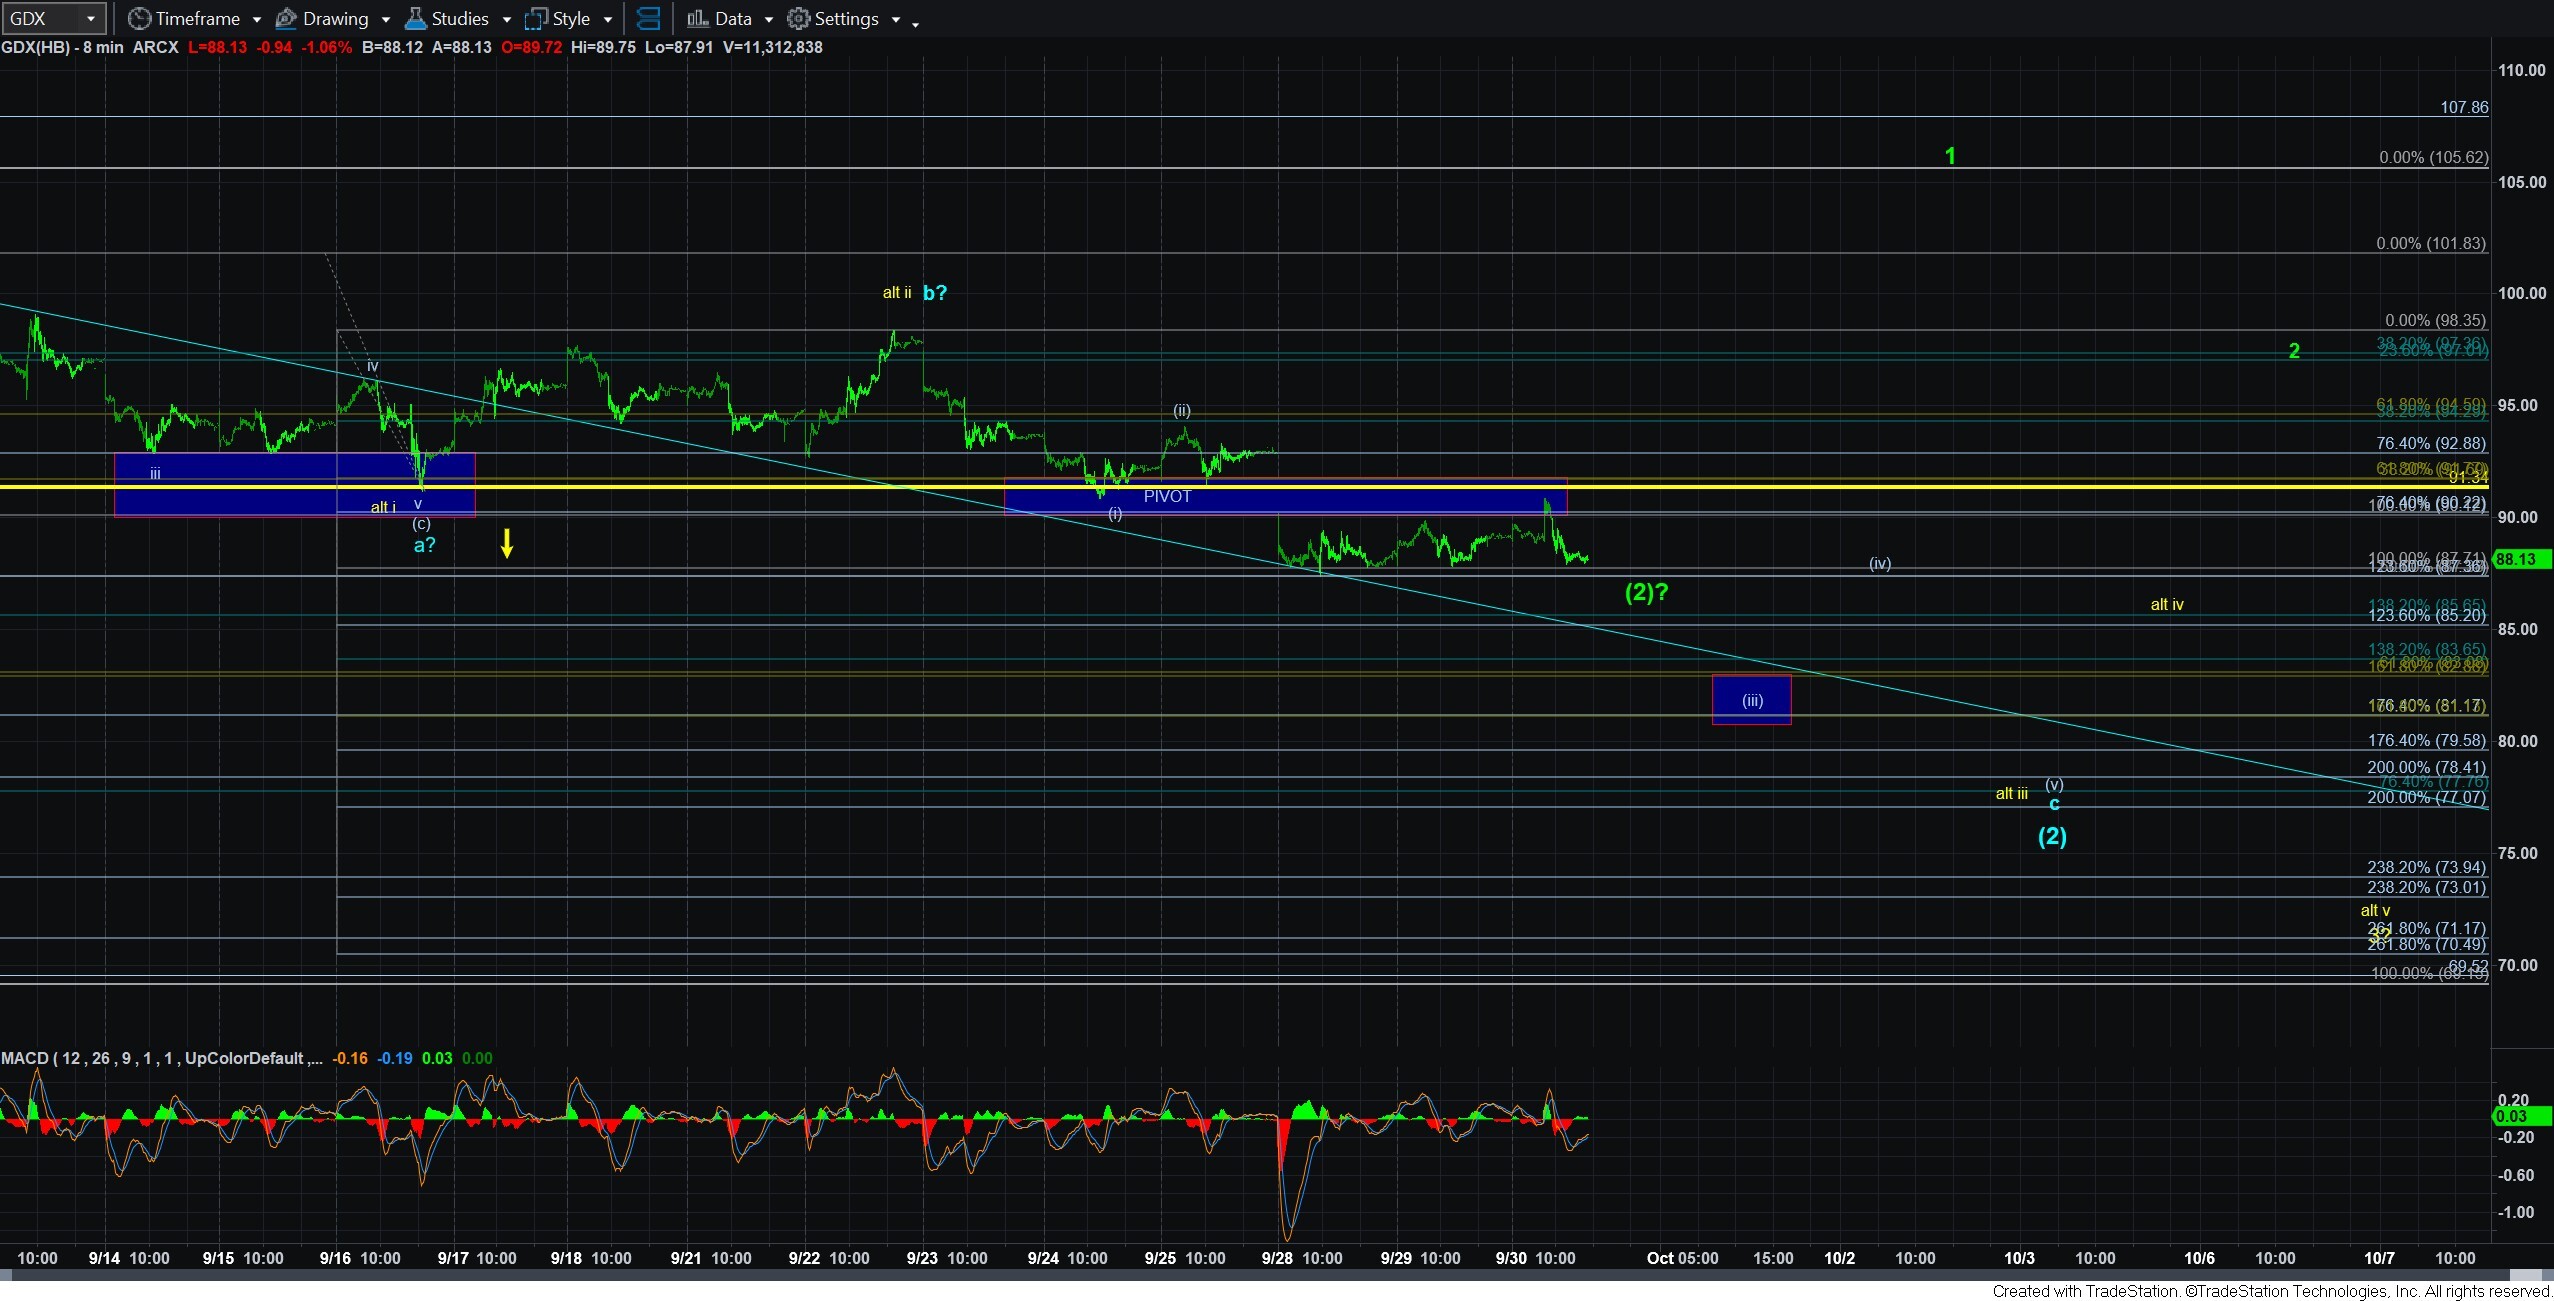
In GDX, I really have no evidence that the green wave (2) should be a strong wave count at this time. In fact, the market went up to just below resistance this morning and then has dropped in a seemingly impulsive fashion. If you are wondering what the yellow line on the 8-minute chart represents, that is a relatively important micro resistance as it represents the bottom of the first wave in wave (iii).
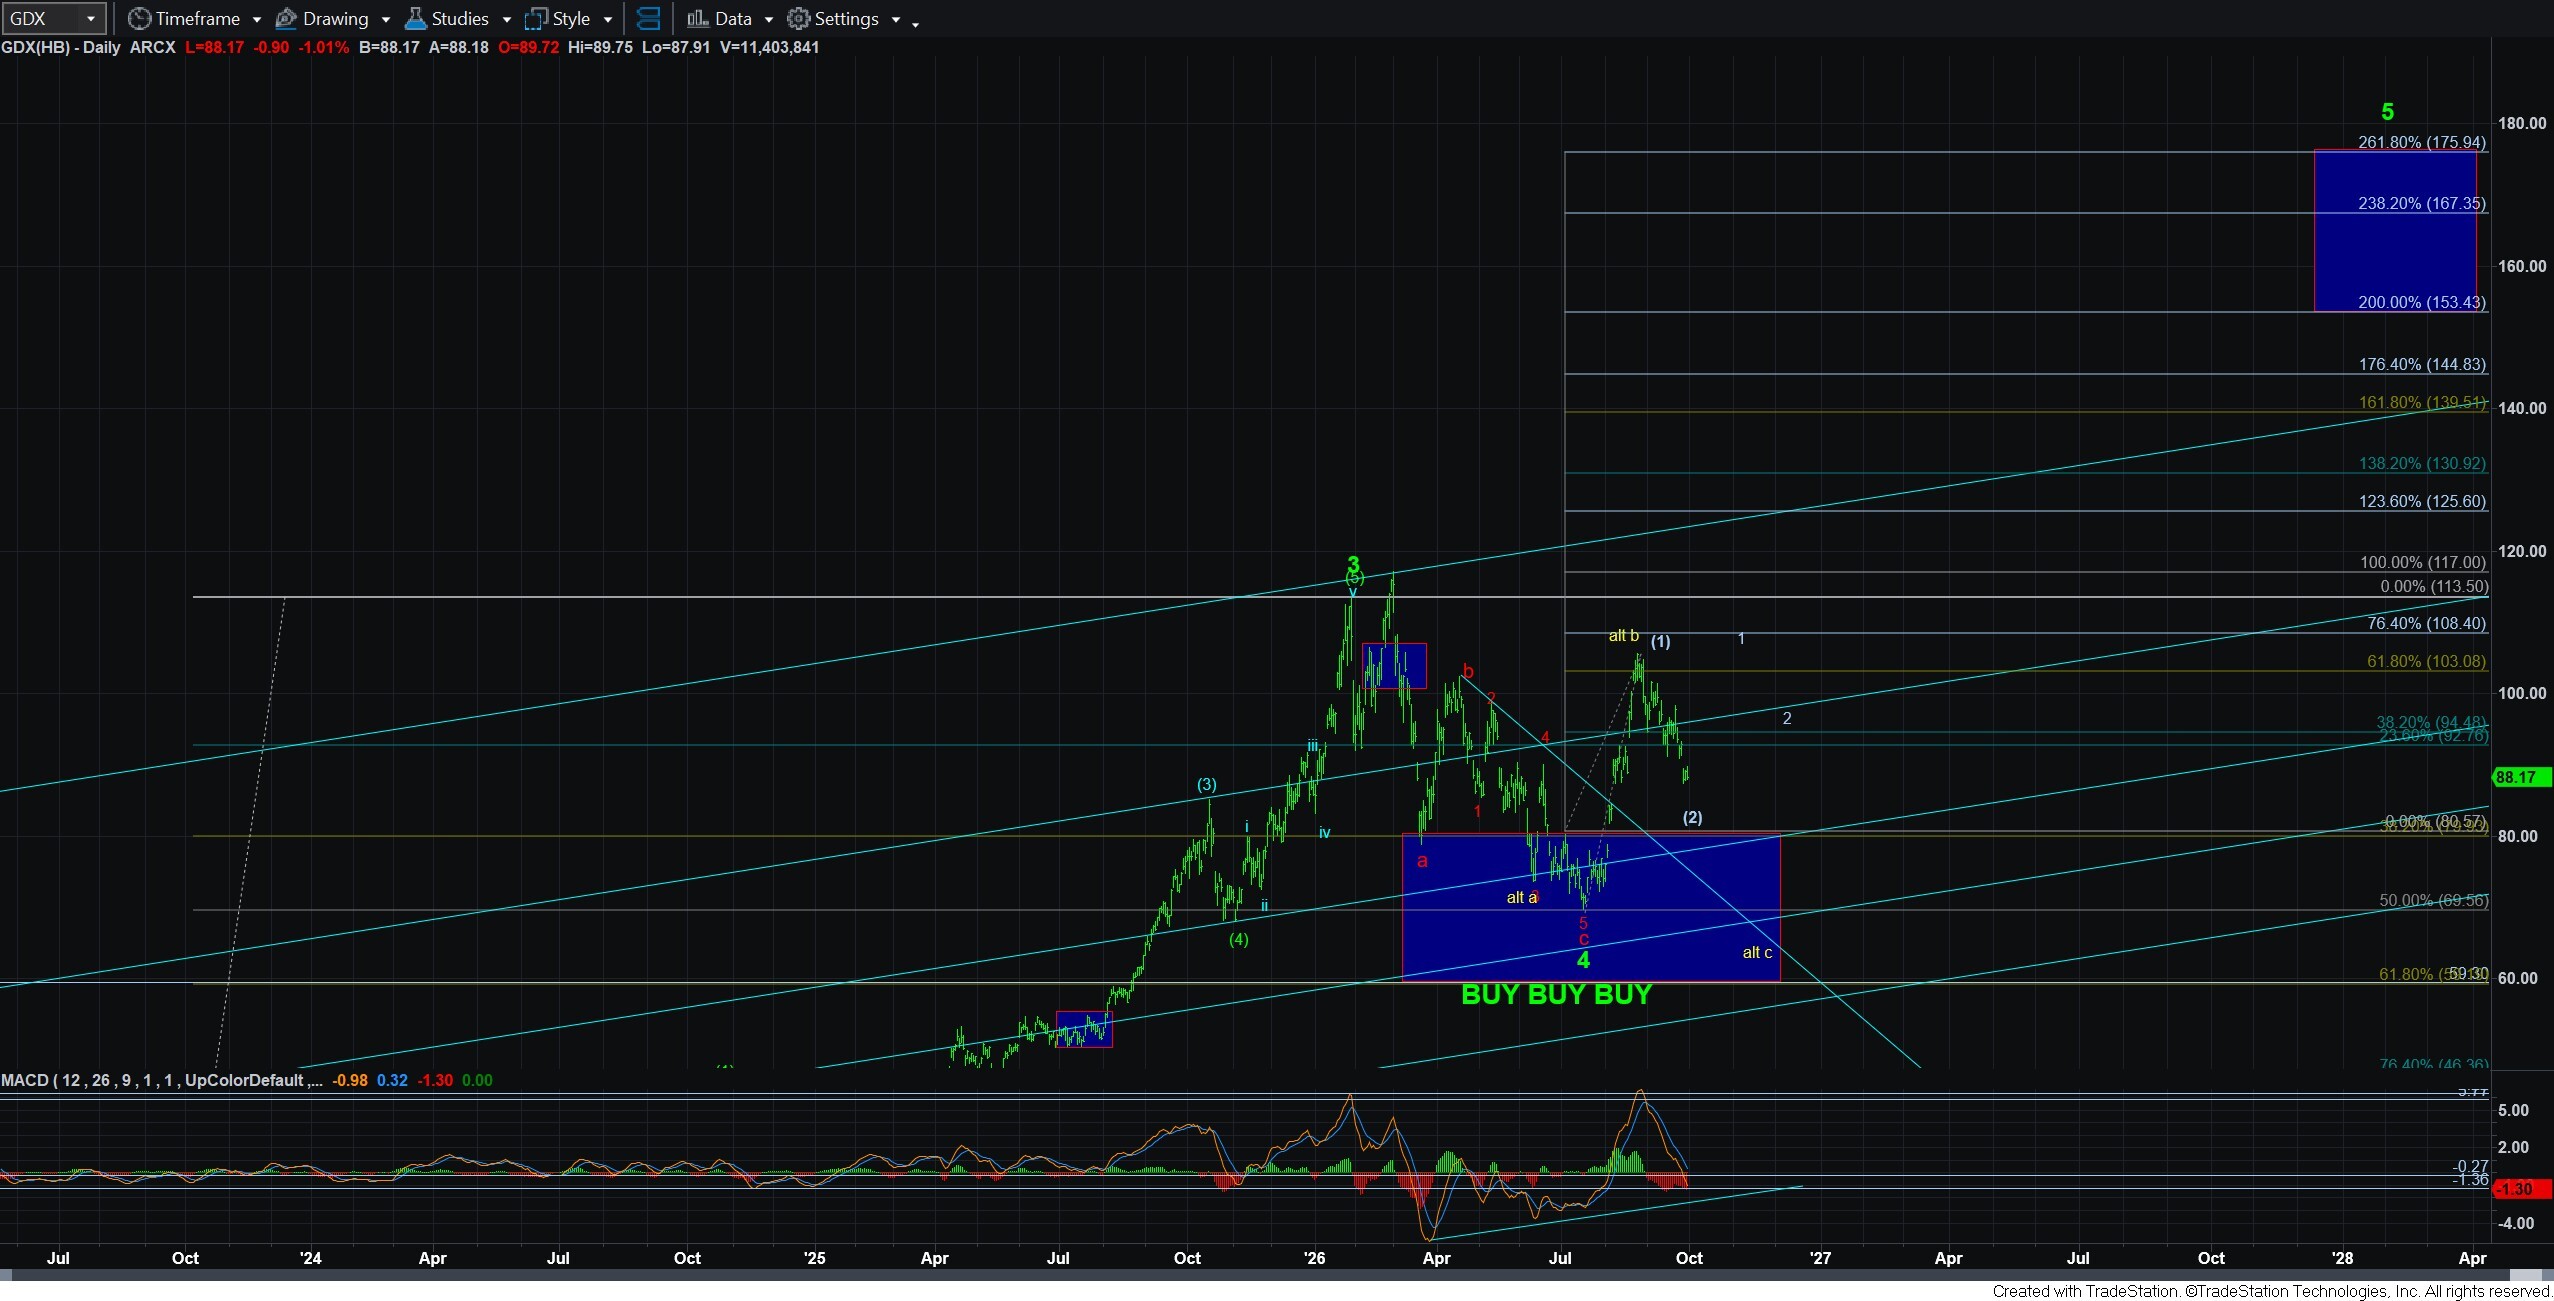
As long as the next bounce is clearly corrective and we remain below today’s high, I am expecting us to drop next to the wave (iii) target box on that chart. Should we see a sustained break of the 87 region, then I will likely take the green (2) off the chart, as that would suggest we are likely going to drop down to the .764 retracement region to complete waves (i)-(v), which will either be the completion to the c-wave of blue wave (2), or just wave iii of 3 in the deeper correction pointing to lower lows represented by the yellow count.
Again, at this time, I still have no clear indication where the market intends to bottom before the next rally begins. But, as noted, I will continue to drop resistance. Currently that resistance is the yellow line in the 91.34 region. Should we see an impulsive move through that line before breaking 87, then I would consider adopting the green wave (2) low. Until such time, pressure remains down towards the 77 region and the blue wave (2).
I would like to add that a number of mining stocks are approaching what can be a completion to their respective 2nd waves. So, please make sure you have a plan in place. After being stopped out from my GDX position with a small profit last week, I have begun to add a bit more in individual mining stocks over the last 24 hours. I will also add that the MACD on the daily GDX chart is now at a region from which many bottoms have been struck during the rally we experienced in 2025.
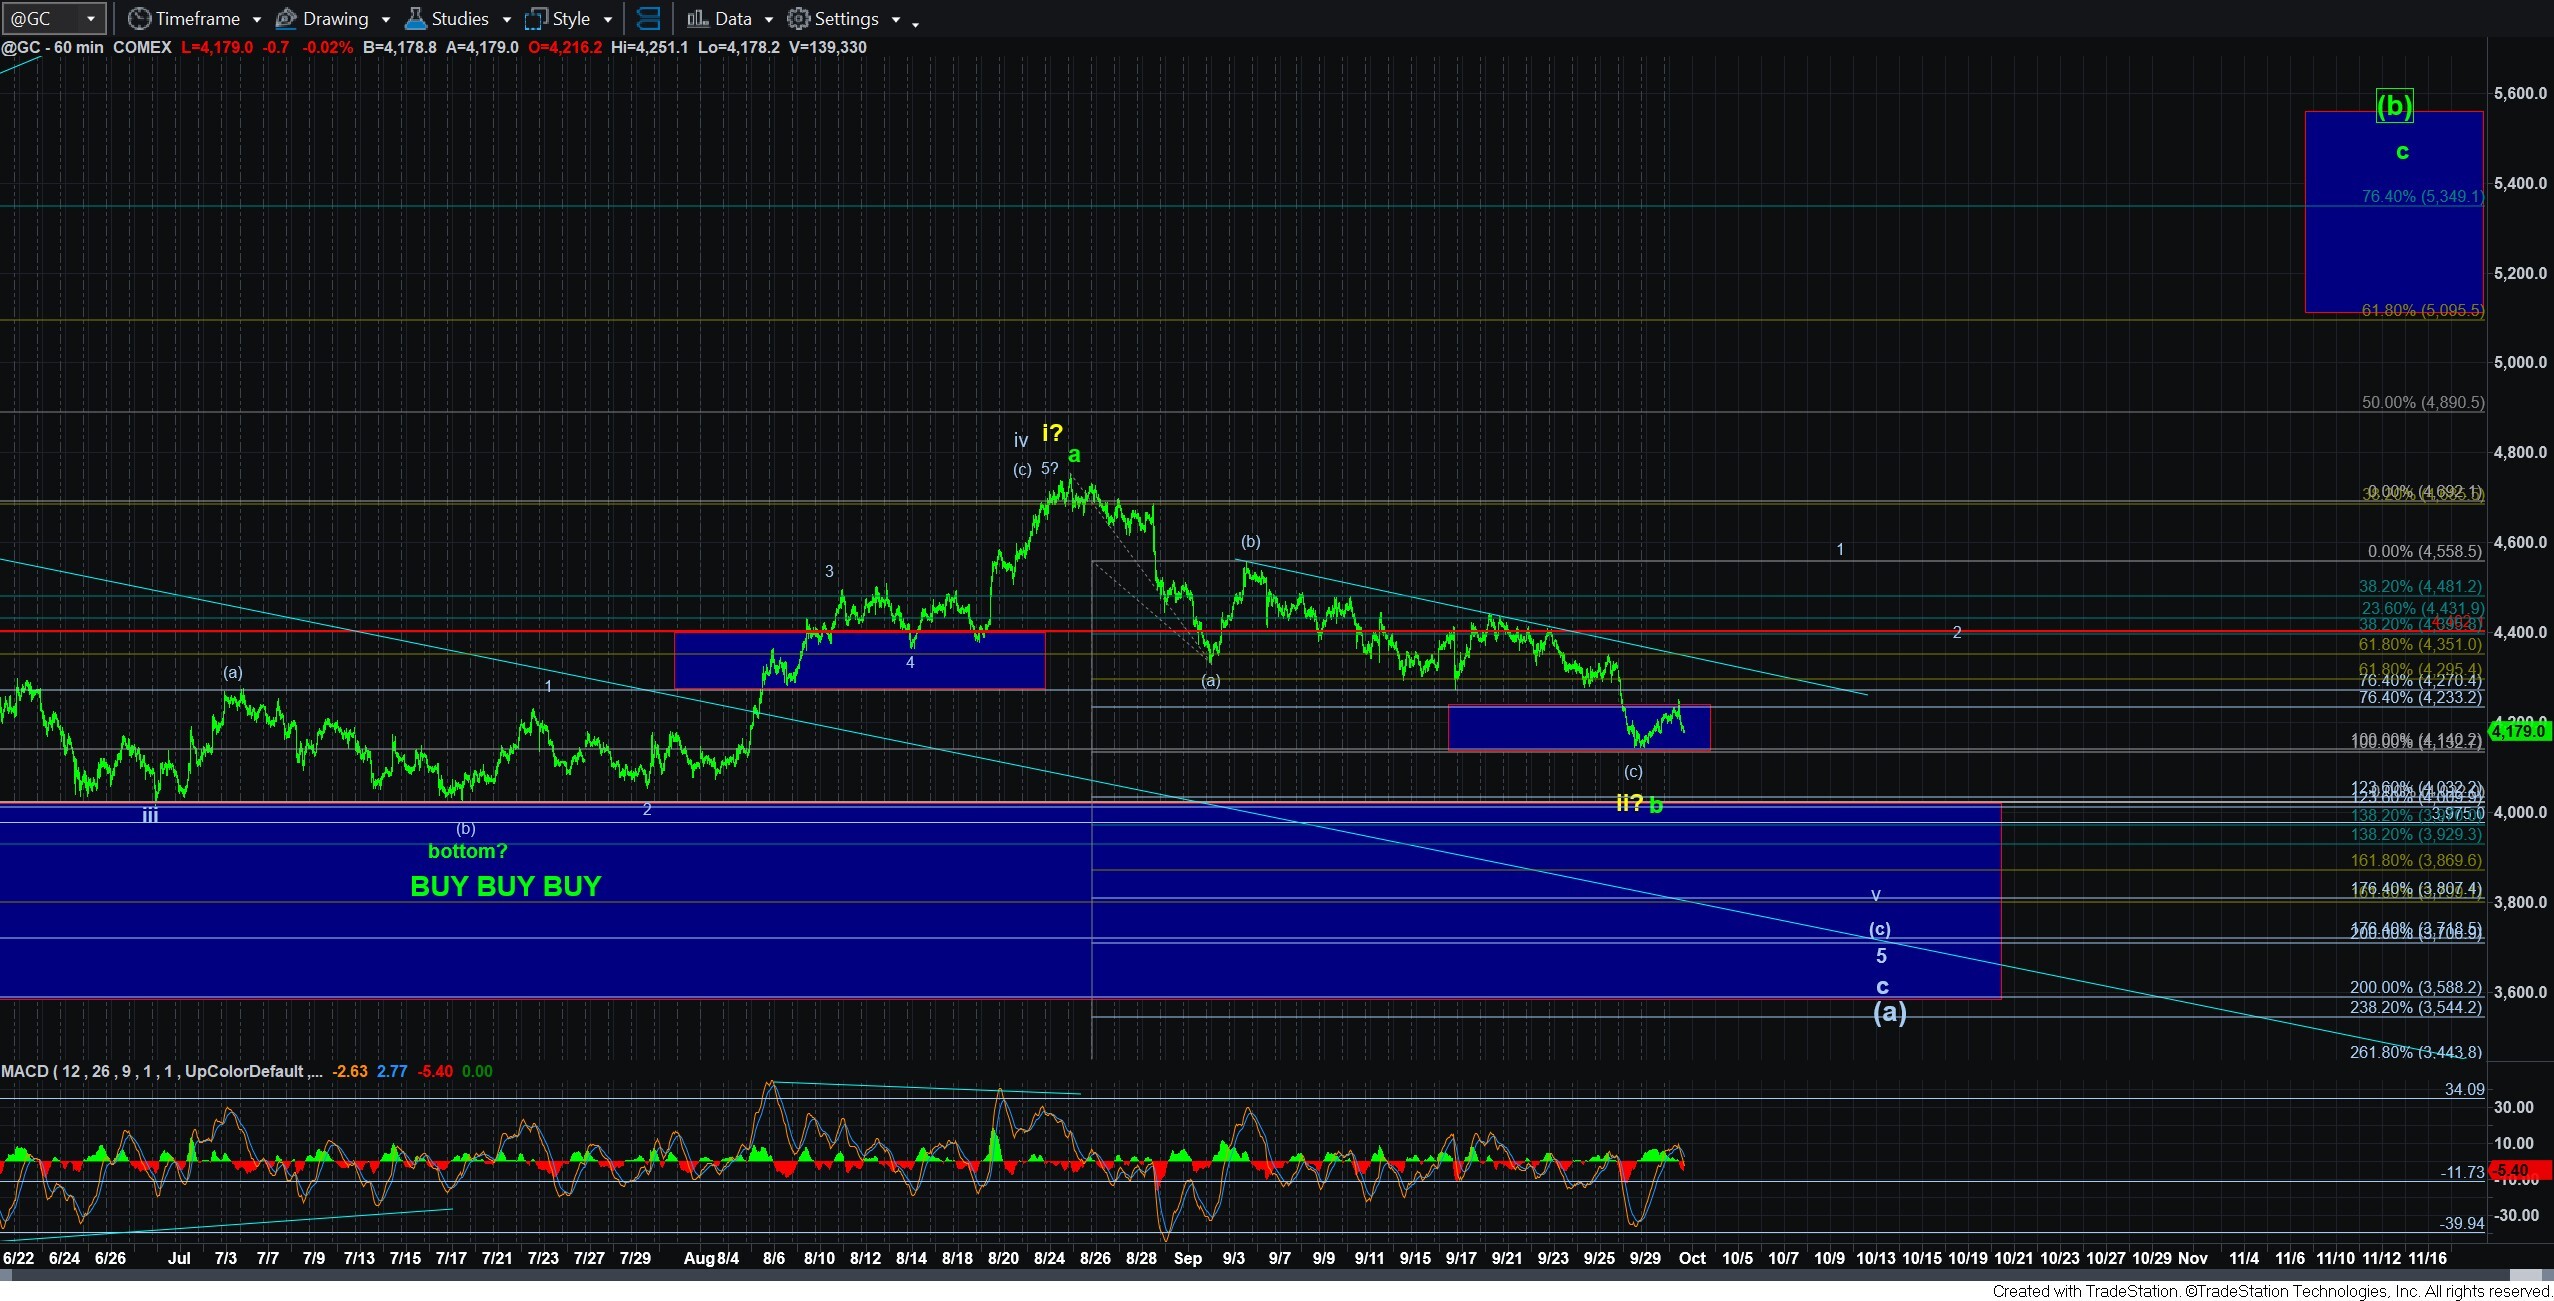
In gold, we have dropped to the (a)=(c) point which can represent the entire wave ii/b correction. Yet, that is also below the .764 retracement of the prior potential i/a rally. And, the rally off the potential (c) wave low is only best viewed as a leading diagonal. Since I do not view leading diagonals as reliable opportunities, this clearly leaves us with an unconfirmed bottom. Moreover, the drop from today’s high can be viewed as a 5-wave decline. Therefore, as long as we remain below today’s high, I have to assume we are heading lower to complete this correction with lower lows in the larger degree (a) wave, with an ideal target in the 3800 region.
Of course, if we can break back out over today’s high and complete a larger 5-wave rally, then I would view all pullbacks thereafter as being buying opportunities. But, for now, this is too unreliable to take that posture.
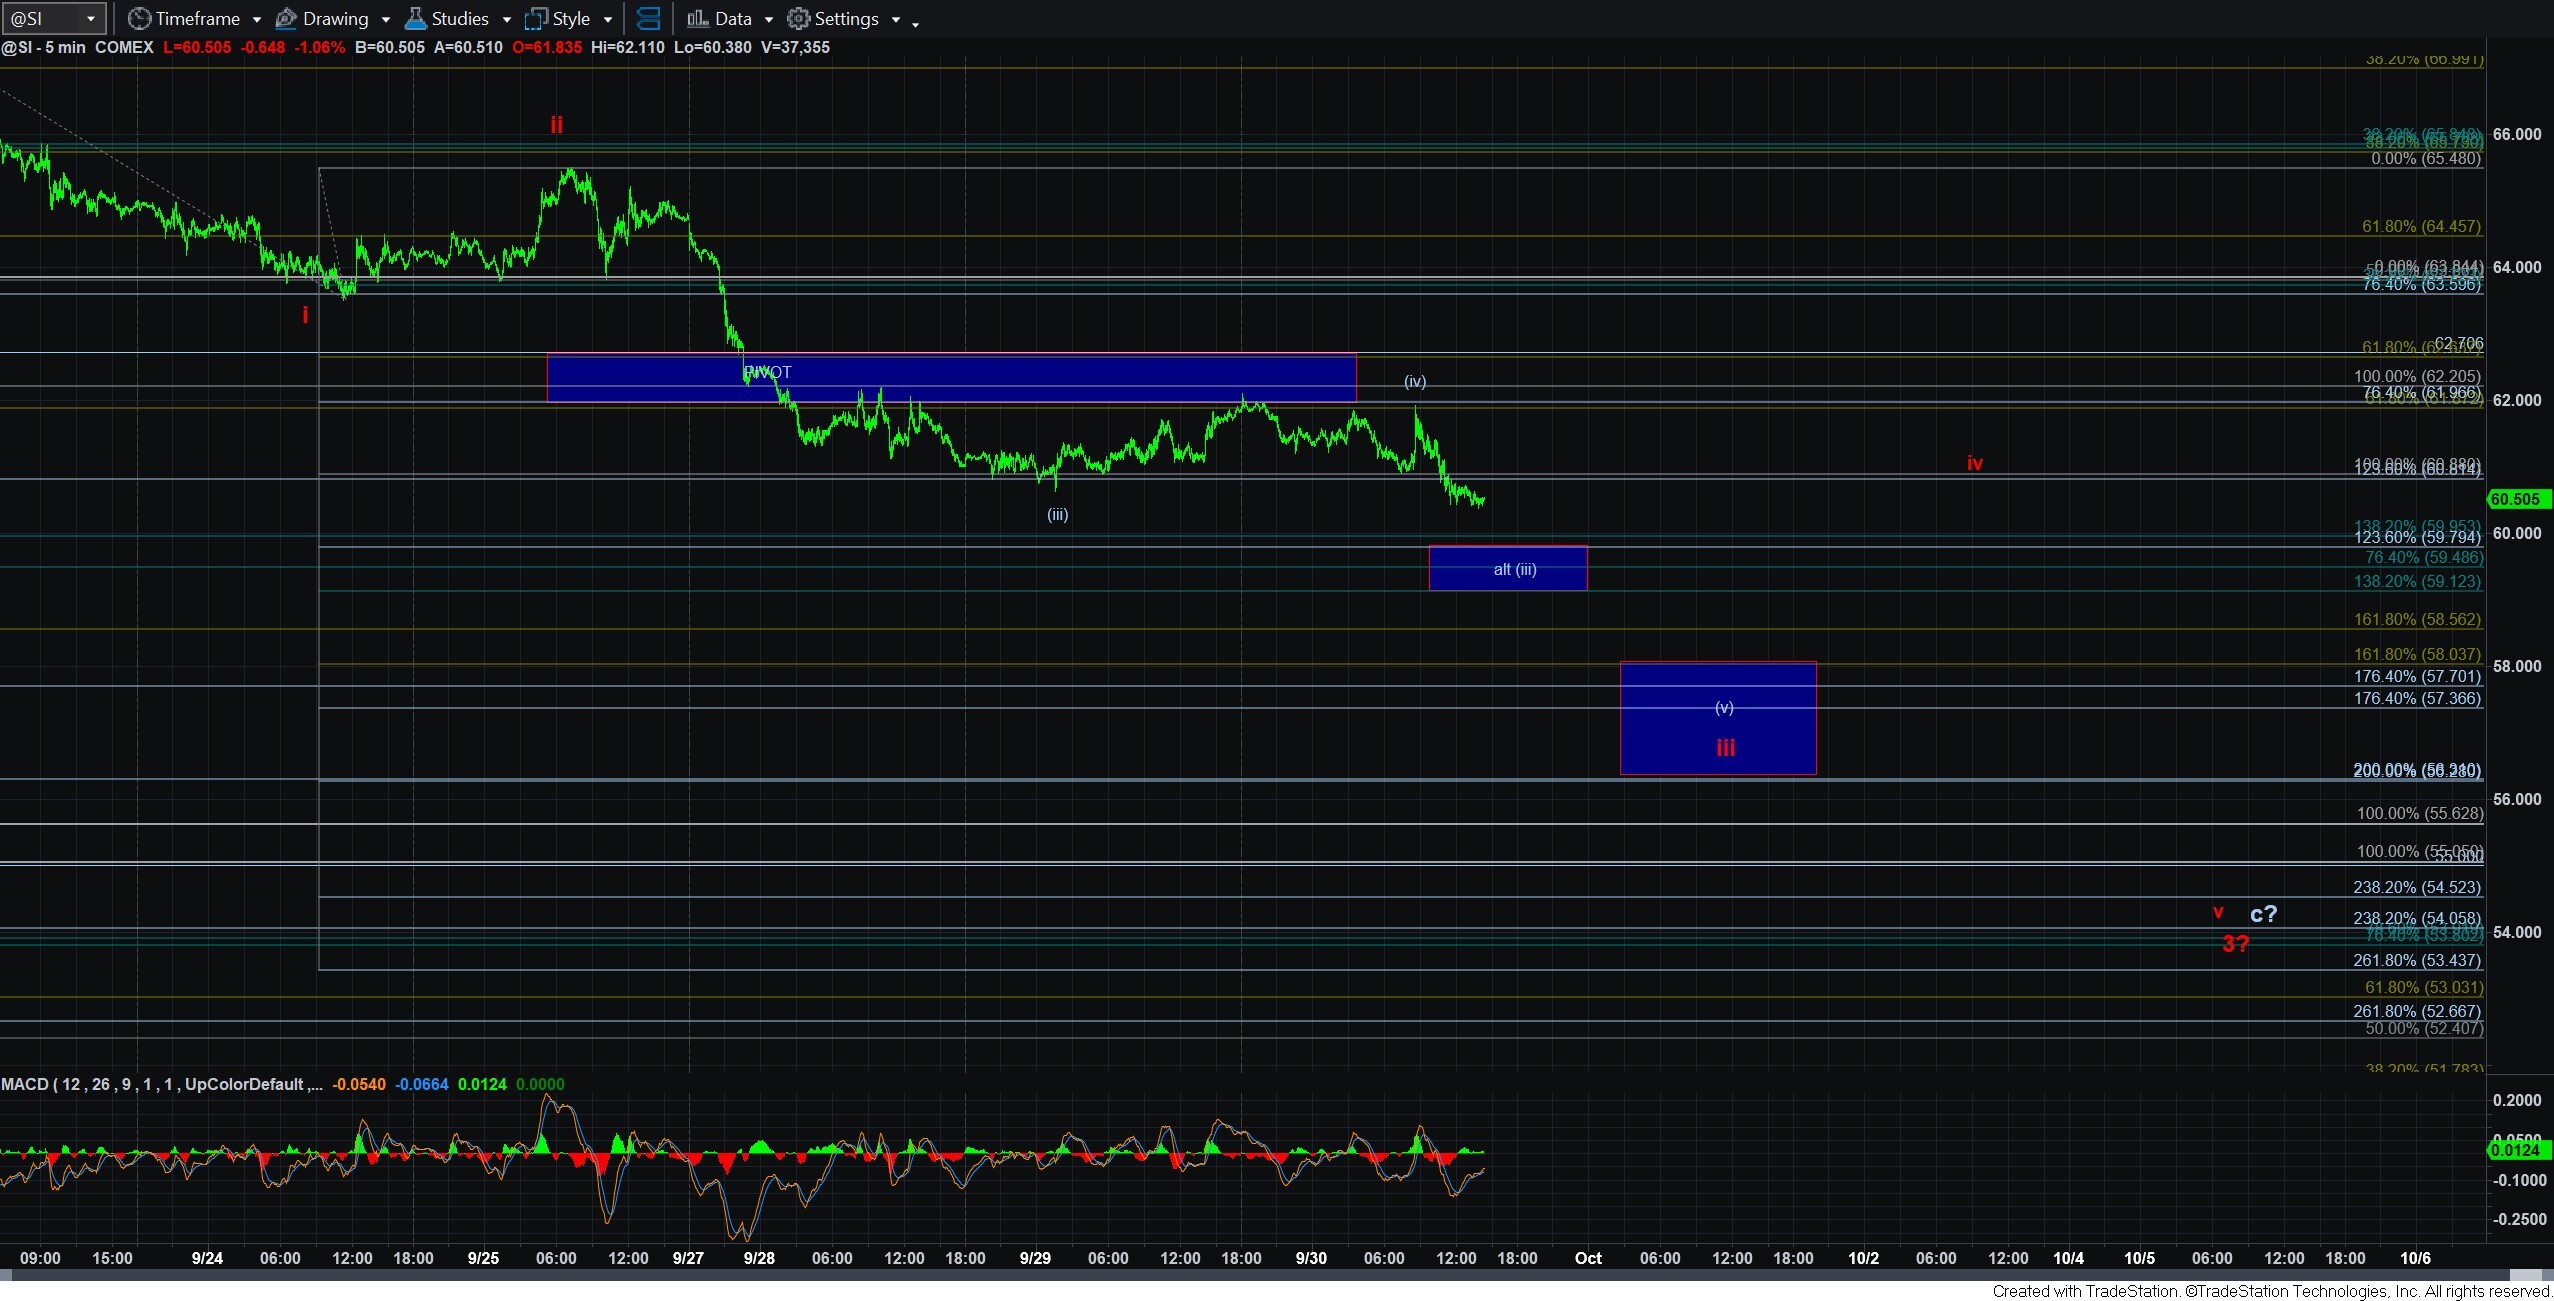
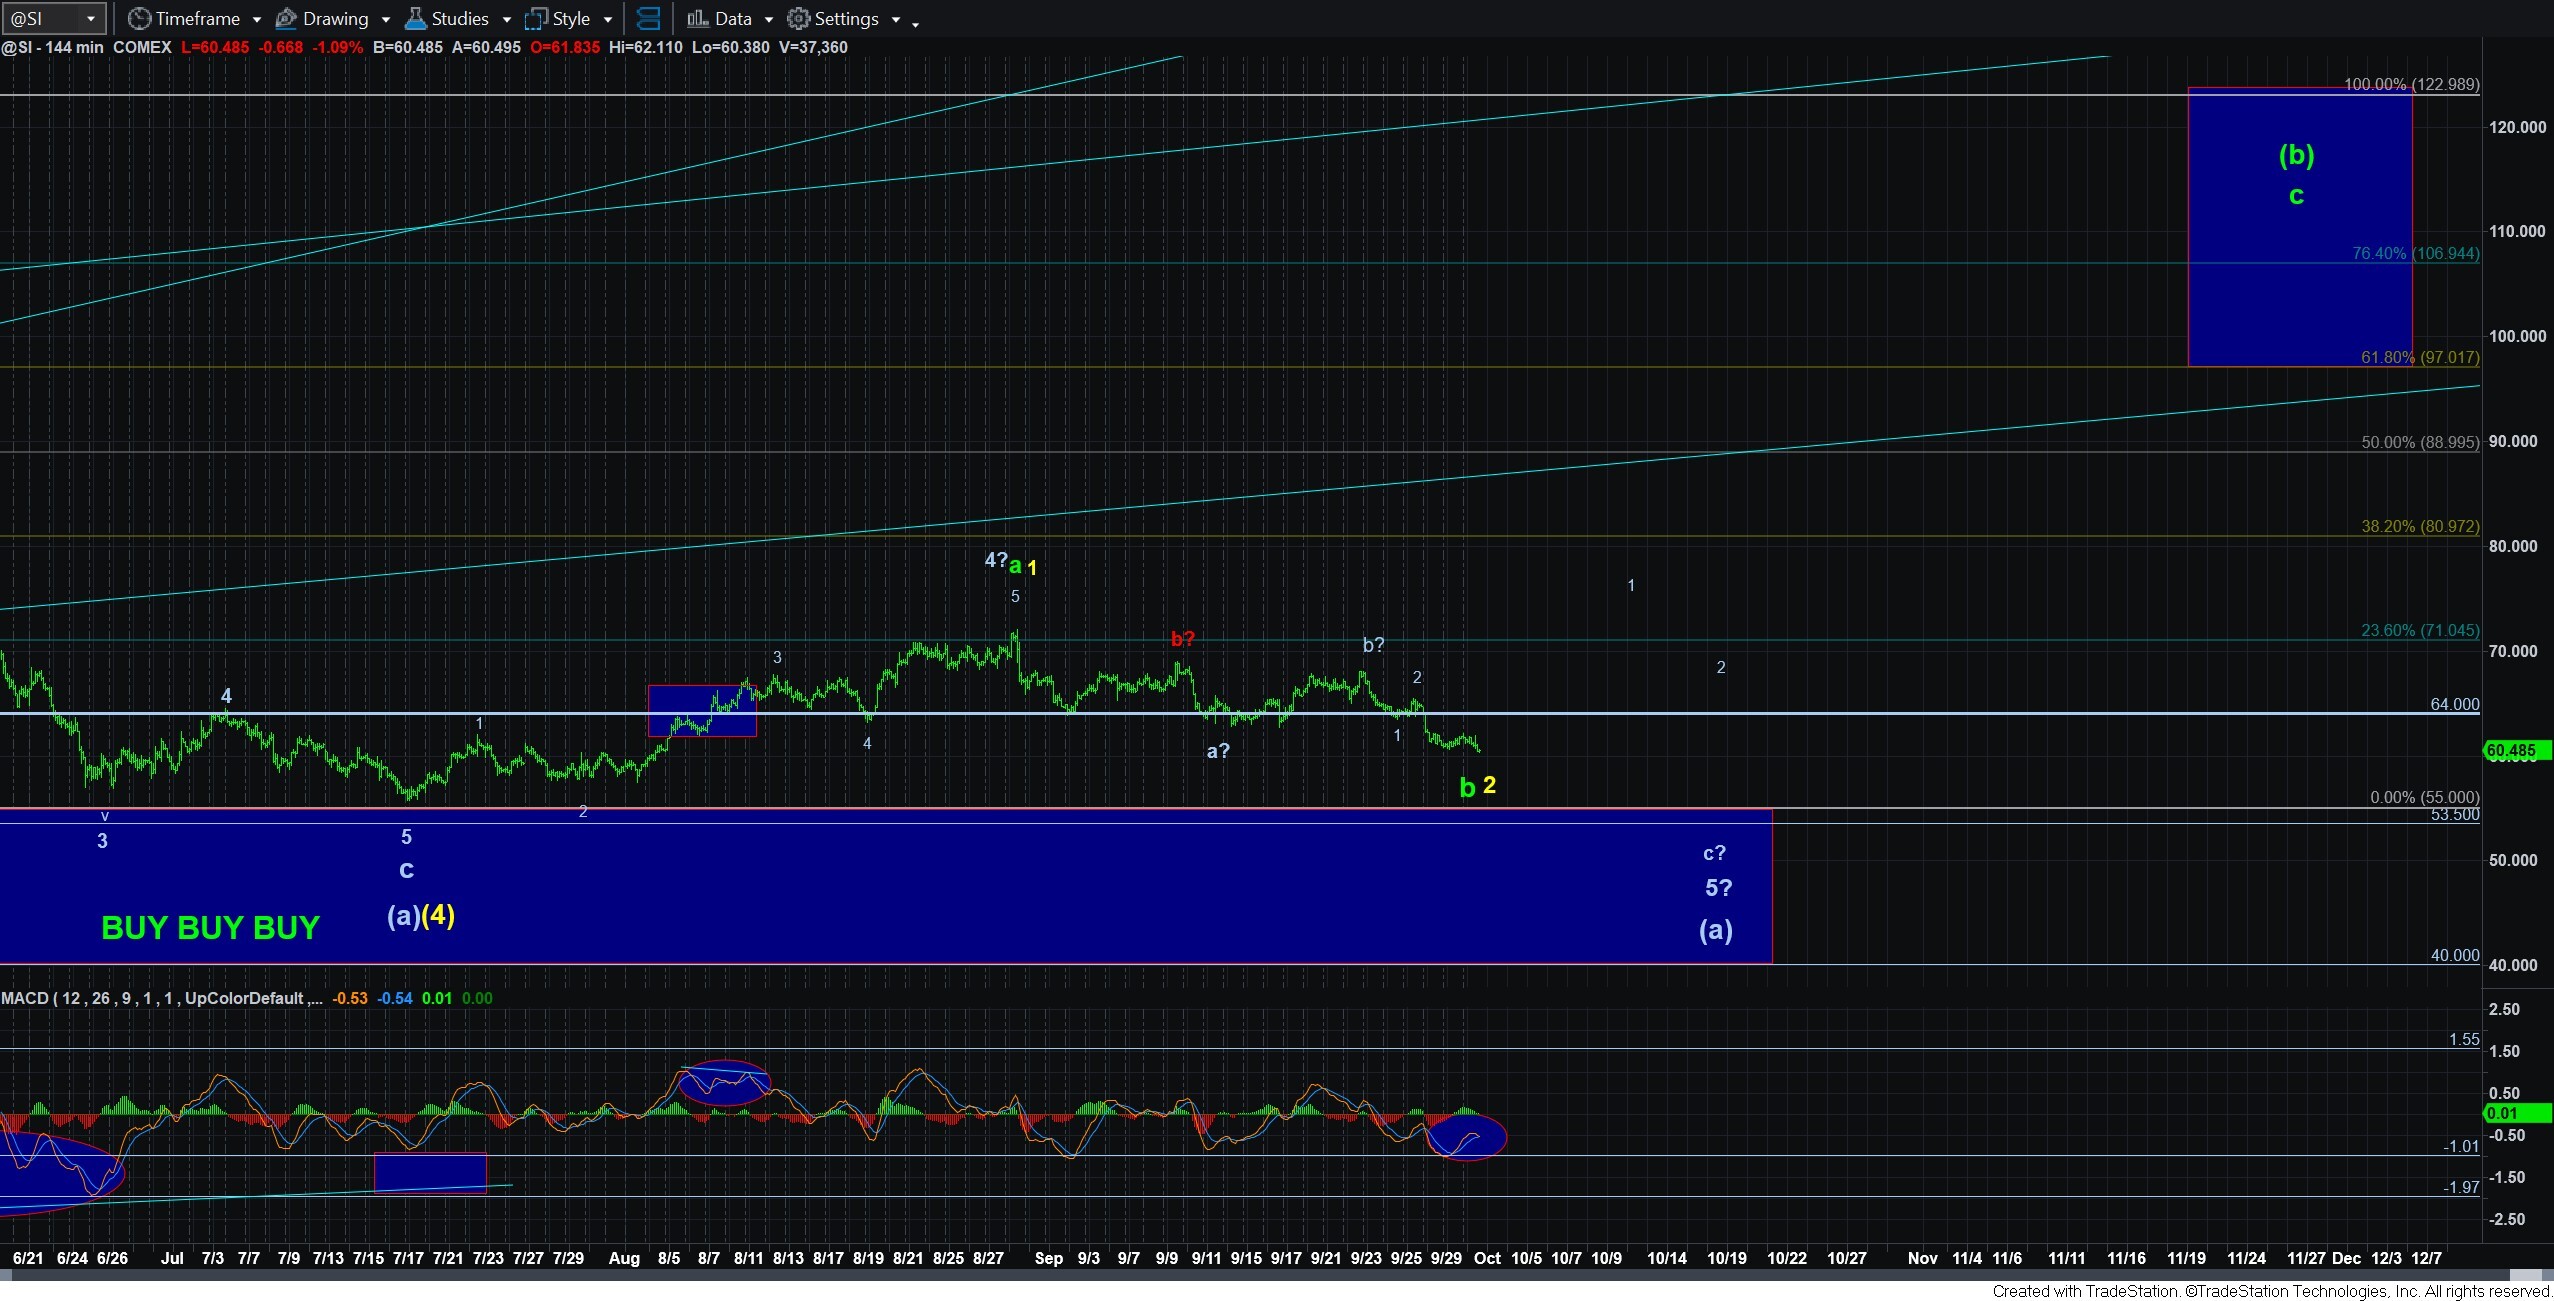
Silver is at a more interesting posture. With it hitting a lower low today in this current decline, there is some potential that this could be completing a very complex 2/b. And, the MACD on the 144-minute chart does lend some value to that perspective. However, any bottom being struck here would rely upon a complex structure and not a clearly identifiable a-b-c corrective structure, with a c-wave completing 5 waves down right now.
Therefore, we will need more evidence to make this a more reliable bottoming wave count. So, until silver is able to break out over the high struck today, I am going to view this chart as pressure being down as well. Ultimately, should we see a clear 5-wave rally over today’s high, that would potentially change my perspective on this. But, for now, it also has a path to lower lows, as presented by the grey and red counts on the 5-minute chart. And, as an aside, the grey count on the 5-minute silver chart basically matches the blue count on the GDX chart.
In summary, there is some potential for a bottom to being carved out as we speak in the complex. But, unfortunately, I do not have strong evidence to make that claim, as much of it is based upon corrective structures that are not standard or reliable. And, while there are a number of individual mining stocks that are approaching appropriate bottoming wave counts for their respective 2nd waves, clearly not all stocks are presenting in the same manner. Moreover, neither silver nor gold is giving us a strong indication that their respective lows are forming now, even though there is some potential.
This means you are going to have to be a bit nimble in the coming weeks. For those with longer investing horizons, it is not unwise to be adding positions as we pullback more. But, I do not think I would be going all-in just yet. Remember, if the market does bottom here and begin a wave 1 through resistance, you can always buy a wave 2 pullback thereafter before it begins a strong climb in the heart of a 3rd wave. But, for now, there is just not enough reliable information and evidence supporting that a strong bottom is being struck right here and now. We need AT LEAST a rally over today’s high to add to such evidence. My apologies for not being able to provide something a bit more definitive, other than my expectation for a major rally beginning once this decline has completed.