Pressure Remains Down In Metals
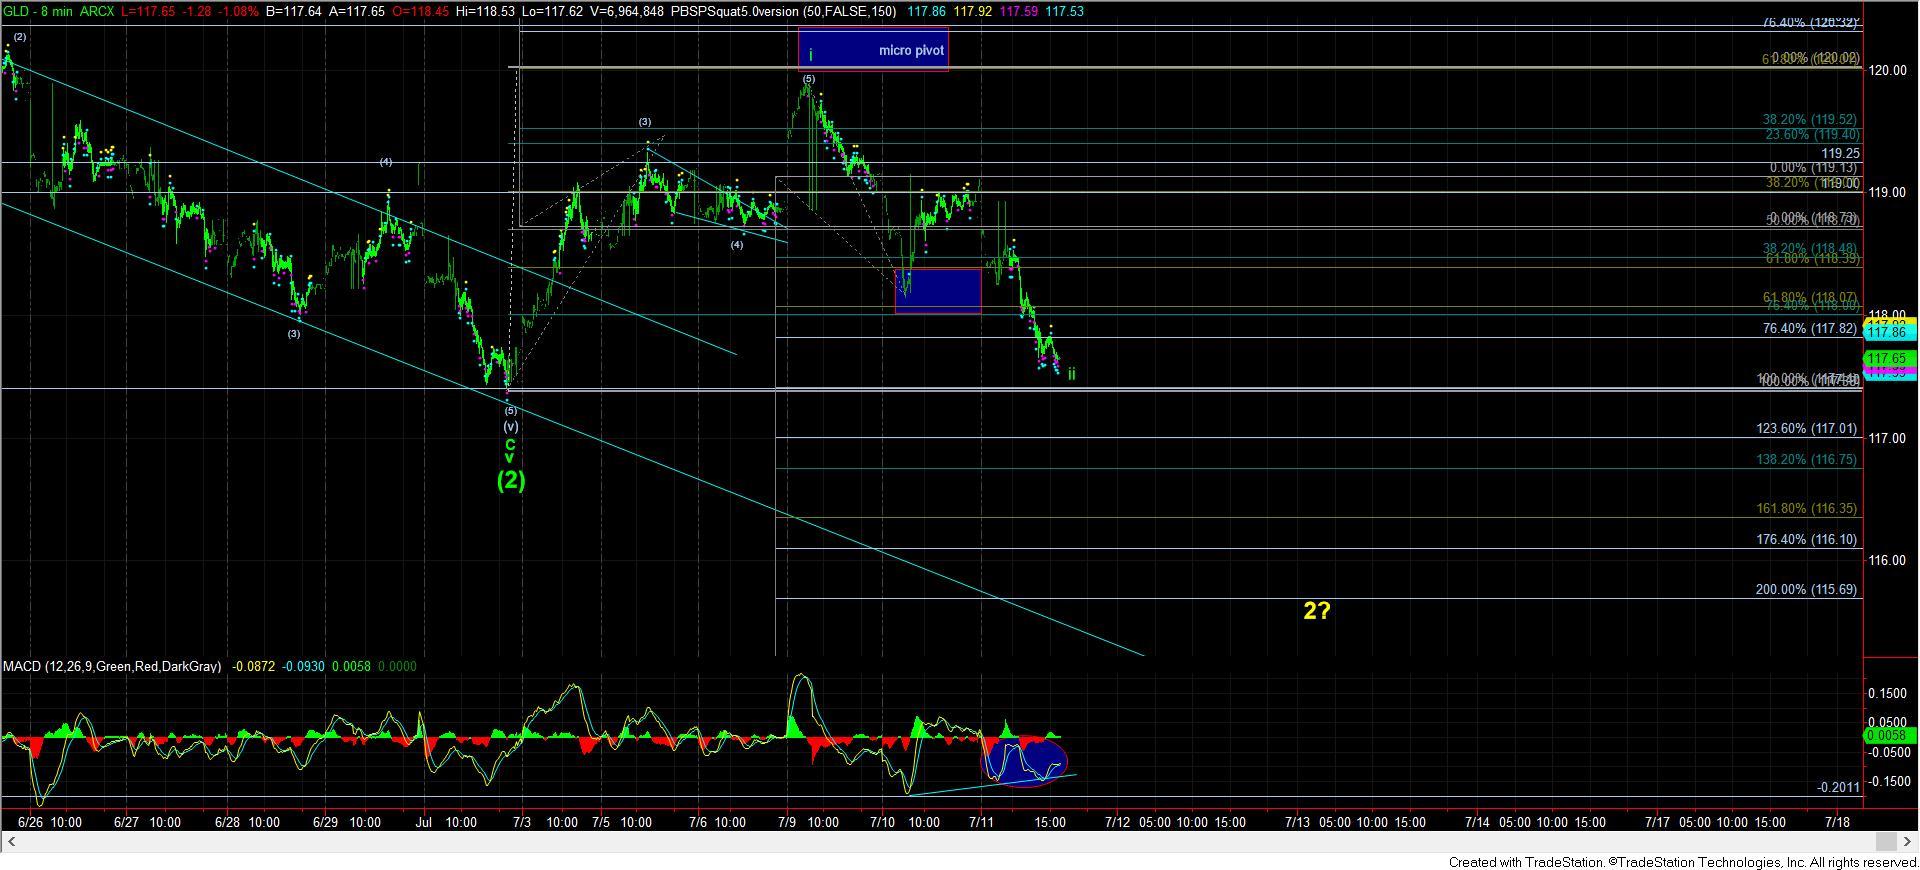
As I noted today during the live video, the bottom at 117.40 in GLD somewhat surprised me as I cannot remember the last time I saw a successful double bottom 2nd wave where it retraces all of wave 1. Most often, a break below the .764 retracement is detrimental to the immediate impulsive structure. And, it seems like we may not have an exception at this time.
While the 8-minute chart of the GLD is still retaining positive divergences on this drop towards 117.40 again, the pattern off this past week’s high has an a=c right into that support yet again. While I had a hard time believing the 117.40 level held the first time, I am seeing it as much less likely it will hold again. But, the positive divergences I am seeing on the charts certainly have to make me open to the potential. For now, the 118-118.25 is the micro resistance that we need to exceed in impulsive fashion to begin to convince me of that potential.
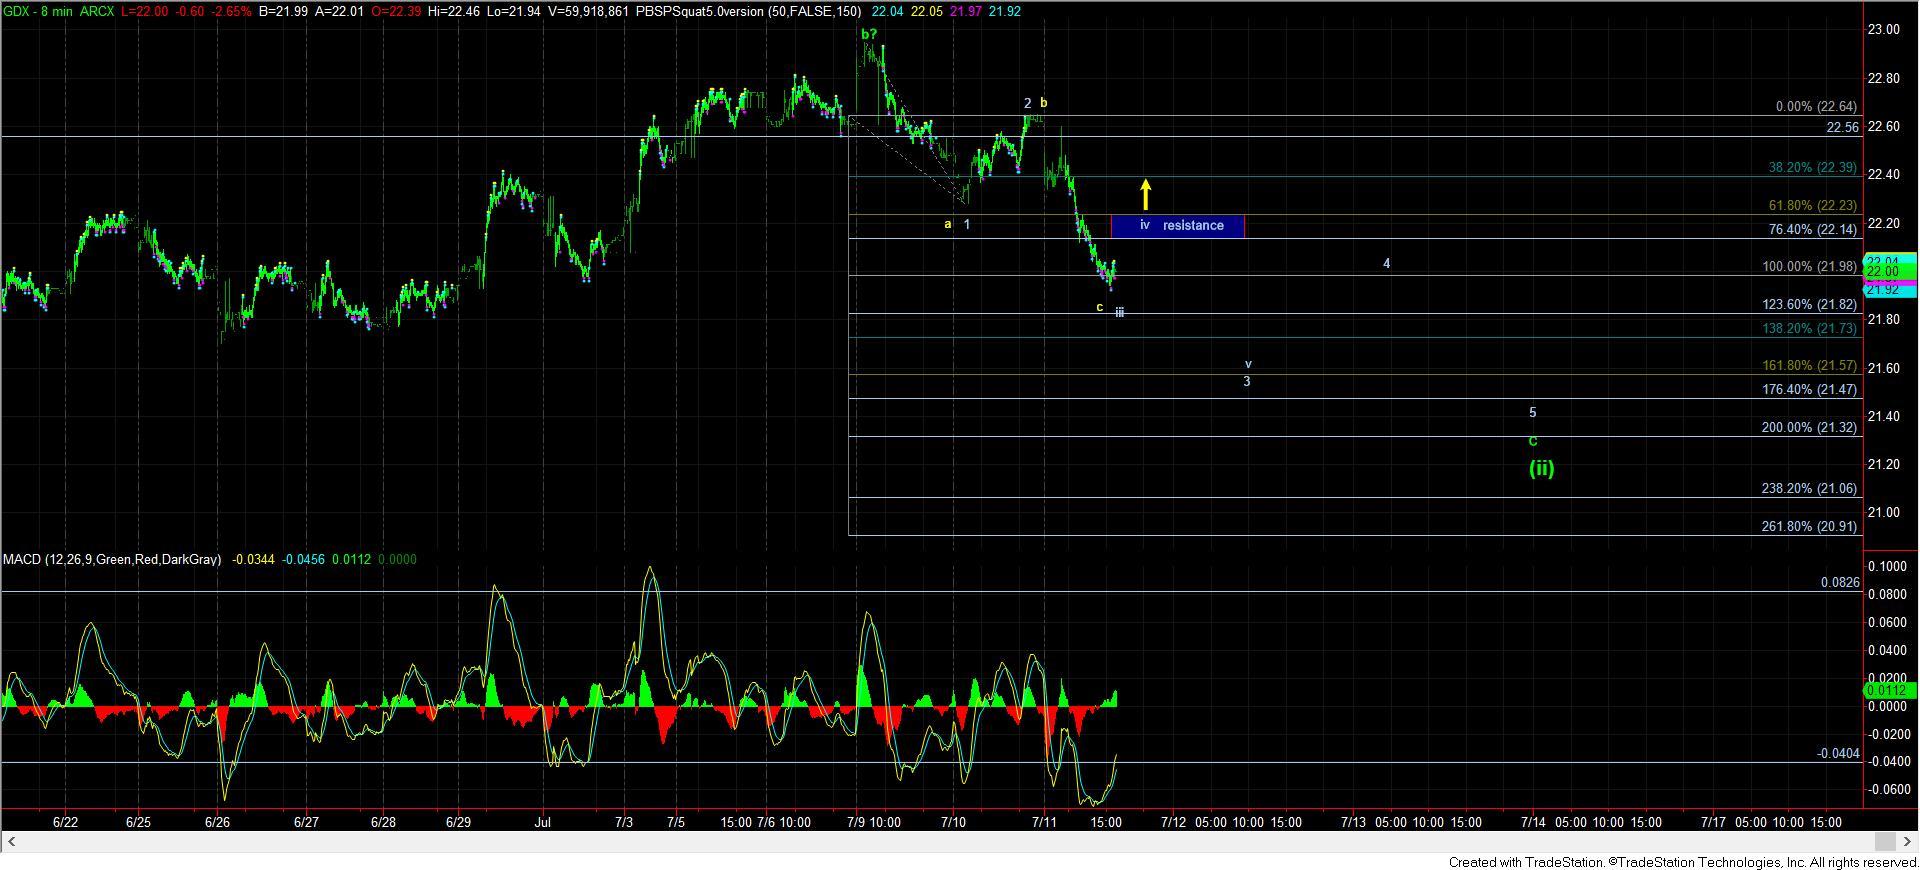
In this update, I am going to do a bit more with GDX, as I have also included a micro chart on it, since the action has given us clearer parameters. At this time, we are at a clear inflection point. As you can see from the 8-minute chart, if all this will be is an a-b-c pullback, then we have completed that today at today’s low. But, we will need to exceed the micro resistance at 22.25 in impulsive fashion to even begin to consider a bottom being in place.
Rather, it would seem that the current decline is a c-wave of wave (ii), assuming we remain below that resistance, and complete the micro structure outlined on the 8-minute chart. The standard targets for this decline would be the 21-21.35 region.
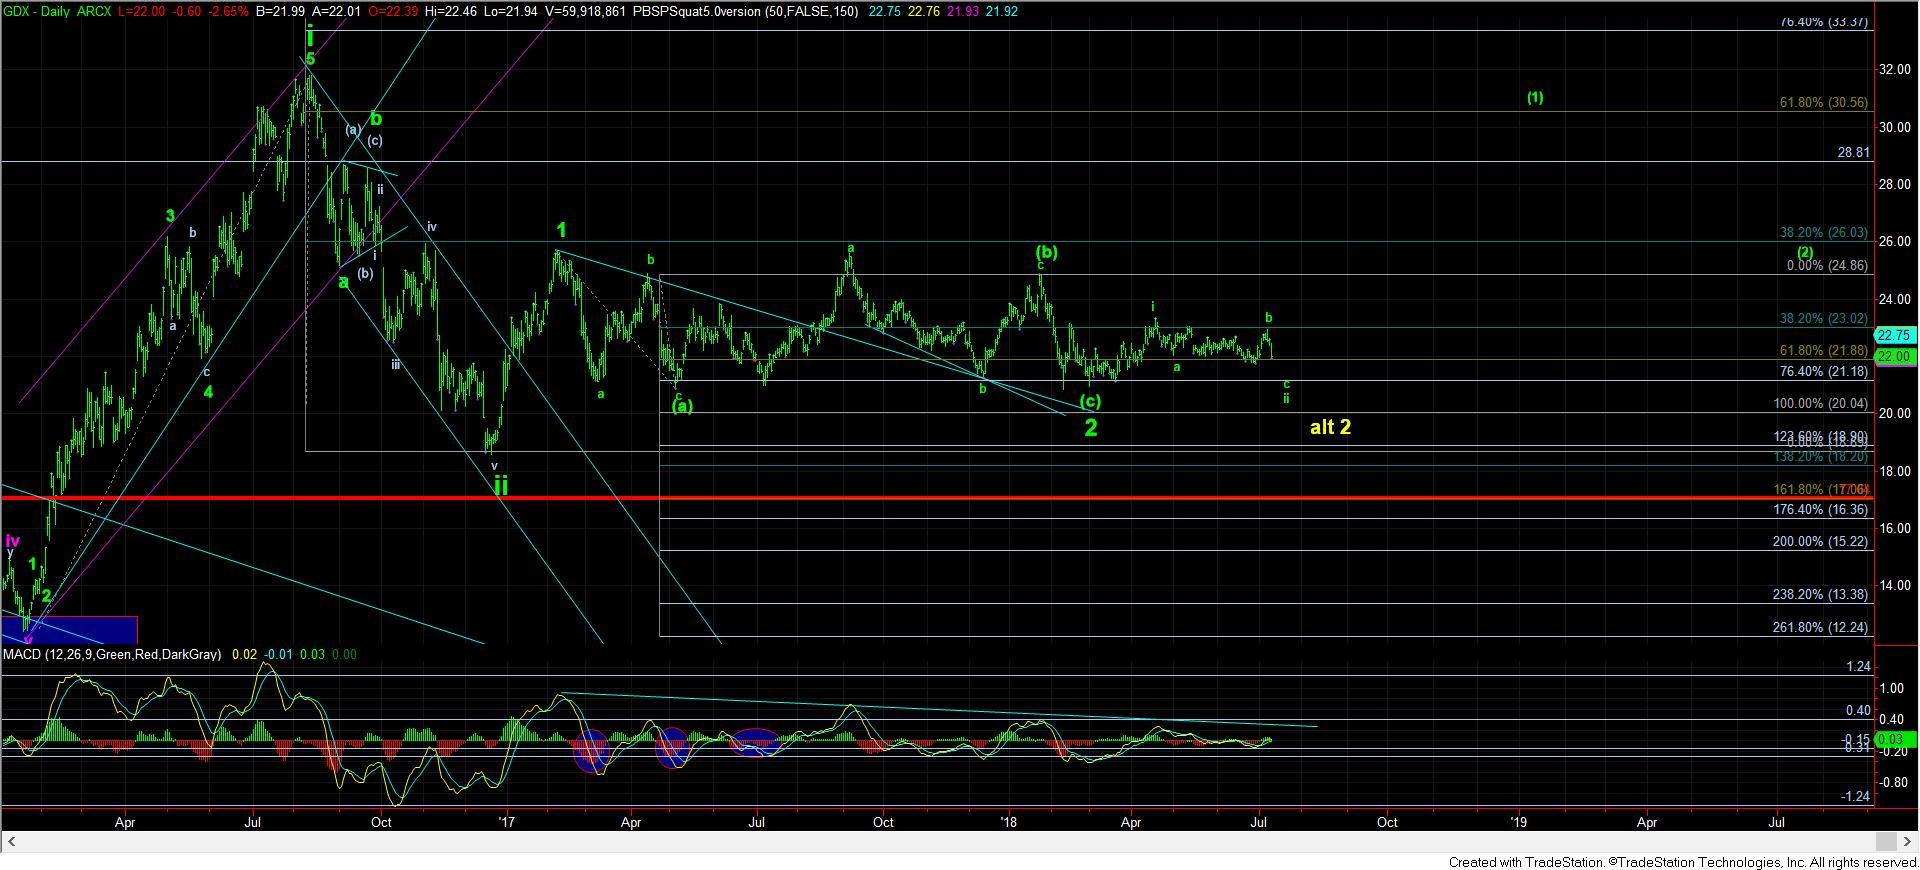
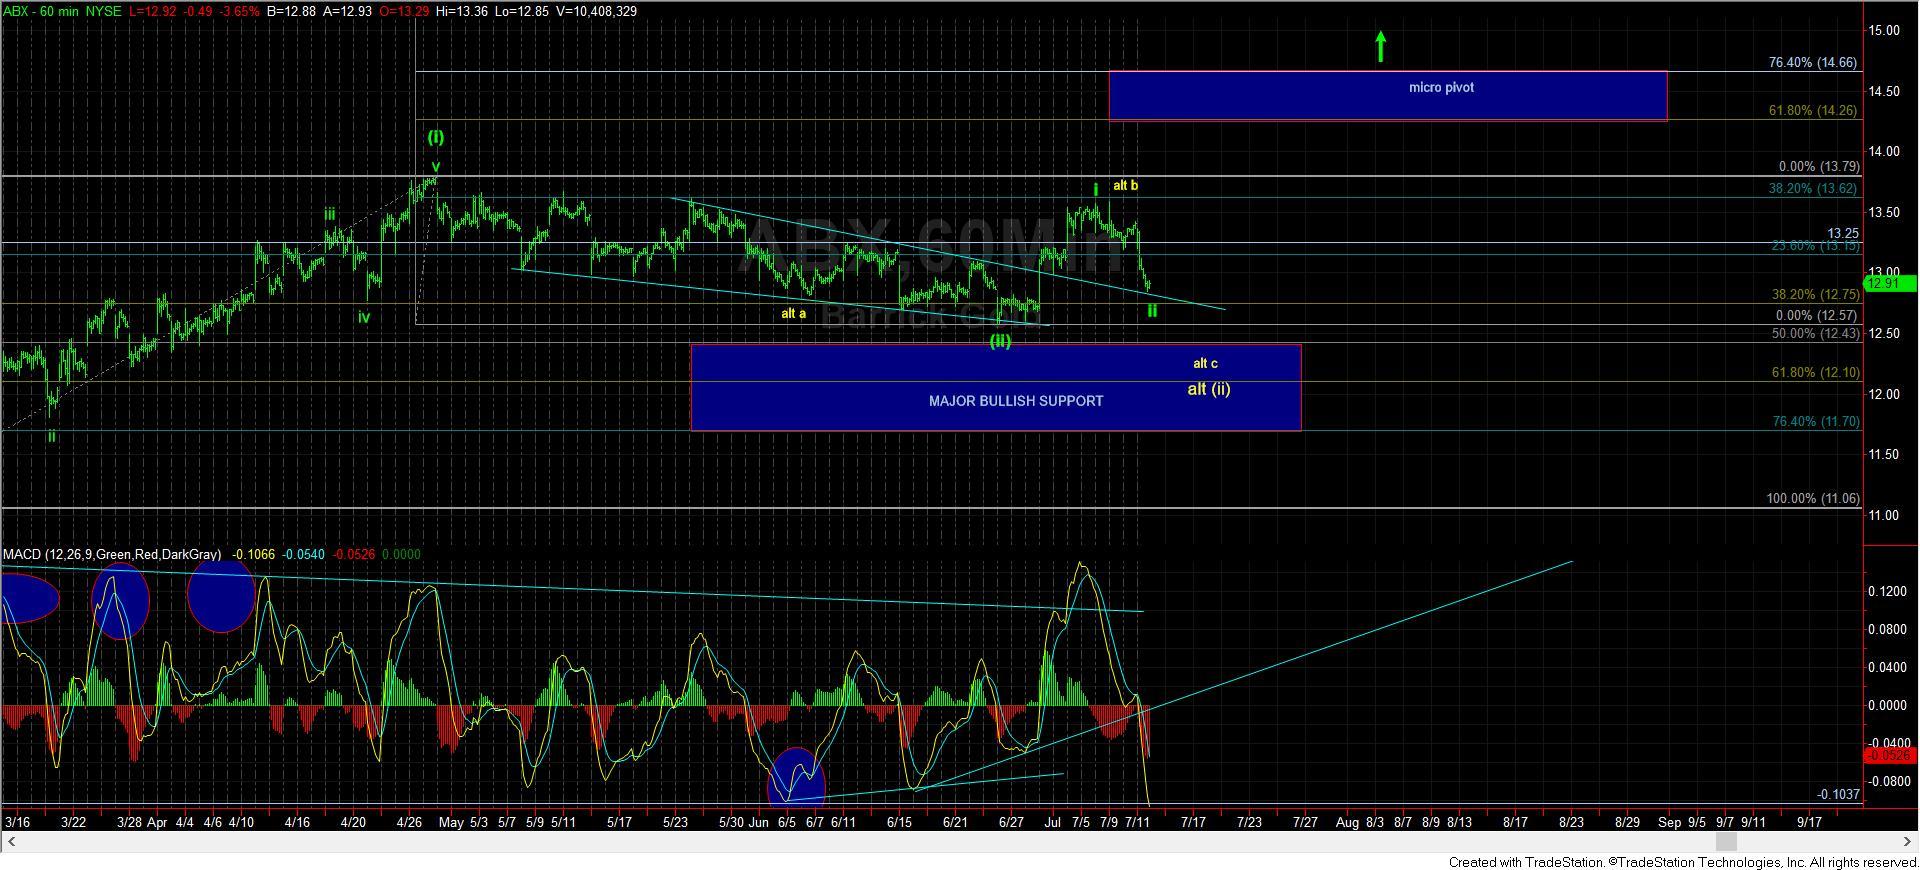
This would also fit well with a bigger wave (ii) in ABX, which would present in the same way as the (ii) in GDX. It would likely target the 12.40 region (.500 retracement) if we see a full pattern play out, with the potential to drop as deep as 12.10 (.618 retracement).
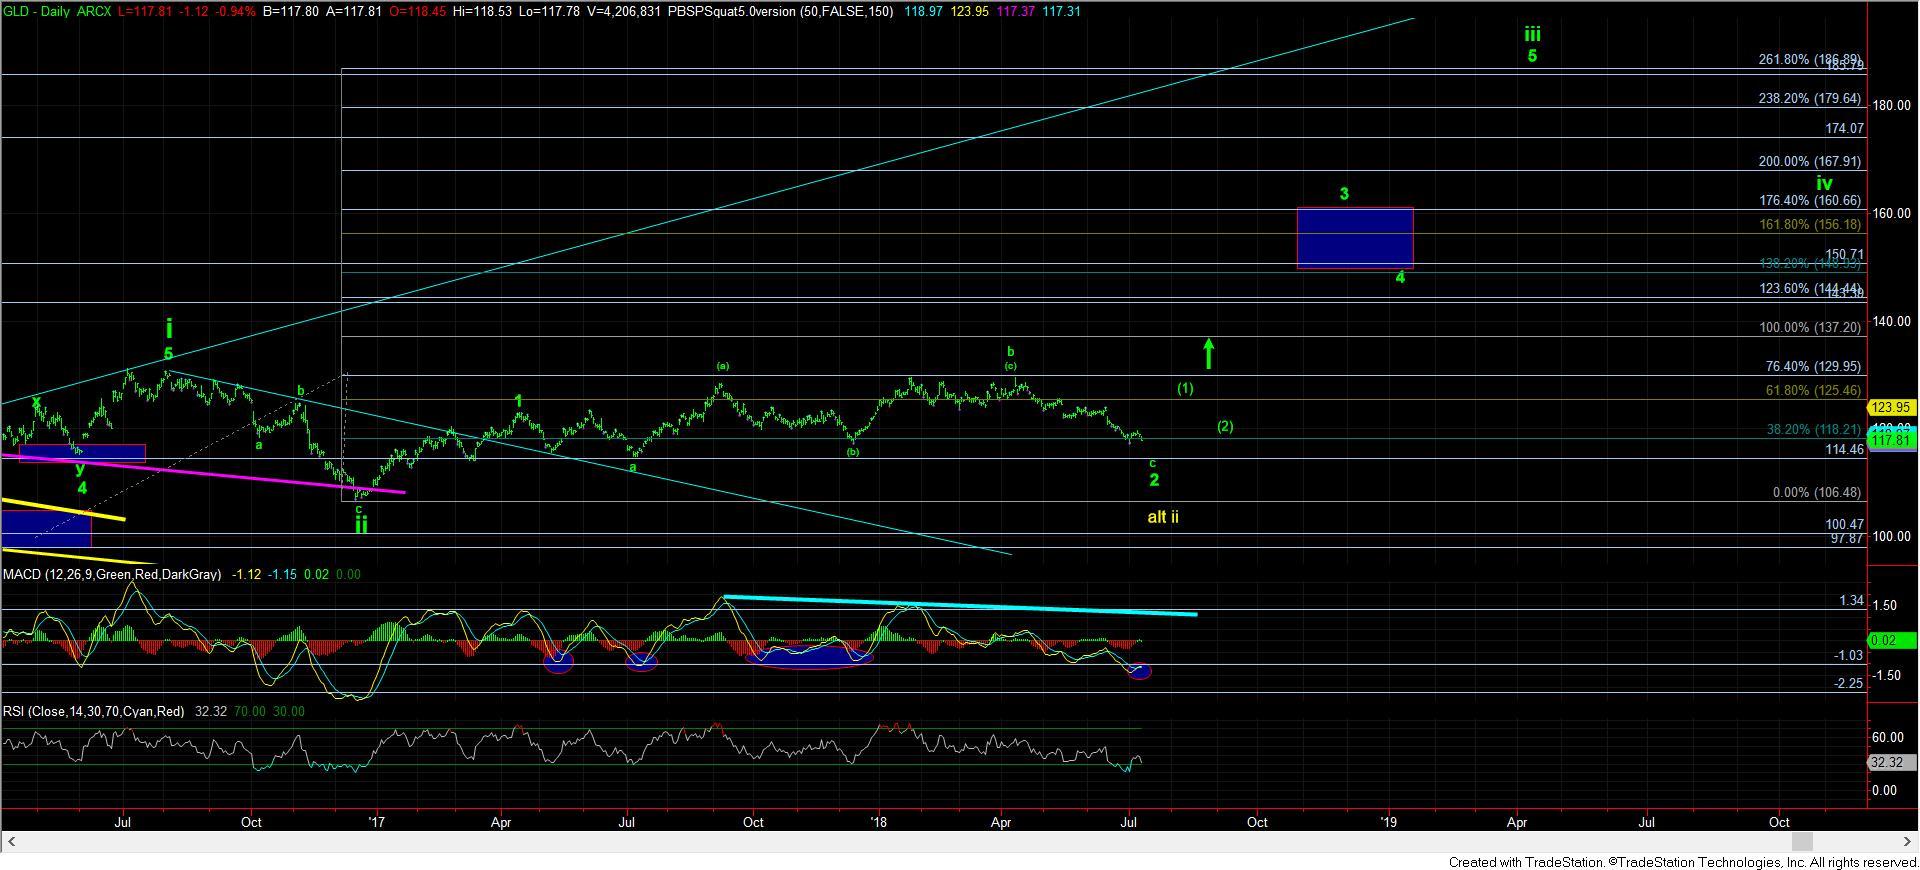
Should GLD follow through to the downside in similar manner, it would seem to be pointing down to the 115-116 region before it completed its c-wave down. But, the main reason I question that potential is because the drop off the highs in GLD really count best as a 3 wave structure rather than an impulsive structure.
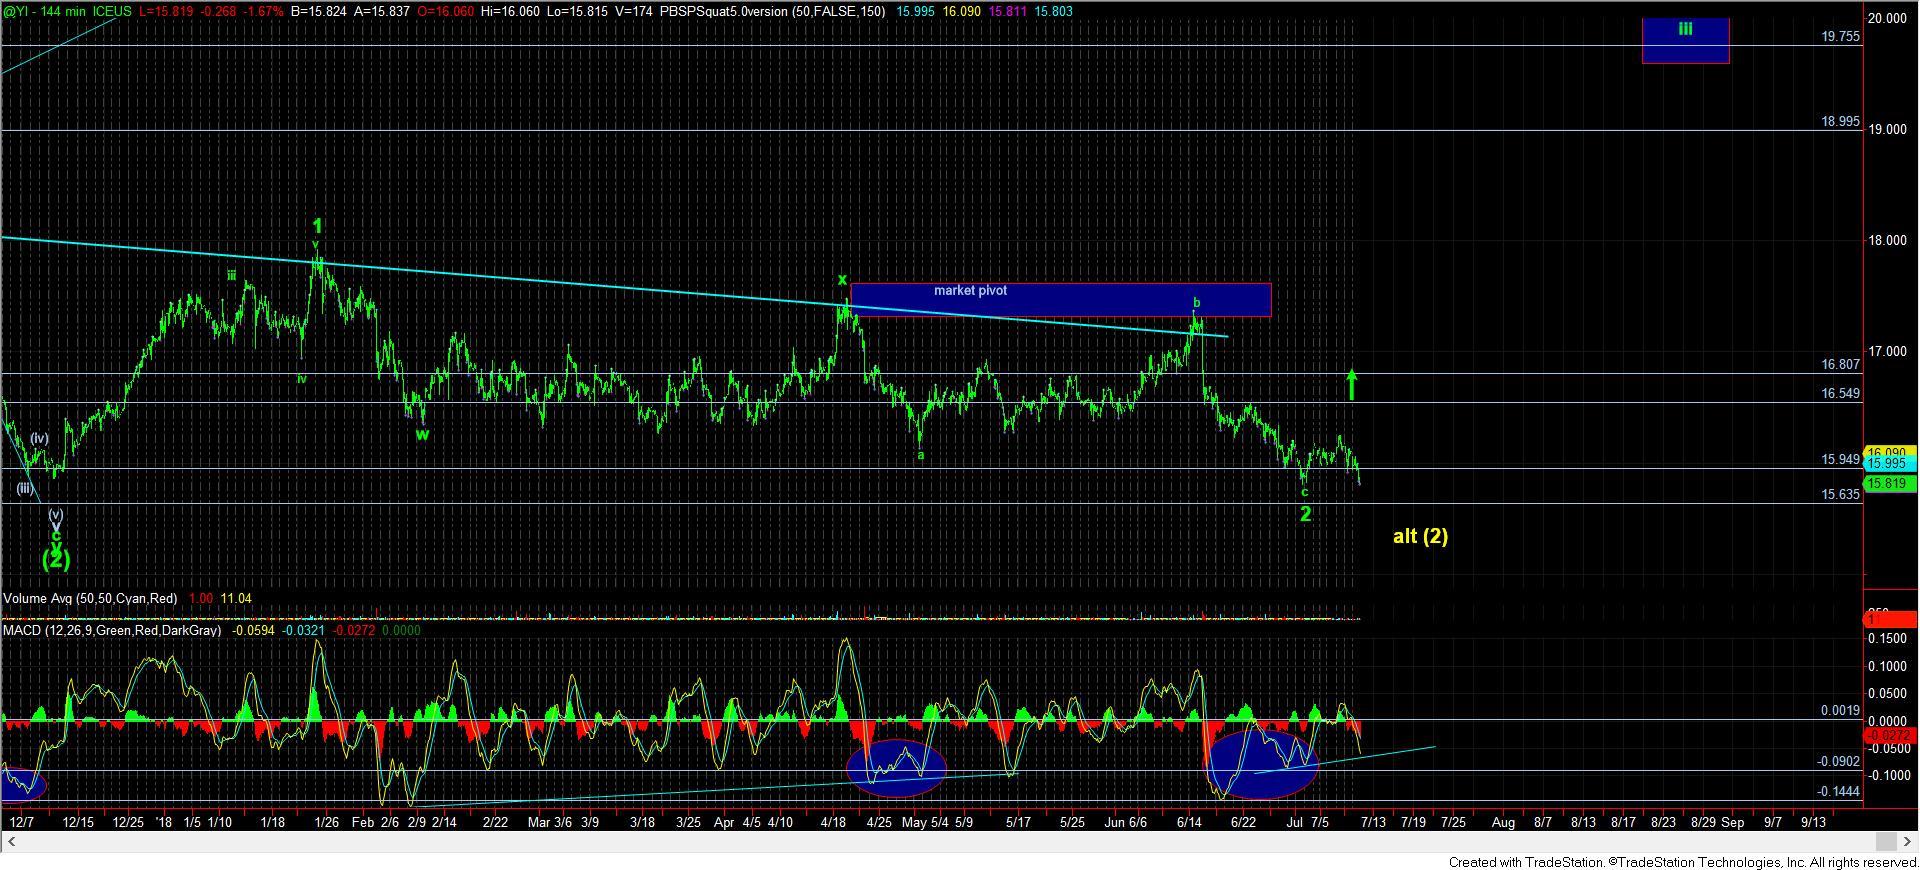
As far as silver is concerned, I really do not want to see a break down below 15.63, or I will have to revisit whether wave (2) has completed. So, for now, I am reserving judgement on silver.
But, overall, it would seem we are at another inflection point for the metals. Pressure seems to be pointing down, and resistances have been noted herein. Until the charts can take out their relative resistance points, it would seem a set up is in place to take us deeper into this retracement in the coming days. The bulls have a lot to prove right here and now to even convince me that we can revert back to an immediate uptrend.
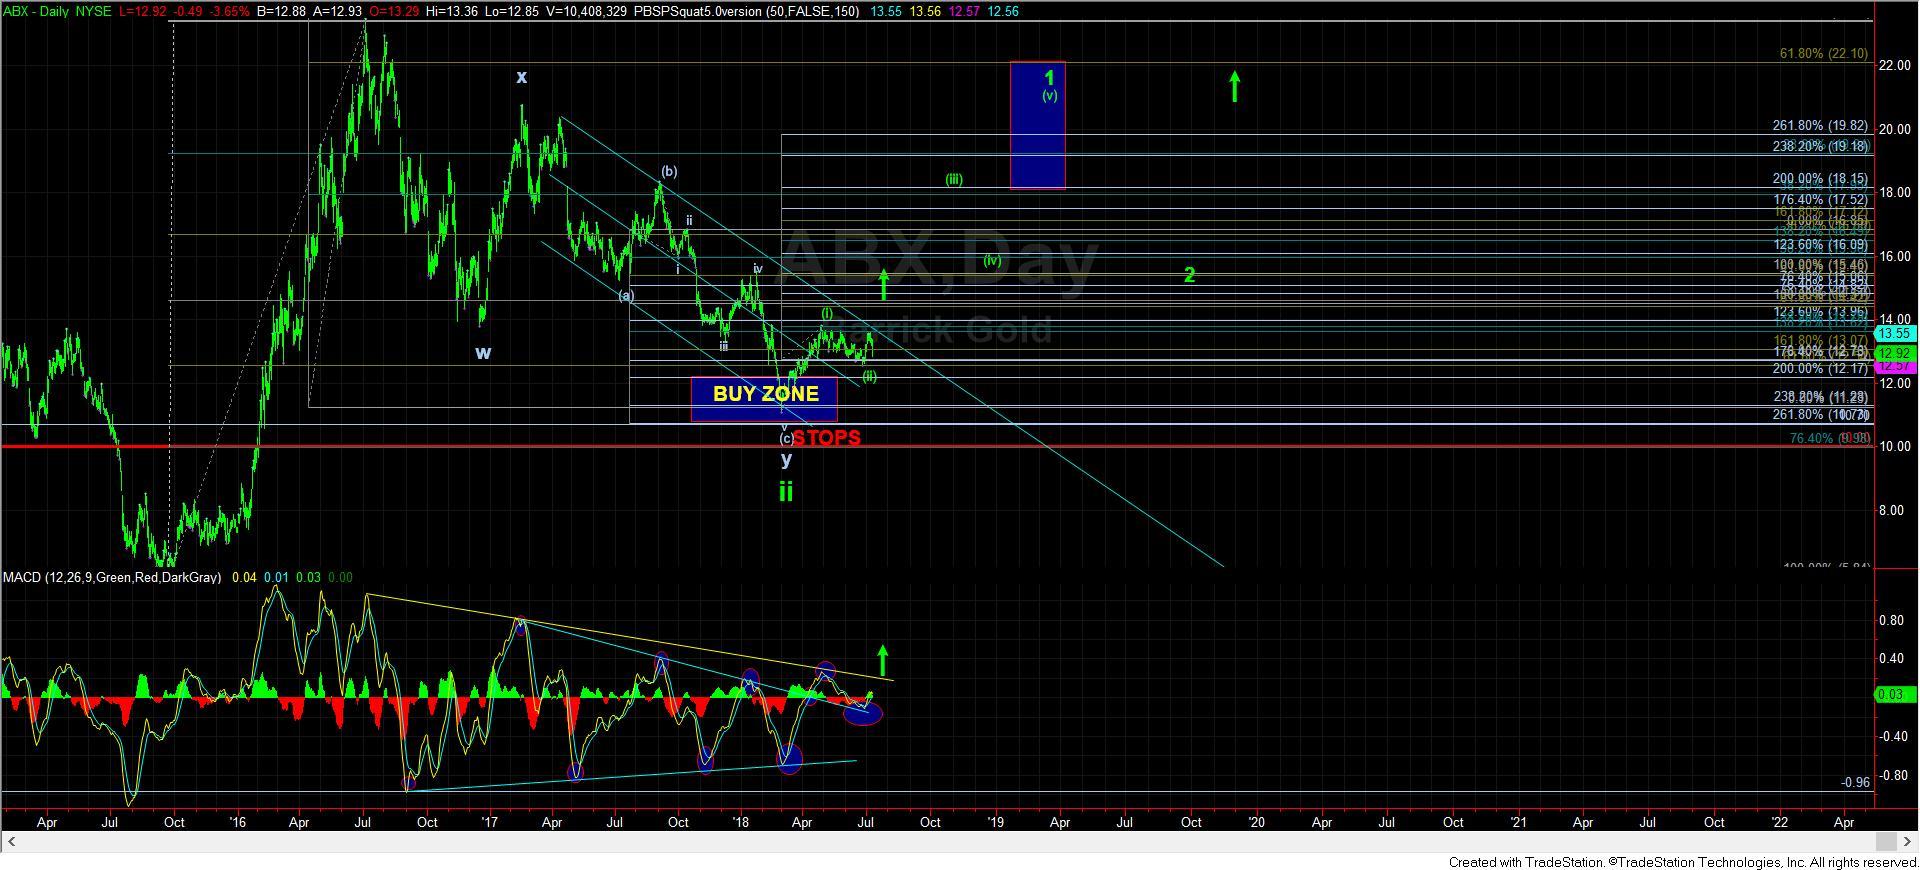
The one last thing I want to point out is how well the daily ABX chart has been behaving. The market bottomed right where we expected it to complete wave ii months ago. Since that time, we have what I have counted as 5 waves up, which broke through the initial downtrend line in the MACD. As I said at the time in my live video, should the ABX prove to be really bullish on the next pullback, it would drop back to retest that MACD break out point from above, and hold over that level. This would set us up to rally through the secondary MACD downtrend line, which would likely see it soar in wave (iii) off the recent lows. And, thus far, it is playing out in almost textbook fashion. So, even we were to see a bit deeper of a wave (ii) in the coming days, I think the technical indicators on this chart would still hold well for the potential (i)(ii) structure we are now tracking.