Pre-Thanksgiving Sale - Market Analysis for Nov 18th, 2026
 By
Avi Gilburt
I have written about this phenomena many times in the past. And, it is something that really intrigues me from a human sentiment perspective.
When we go out shopping for a television or a car, we put a lot of effort into finding the best price possible. And, it is clear that we all want the cheapest price we can find. Yet, in financial markets, the demand gets strongest as the price goes higher, whereas demand drops as price gets lower. Pretty funny how that works.
While there are many individual mining stocks that still had their best pricing back in June when we were buying, many of them are still well of their respective lows of that time. But, there are still a host of other mining stocks that are now coming into the completion patterns for larger corrective moves. And, those are the ones you may want to consider if you did not buy with us back in June. But, I still think that the ones that have already bottomed may lead us north in the next rally.
But, in this update, I want to look at a couple of bigger picture charts in addition to the smaller degrees.
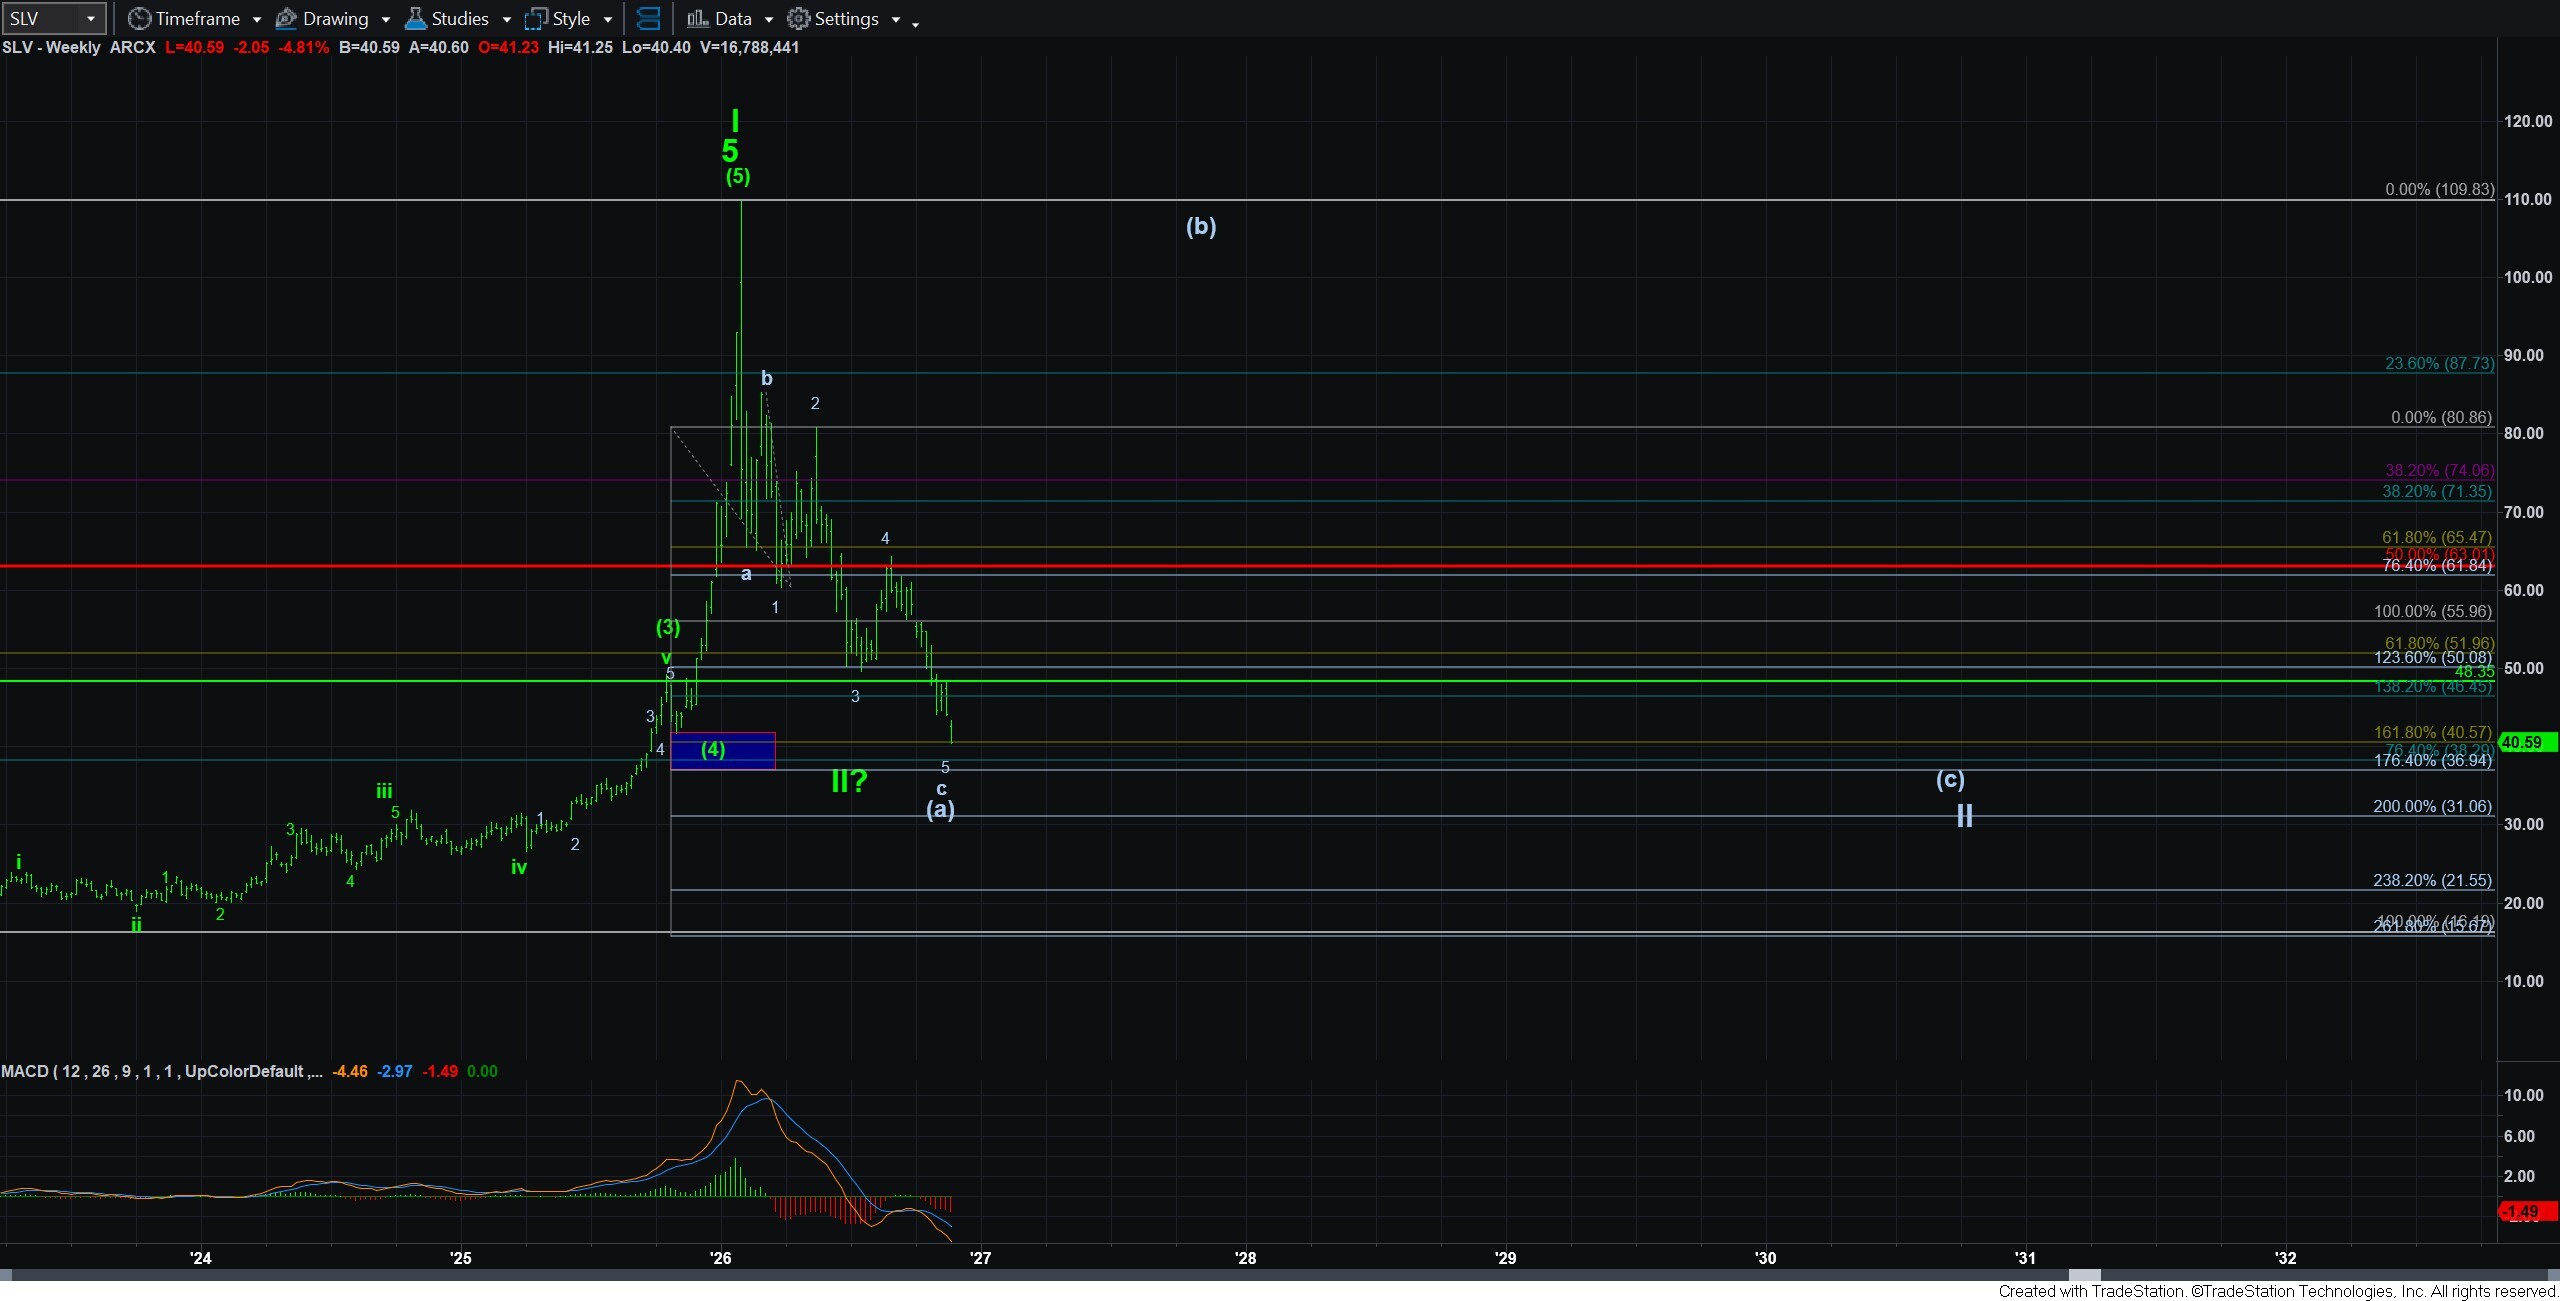
The nicest chart I can present in the bigger picture is probably the SLV WEEKLY chart. First, take note that the MACD is now the lowest in its history since this fund came out in 2006. In fact, there is nothing even close.
Second, it seems to be completing a really nice ending diagonal, as shown, wherein the 3rd wave struck the standard 1.236 extension as it should in an ending diagonal, and the 5th wave now striking the typical target as well in the 1.618-1.764 extensions of waves 1-2. And, yes, as I highlighted in today’s live video, there are several reasonable ways to count this decline in the metals complex, but SLV is showing us one of the neatest and cleanest of those potentials.
Due to the depth of this correction, and assuming the bigger (a)(b)(c) expectation that I have proffered is correct, this chart does argue for a big rally which can take us back towards the prior highs seen in January of this year.
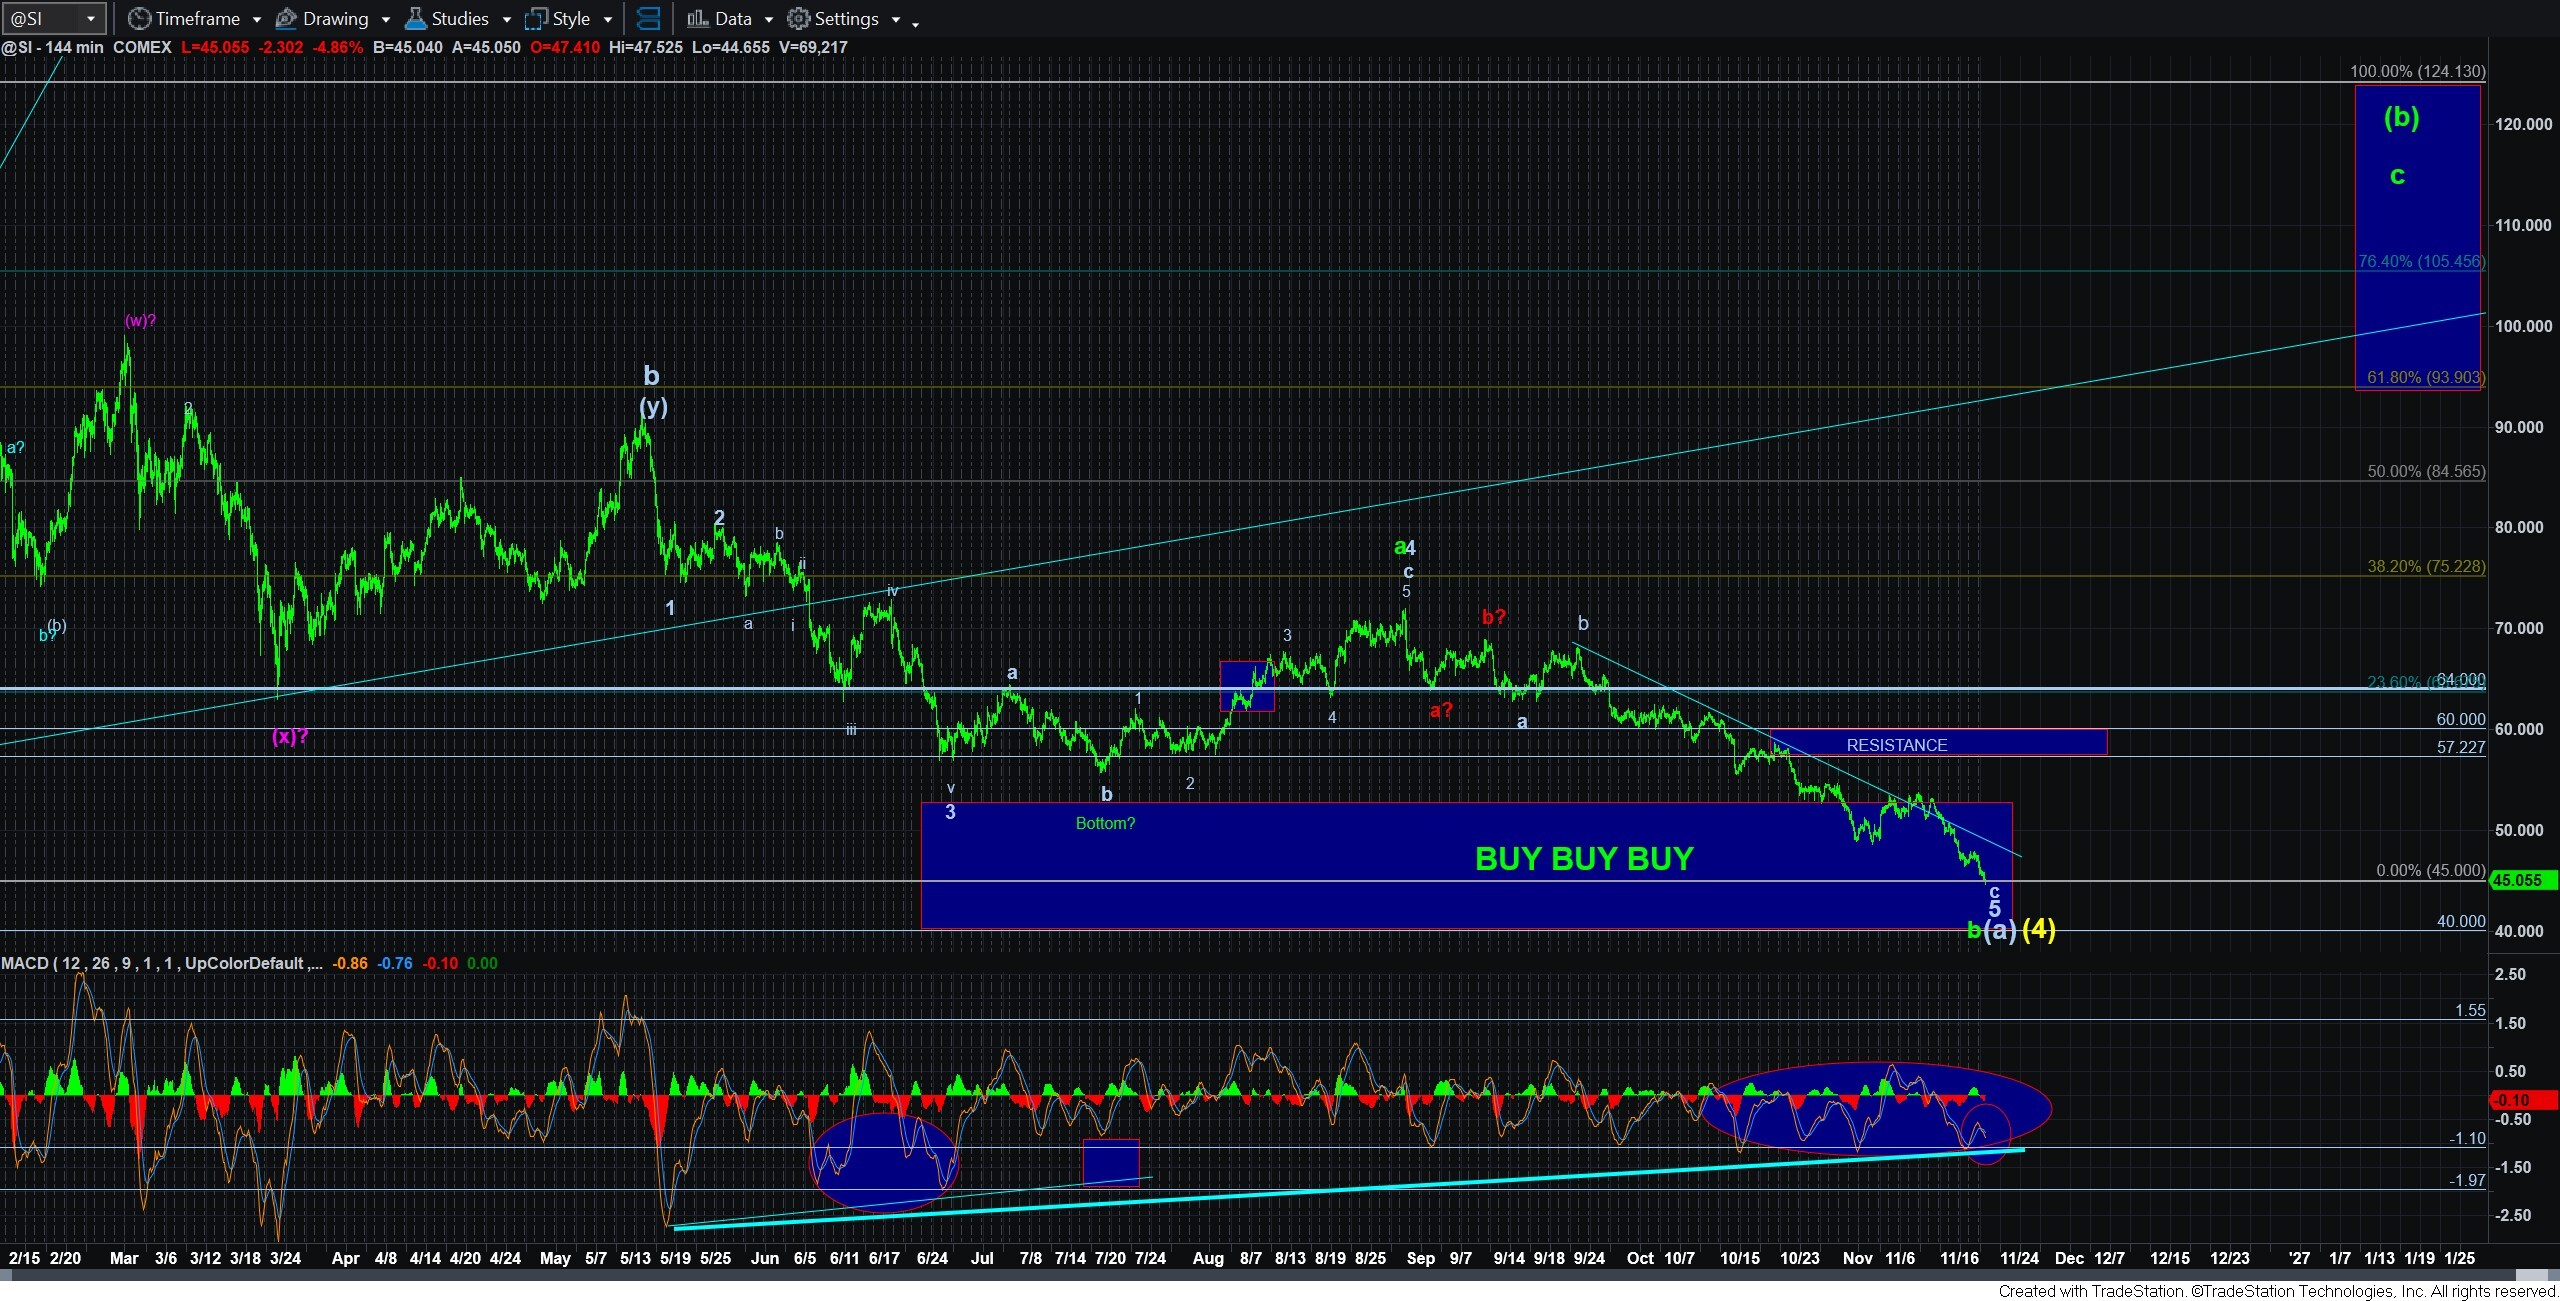
Moreover, when we consider the extreme positive divergence being seen on the 144-minute chart, I have to assume that this is akin to the beach-ball analogy that we have discussed in the past.
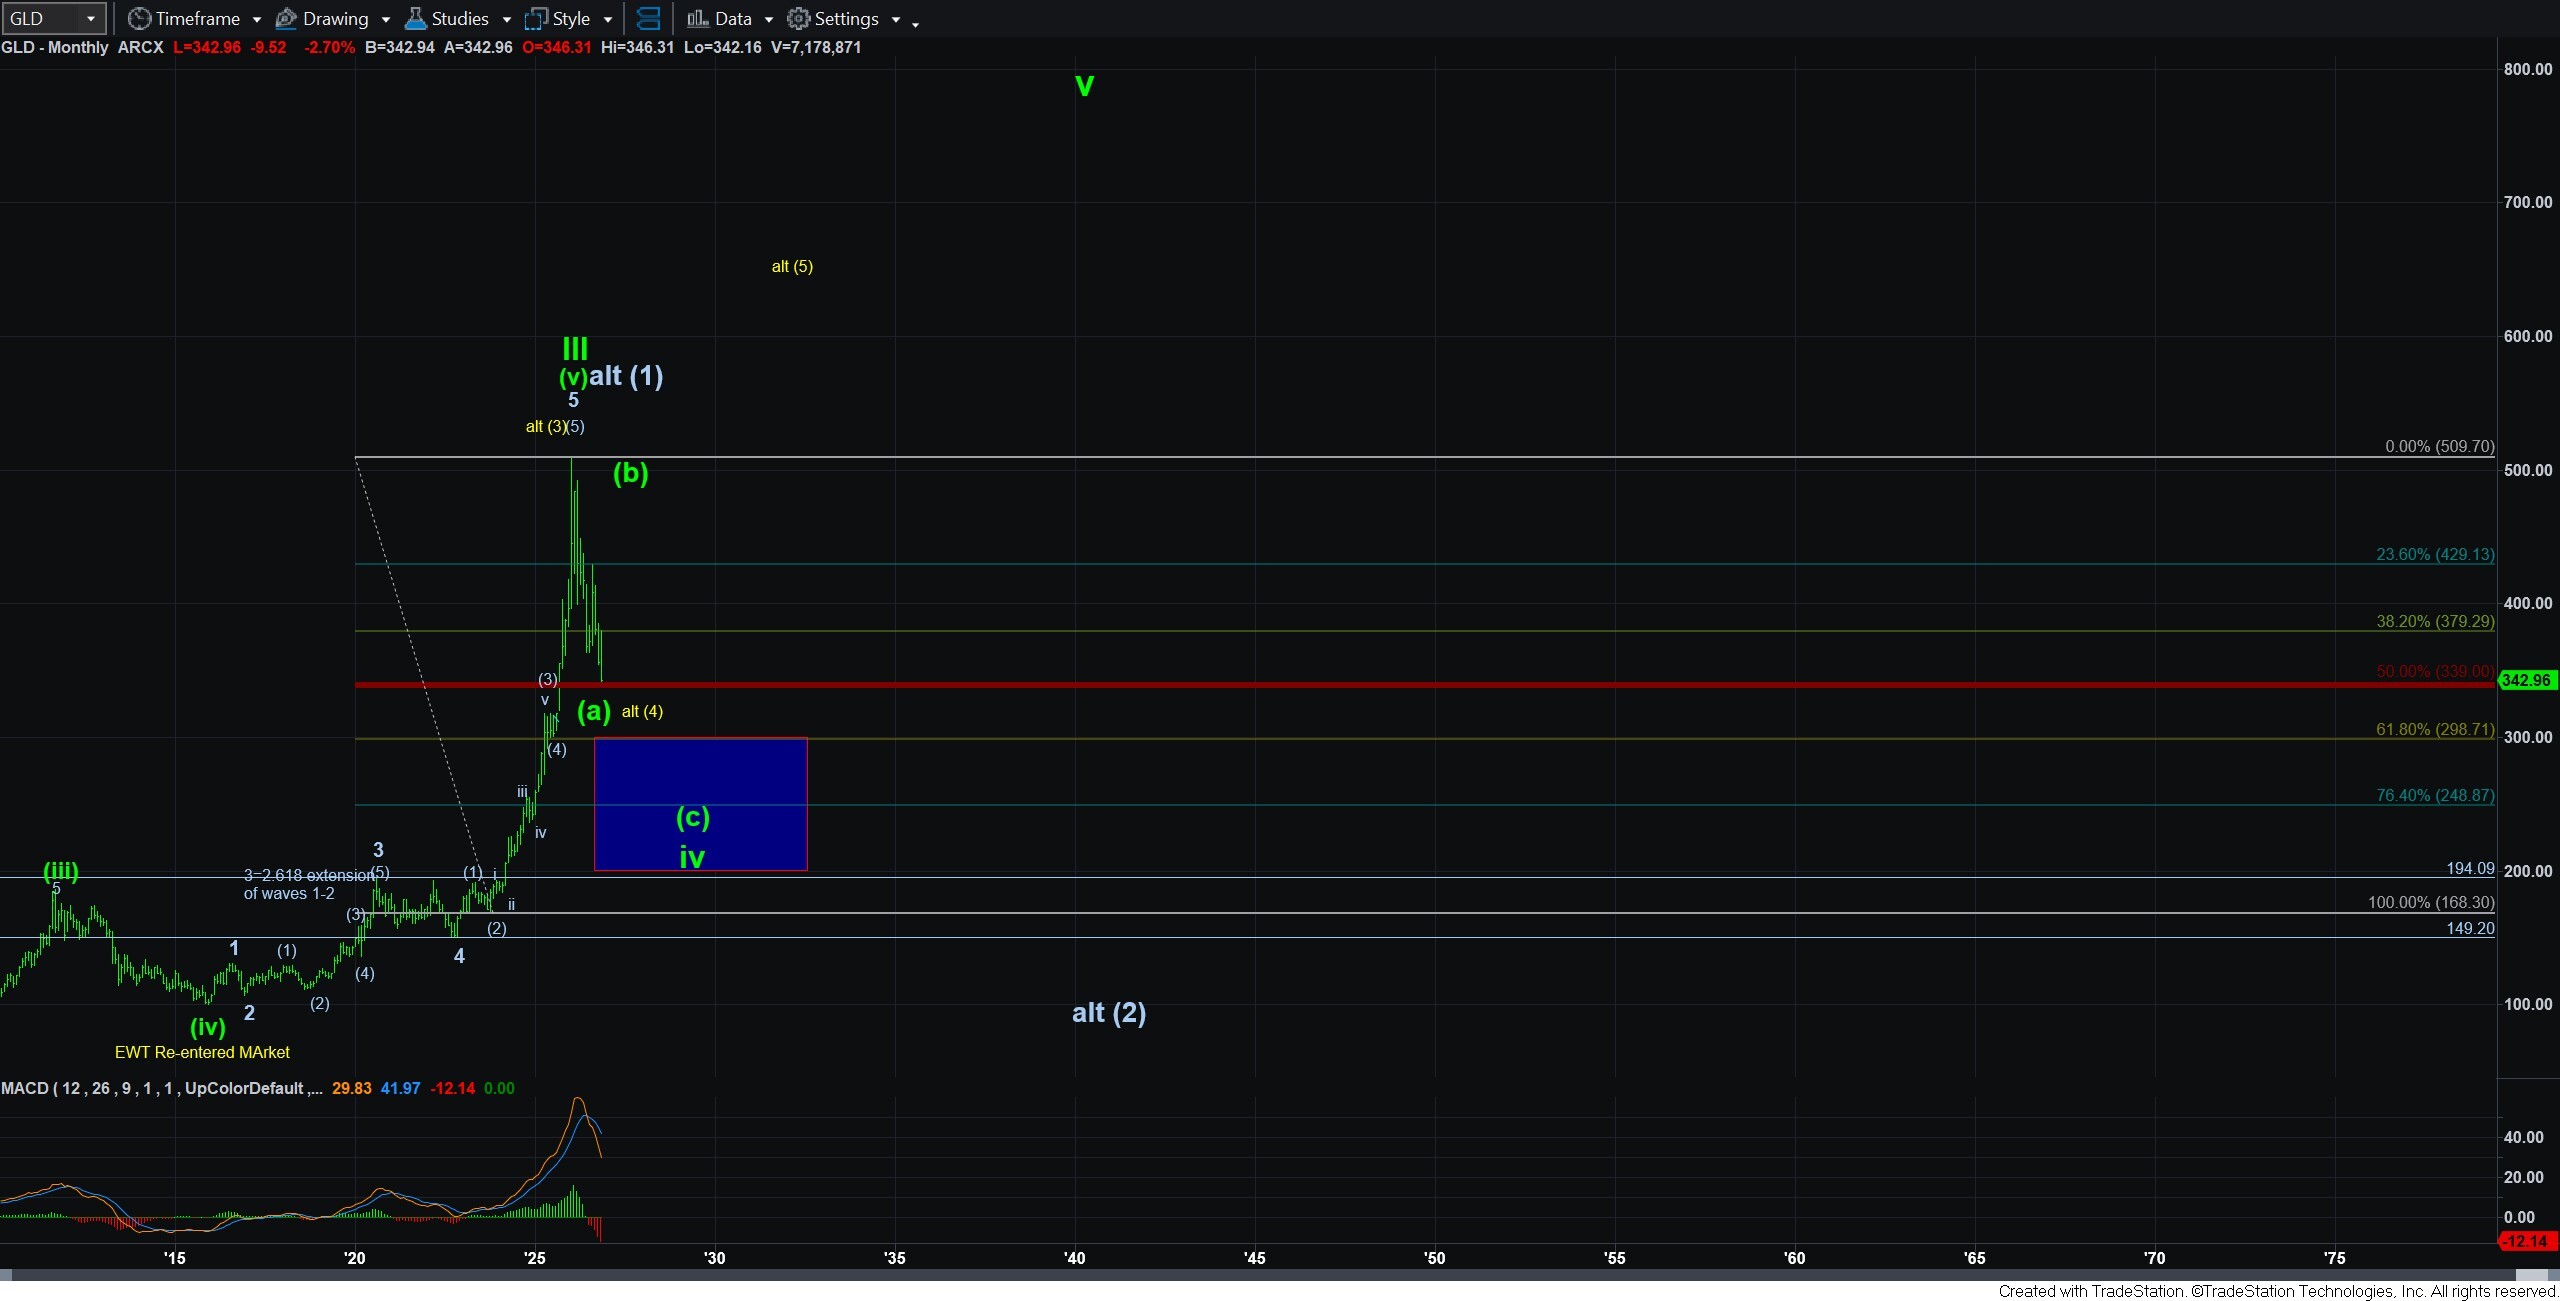
Now, I am also posting the bigger picture on the GLD as well, but I that structure is much more sloppy and is not as clear as the SLV. But, what the GLD monthly chart does suggest is that this is likely only the first leg down in a bigger corrective structure based upon how much the MACD can still reset. This also supports my theory of this only being an (a) wave in a much bigger correction.
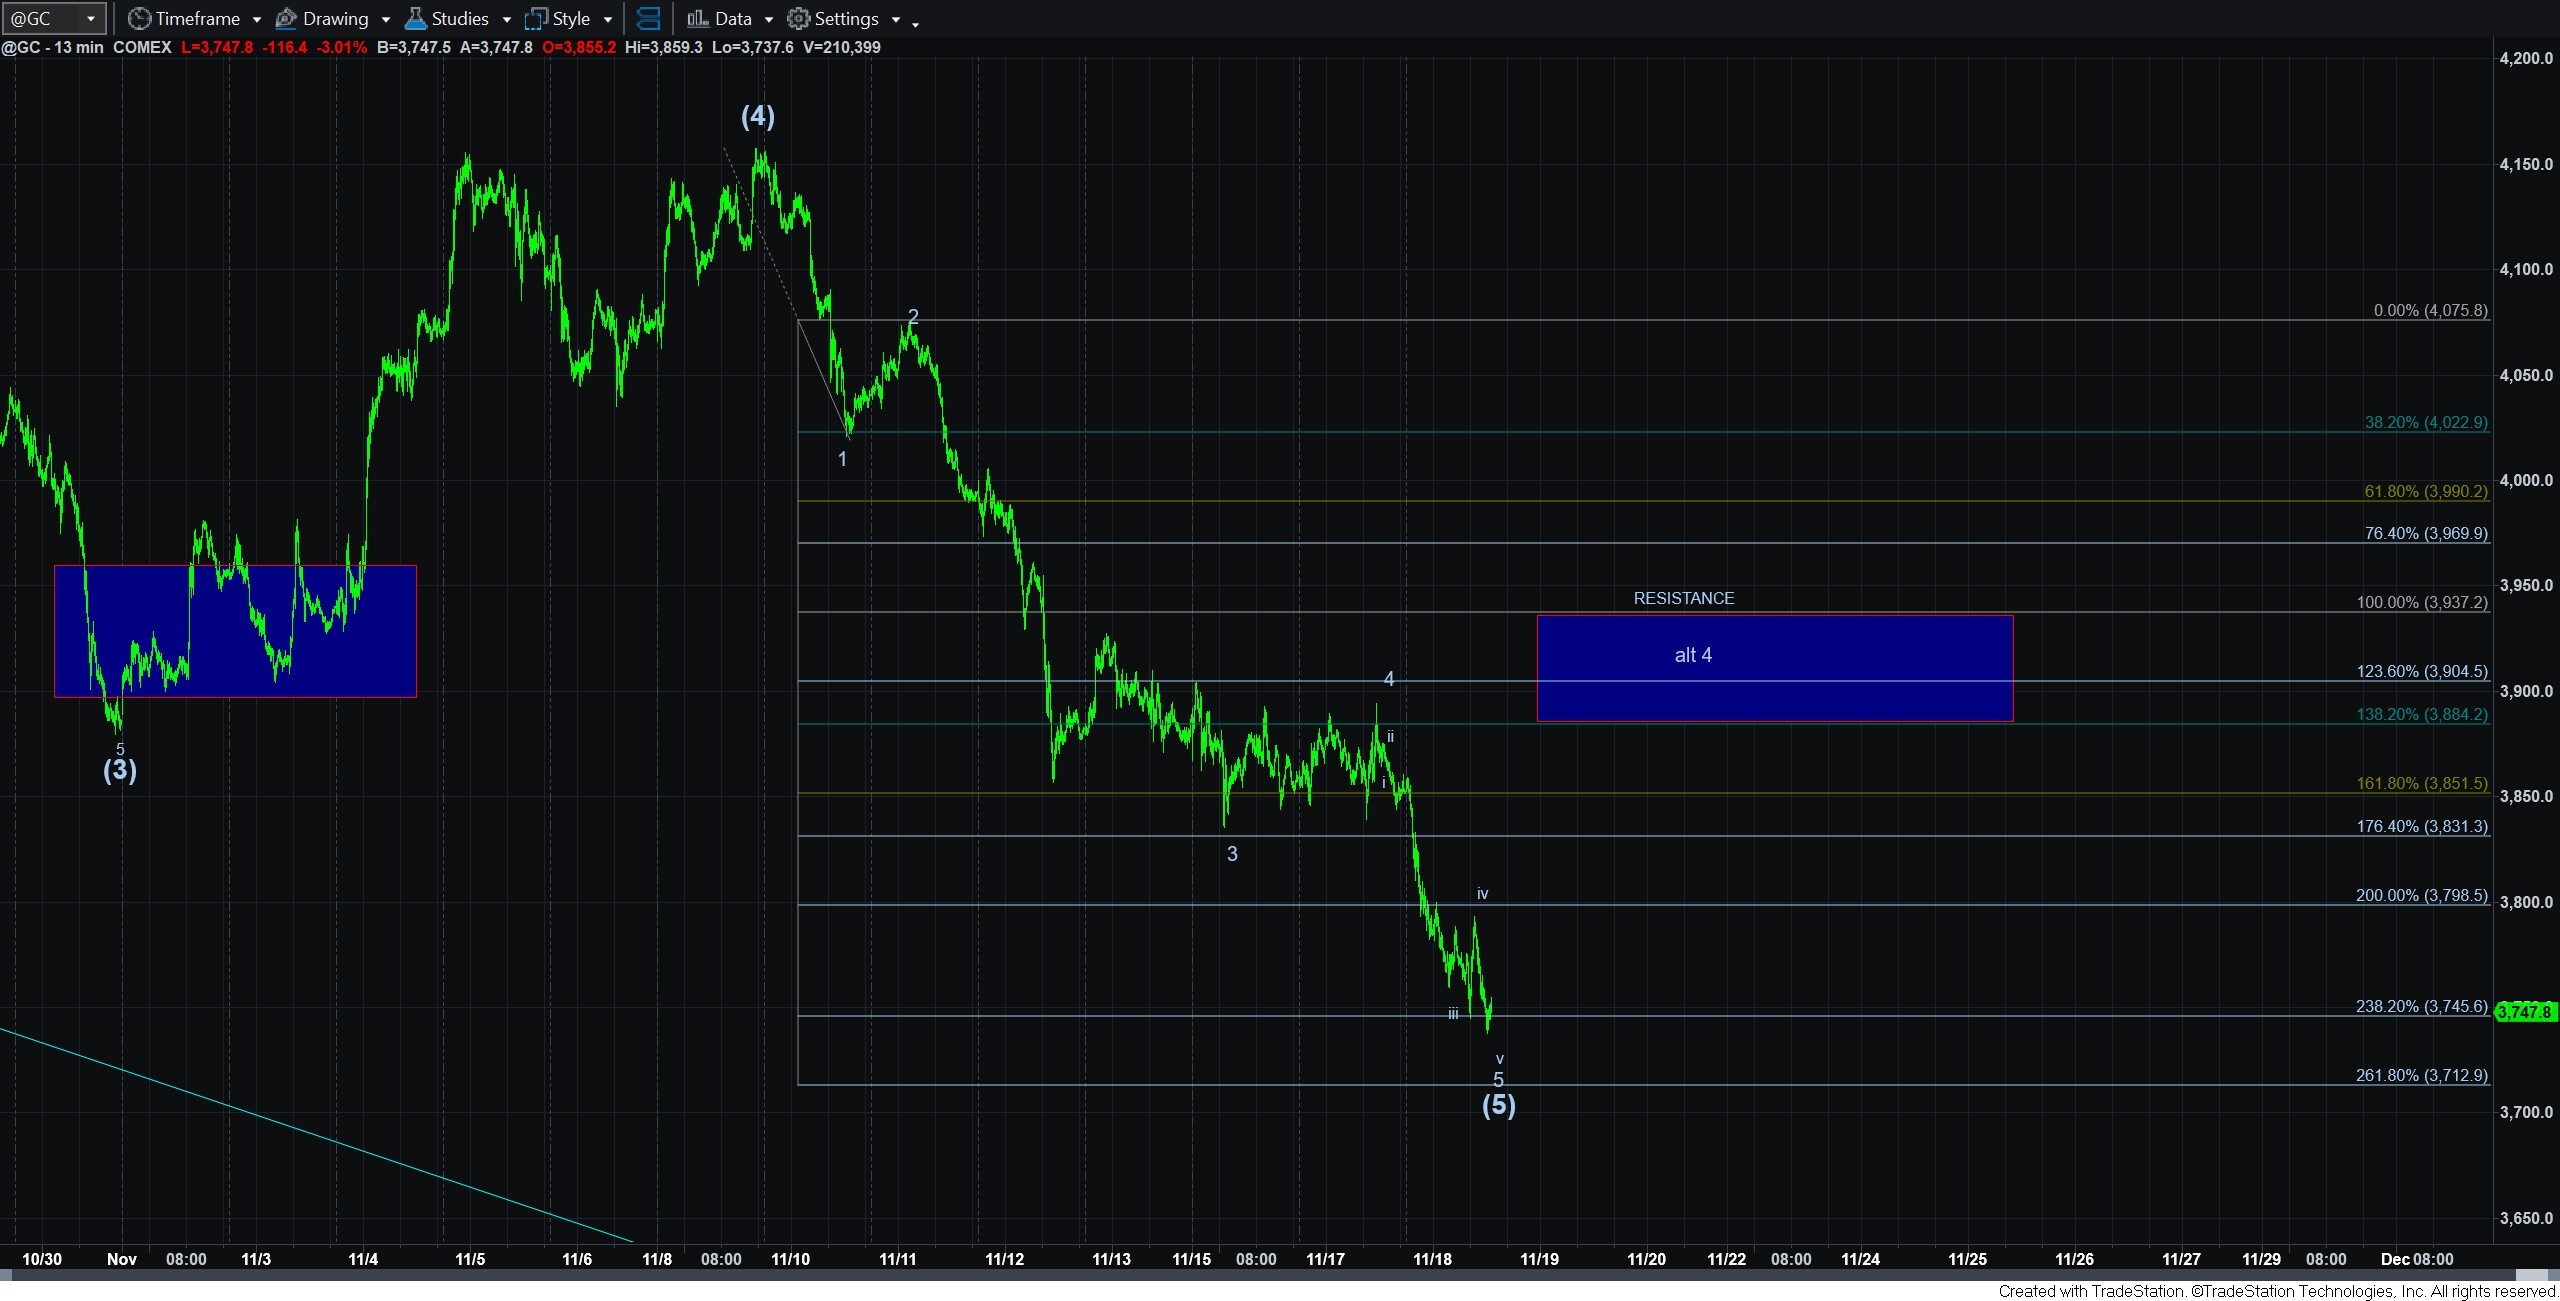
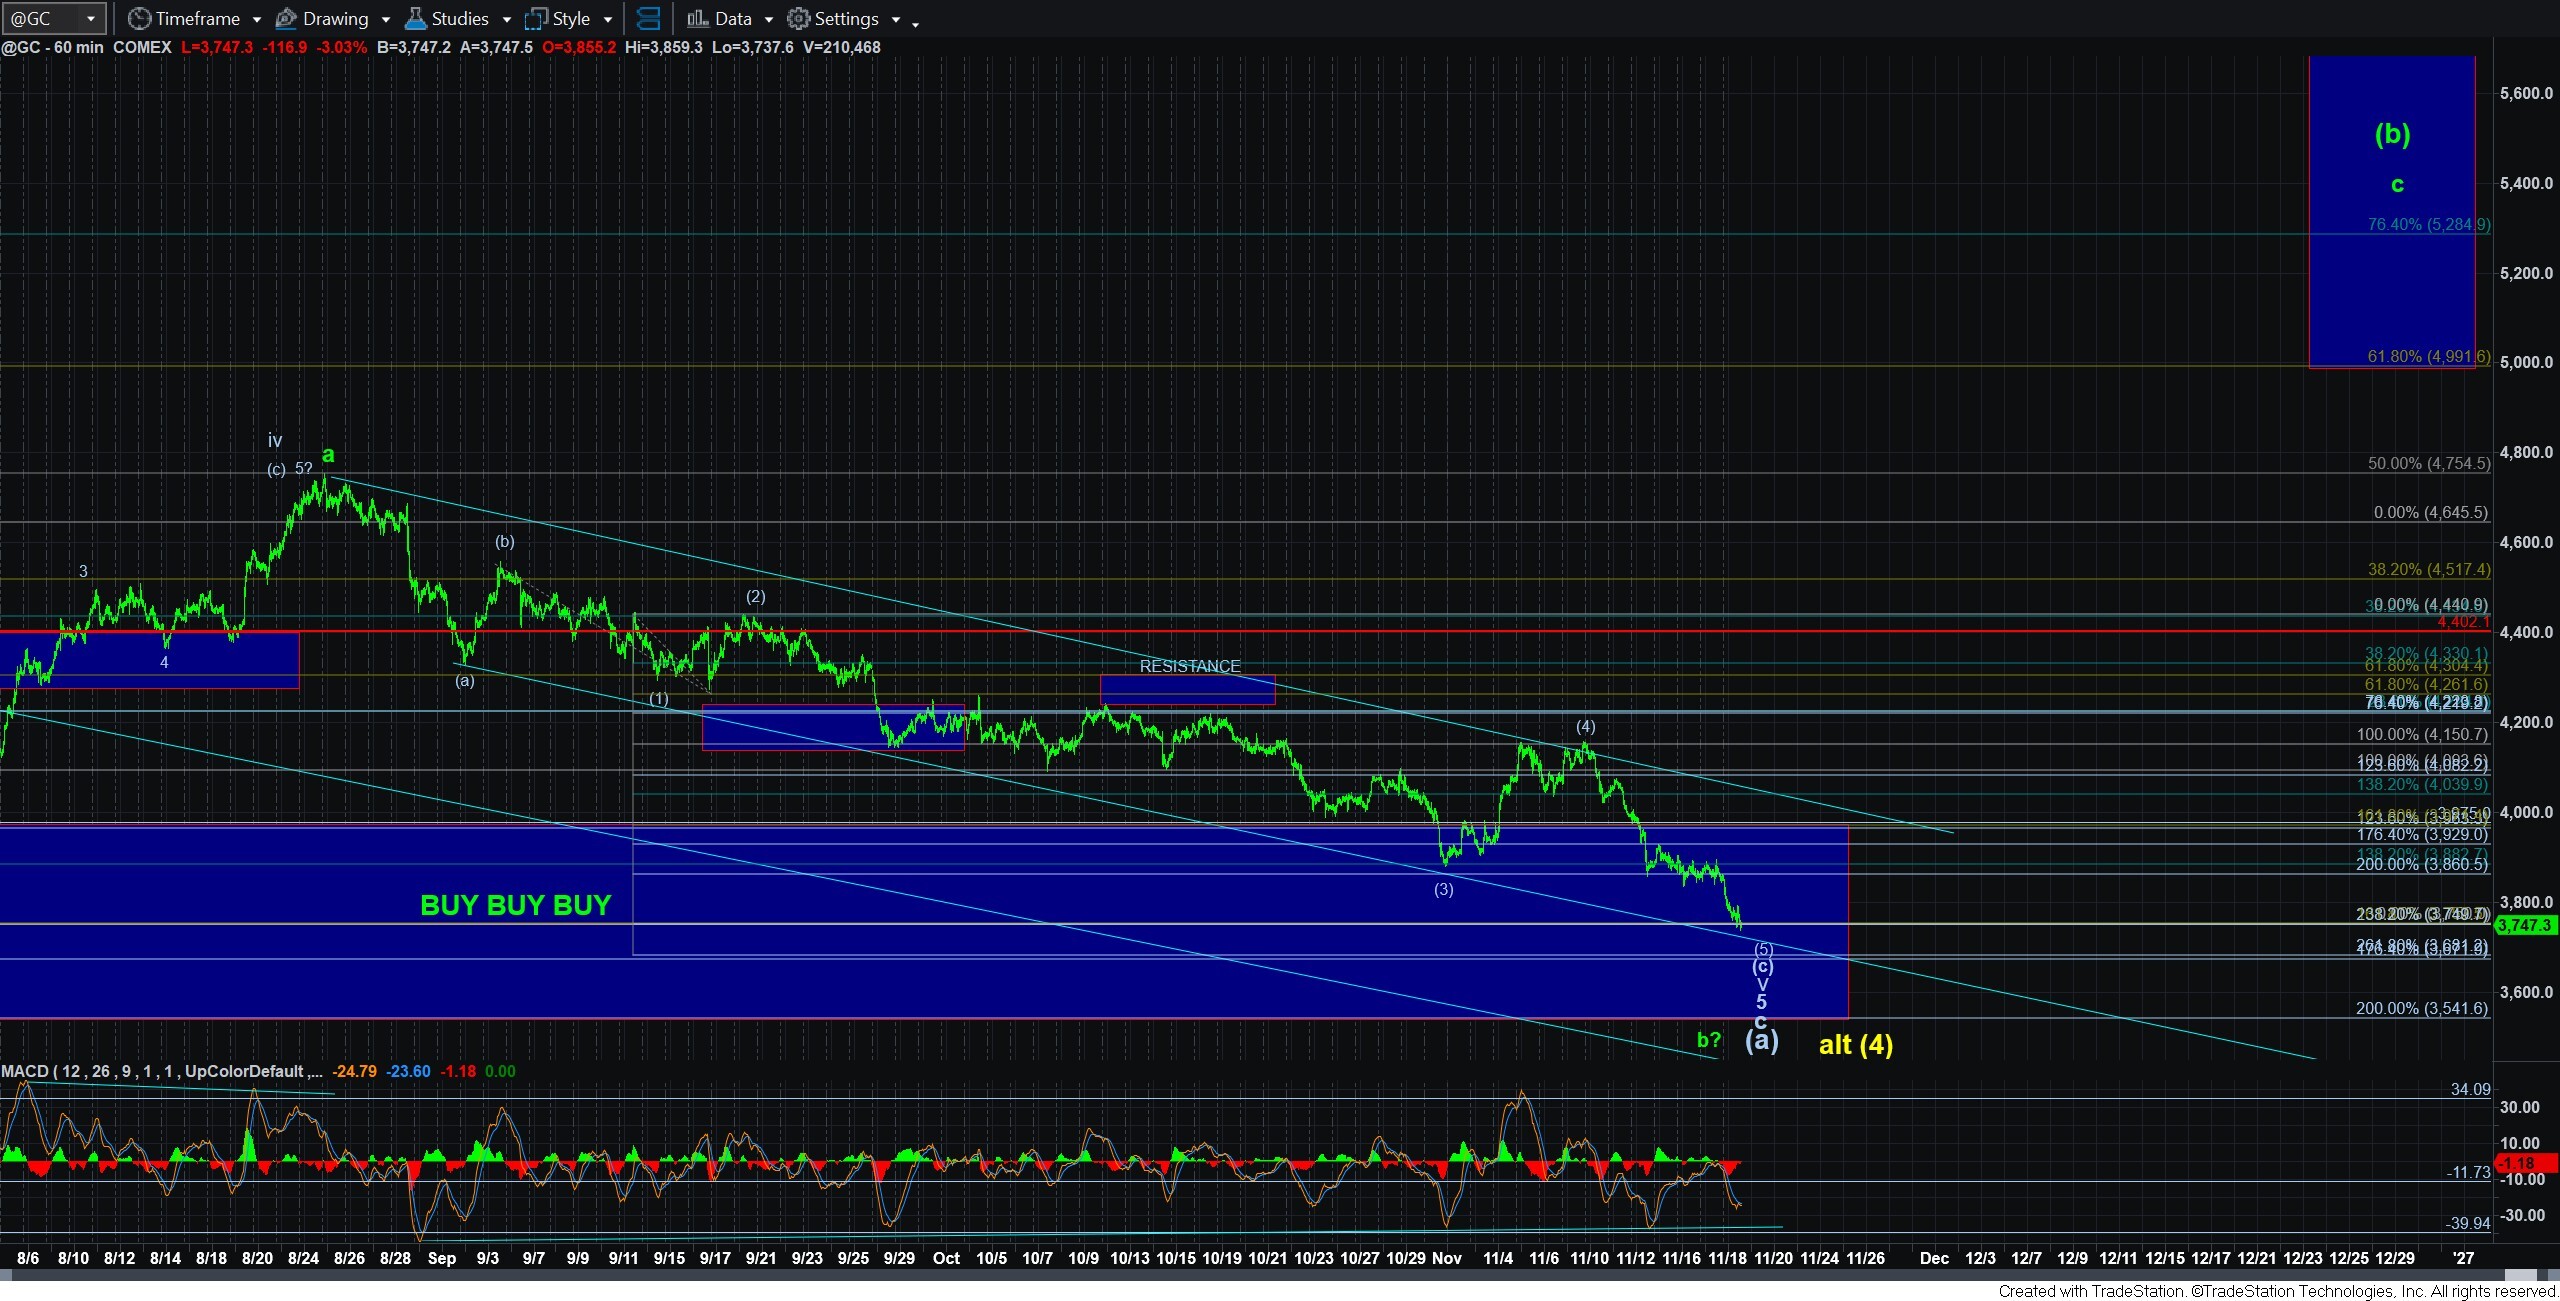
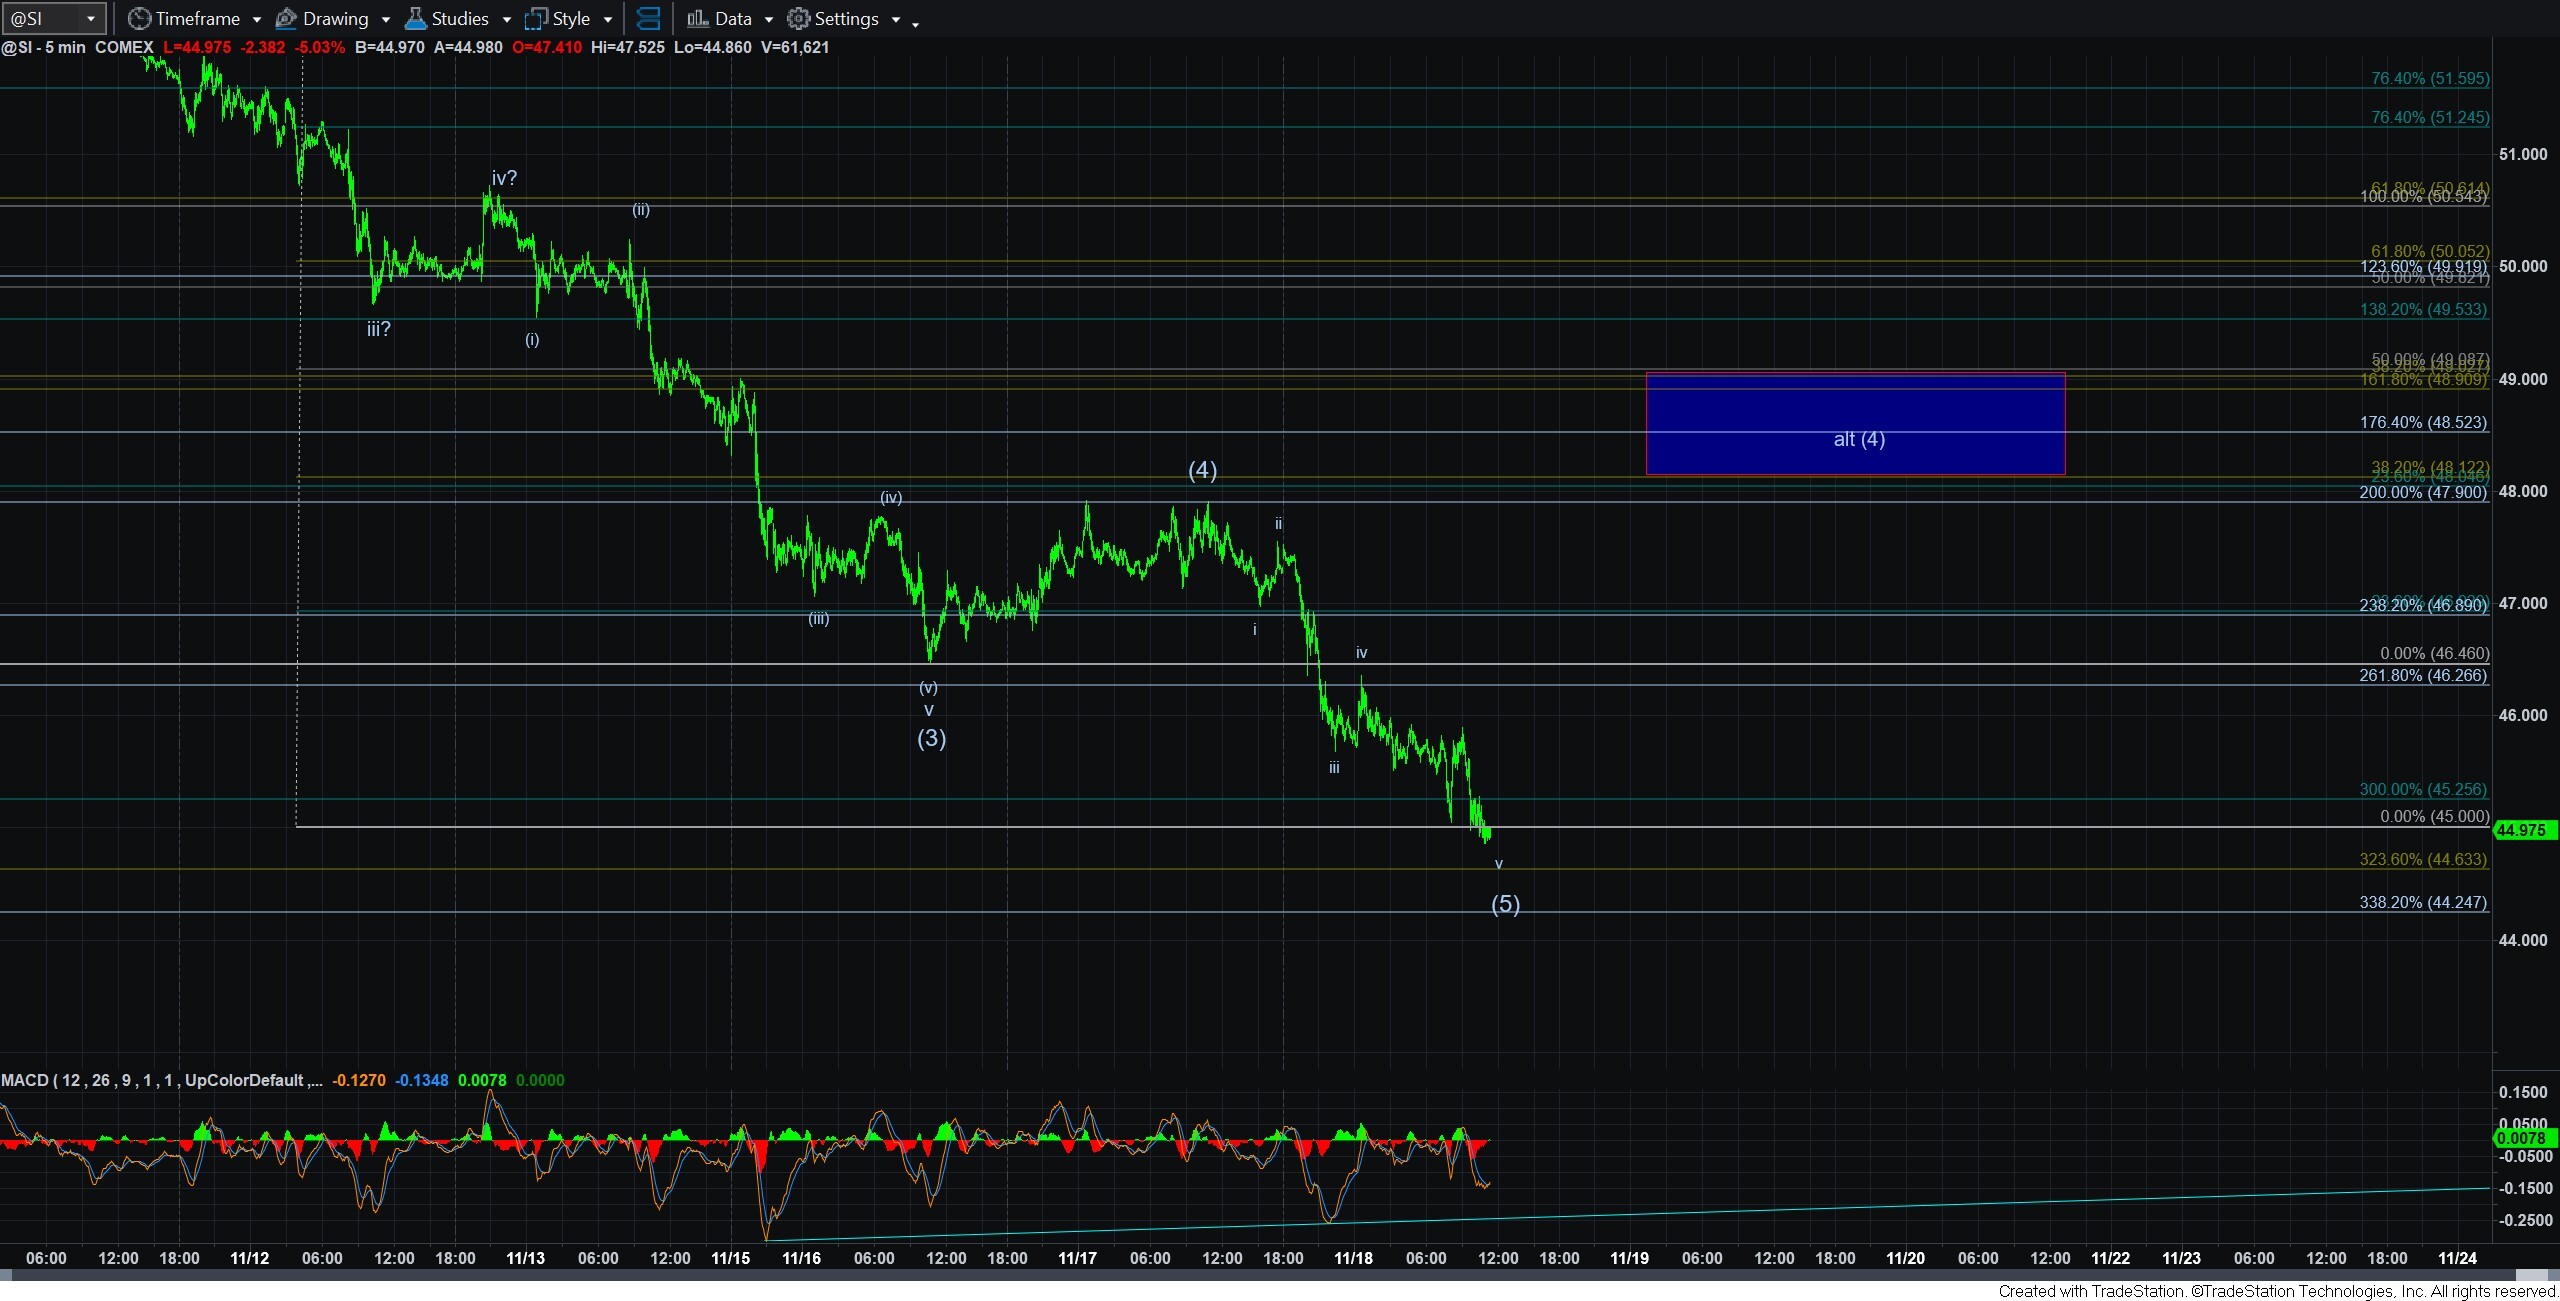
As far as gold is concerned, we are now seemingly completing a 5-wave 5th wave within a 5th wave, as you can see on the 13-minute gold chart. Note we are at the deeper target on the 60-minute chart for gold, also displaying really nice positive divergences. I have also added an alternative wave (4) on the 13-minute chart with the representative resistance which will need to be exceeded to begin to view gold as having bottomed.
However, I would strongly suggest we wait until gold is able to take out the upper downtrend line, which is now being presented on the 60-minute gold chart. Unfortunately, I only relied upon a lower trend channel, which we did exceed in the prior rally, only to still be turned down to a lower lo, w. So, I think it may be prudent to allow gold to take us out of this larger downtrend channel to make it likely that the
(b) wave (or something more bullish) is in progress.
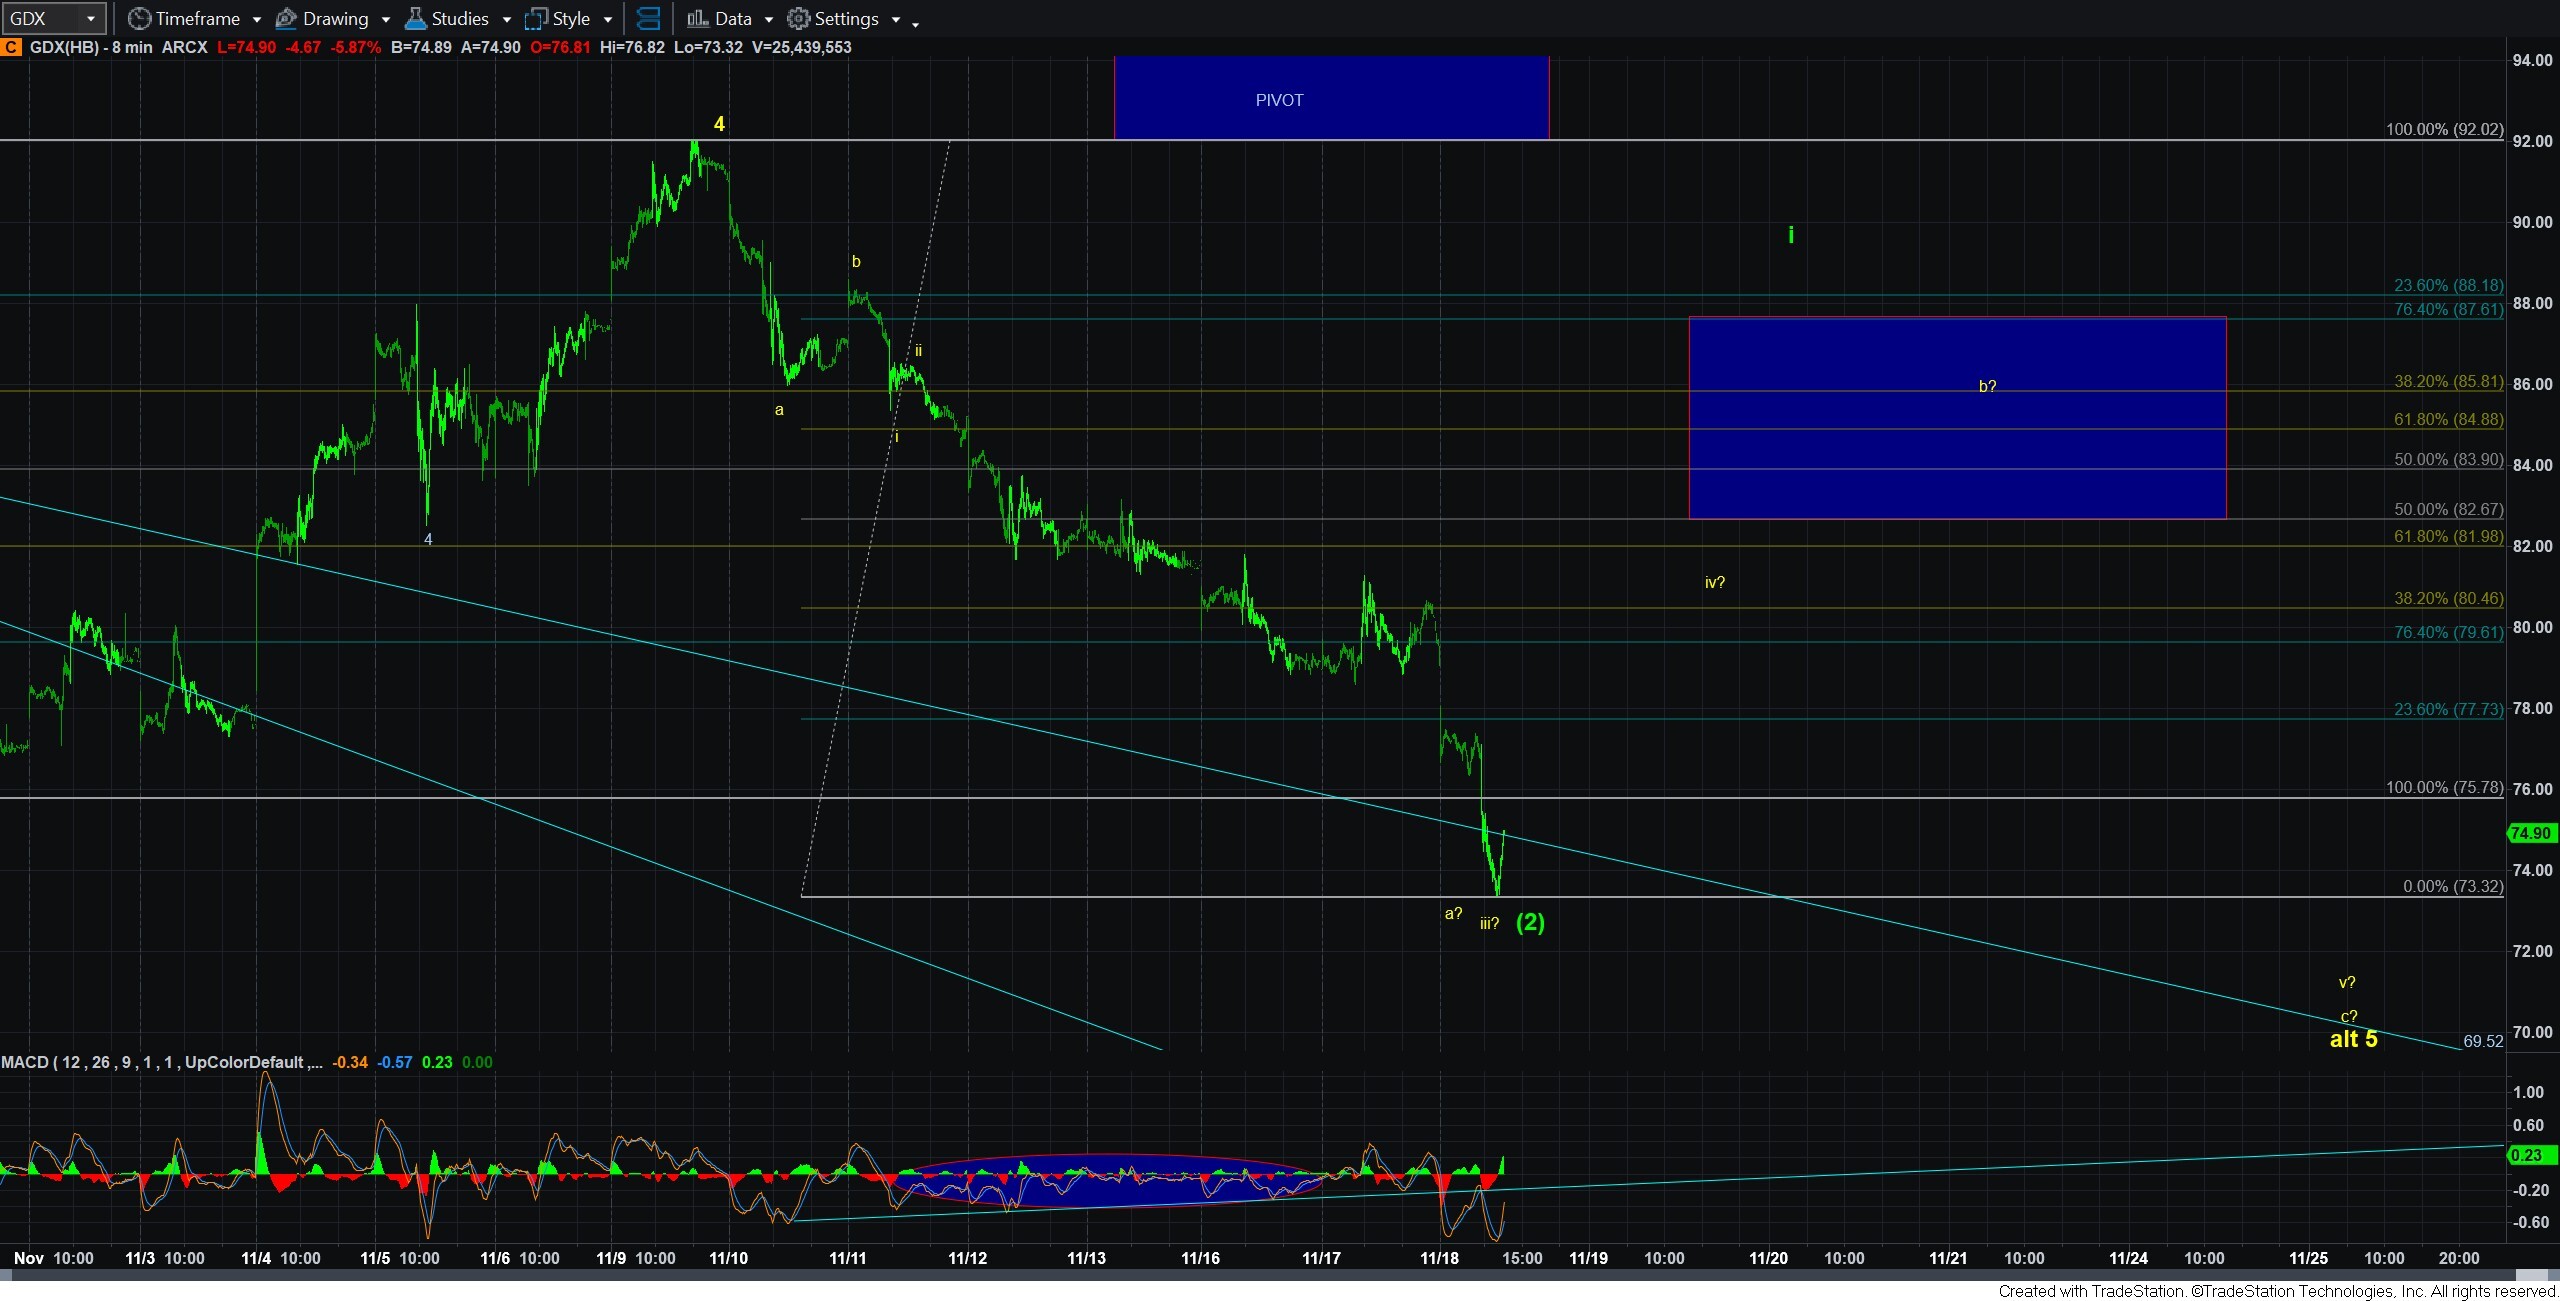
GDX is still the problem child. It has truly opened the door in a big way to the yellow count when it broke below the .764 retrace this week. And, there are two paths to potentially take us down to the 70 region. Remember that the yellow count’s c-wave is an ending diagonal, and takes shape as a 3-wave structure. So, either we are in the c-wave of that structure, which would likely still see a iv-v as shown in yellow on the 8-minute chart, or it is bottoming in the a-wave of the 5th wave of the c-wave, with the next rally being a corrective b-wave. I have added a resistance box on the chart to show this resistance region.
So, clearly, if the next rally is corrective, then it would be another opportunity to hedge your positions if you so choose. But, if the next rally is CLEARLY impulsive, and projects north of the resistance box for wave i, then you may choose to hedge a bit less. We will need to see how the next rally takes shape.
Overall, I would implore you to view the current structure as providing for a sale in the complex. Yes, we invalidated an immediate upside set up of late. But, rather than looking at that negatively, you may want to see that as an opportunity.
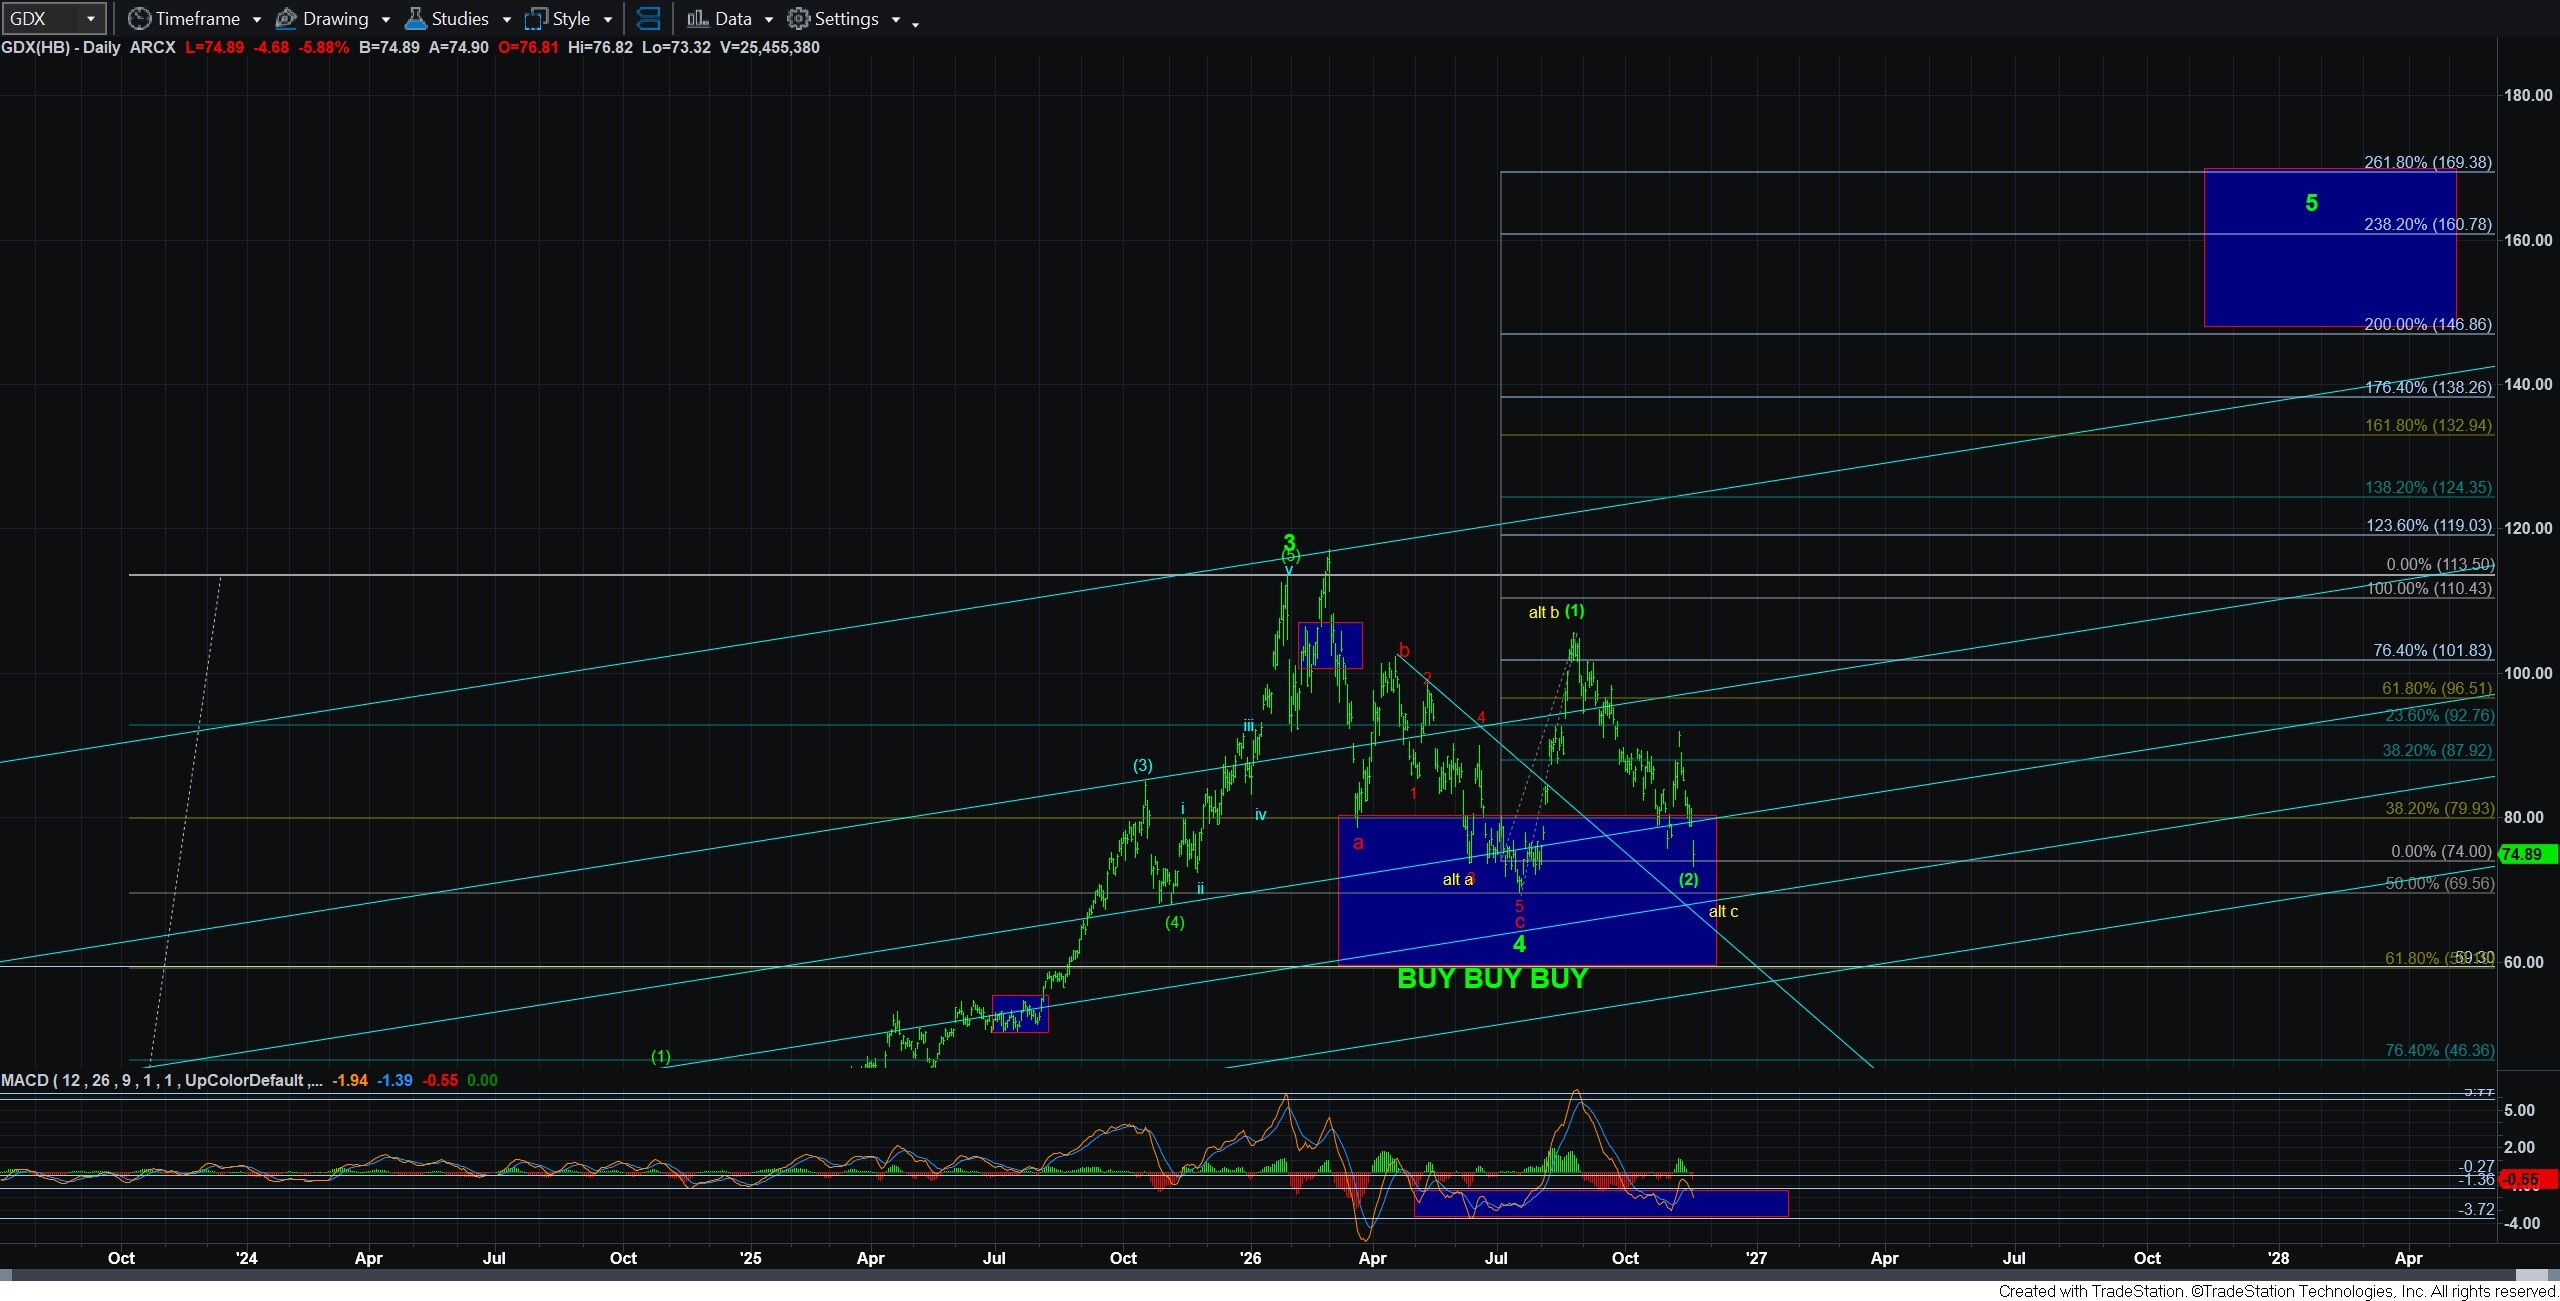
My larger degree expectations still remain that many of the individual mining stocks strongly argue for new all-time highs to be seen, which will likely propel GDX up towards our target box as well. However, there may be a number of individual mining stocks that will lag in that process too, at least based upon their current structures.
And, my primary view of gold and silver still remain that the next rally will likely be a corrective (b) wave, which can still carry us back towards the highs struck early this year. Yet, I will maintain an open mind that they can rally in a 5th wave to new and significant all-time highs (200 for silver and 7000 for gold) should the structures suggest so. For now, I am quite skeptical of that potential but am willing to be convinced otherwise.