Potential Acceleration Setup Above Multi-Month Channel
 By
Ricky Wen
By
Ricky Wen
The third week of January played out as expected because it was the typical daily 20EMA bounce into new all- time highs in order to cement the trend week price structure. The market is gunning for another acceleration phase as we head into some of the big earnings reports this week.
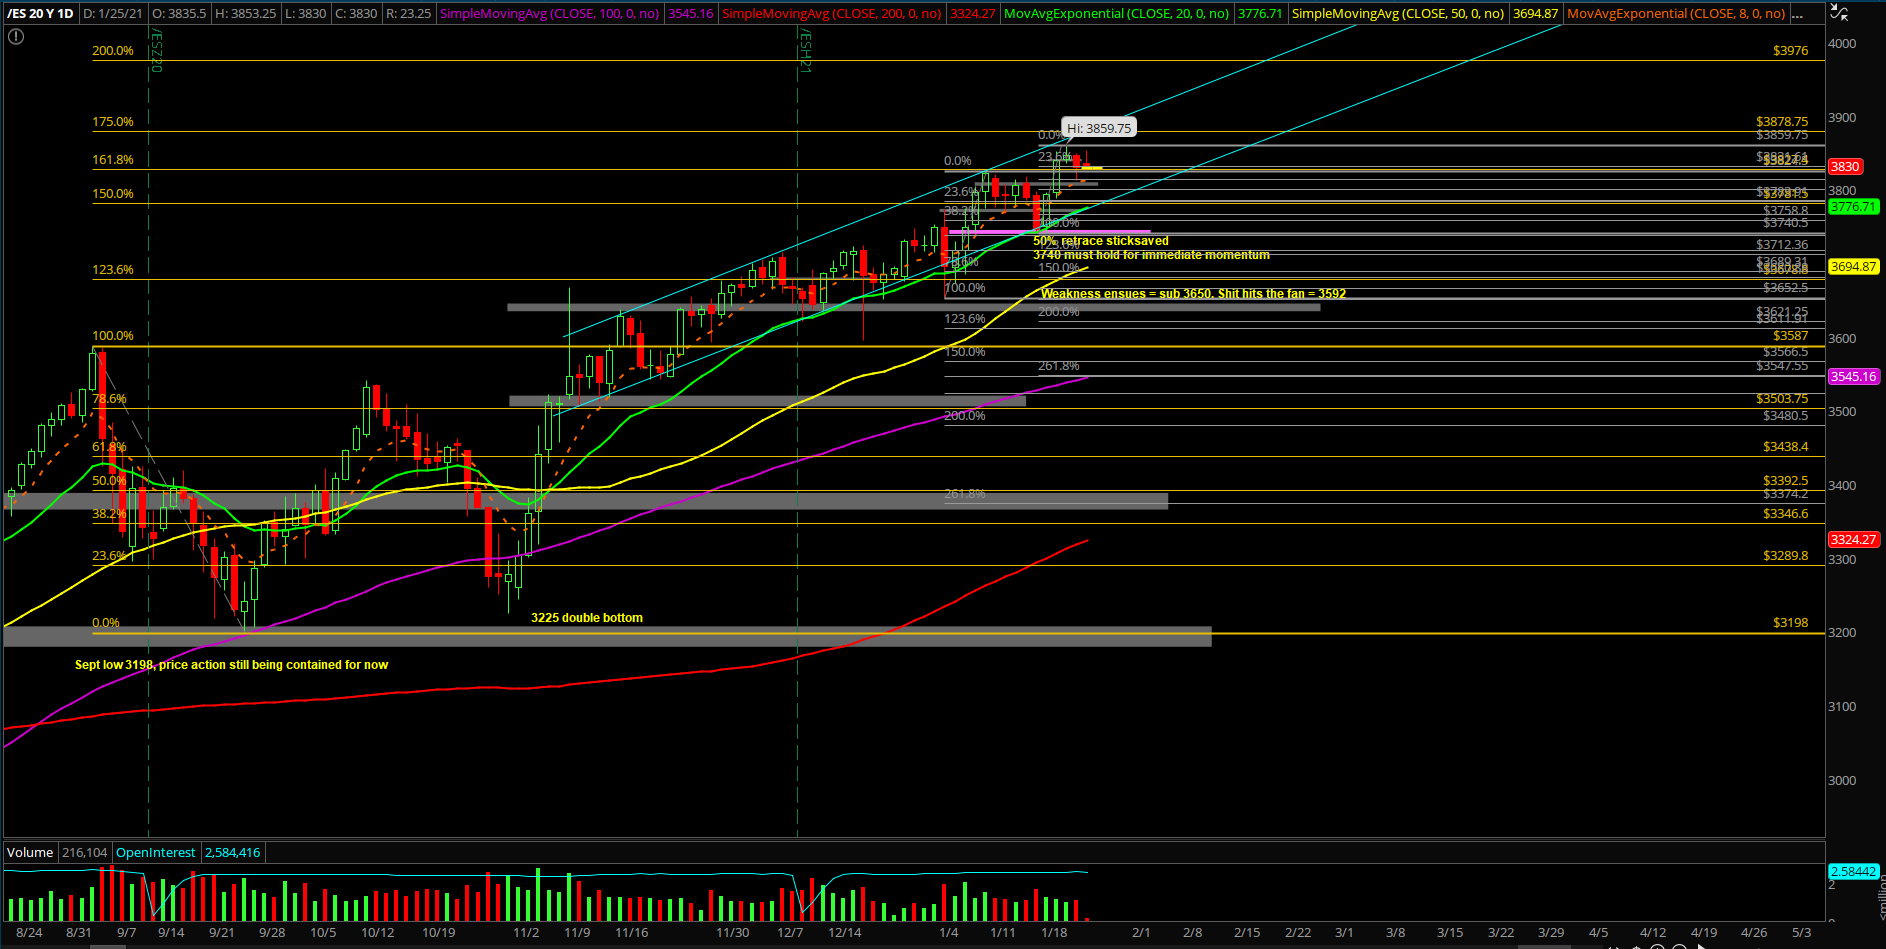
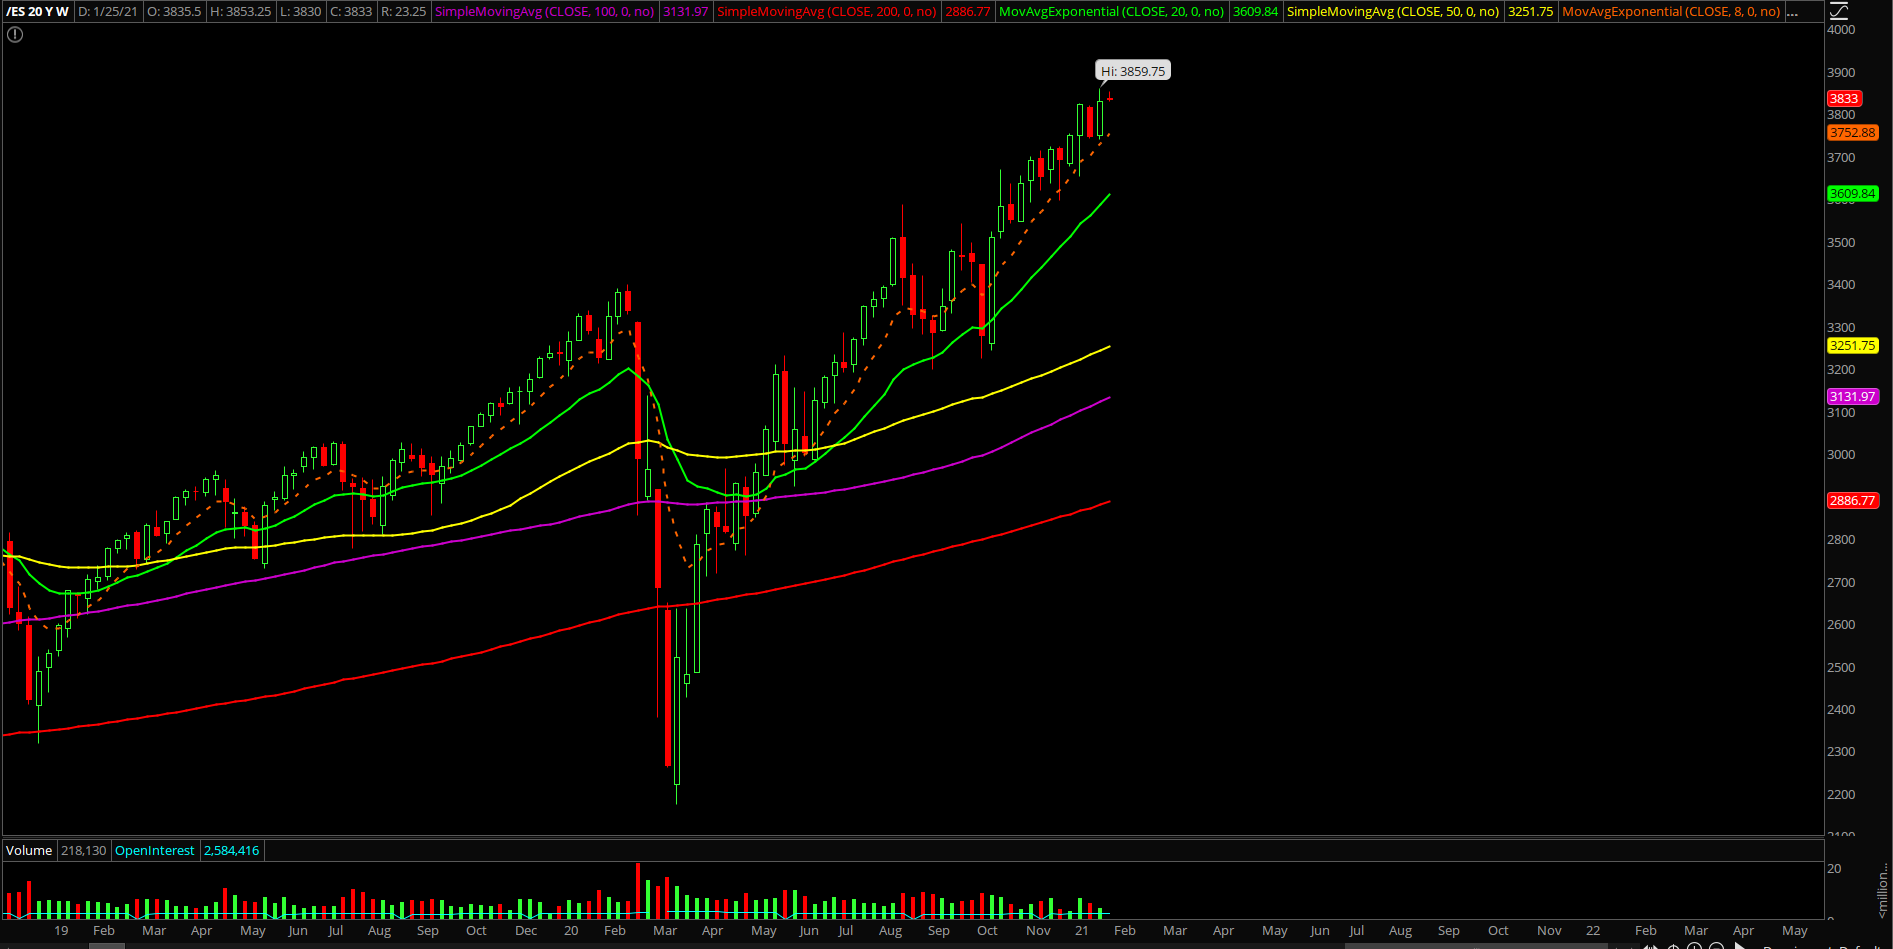
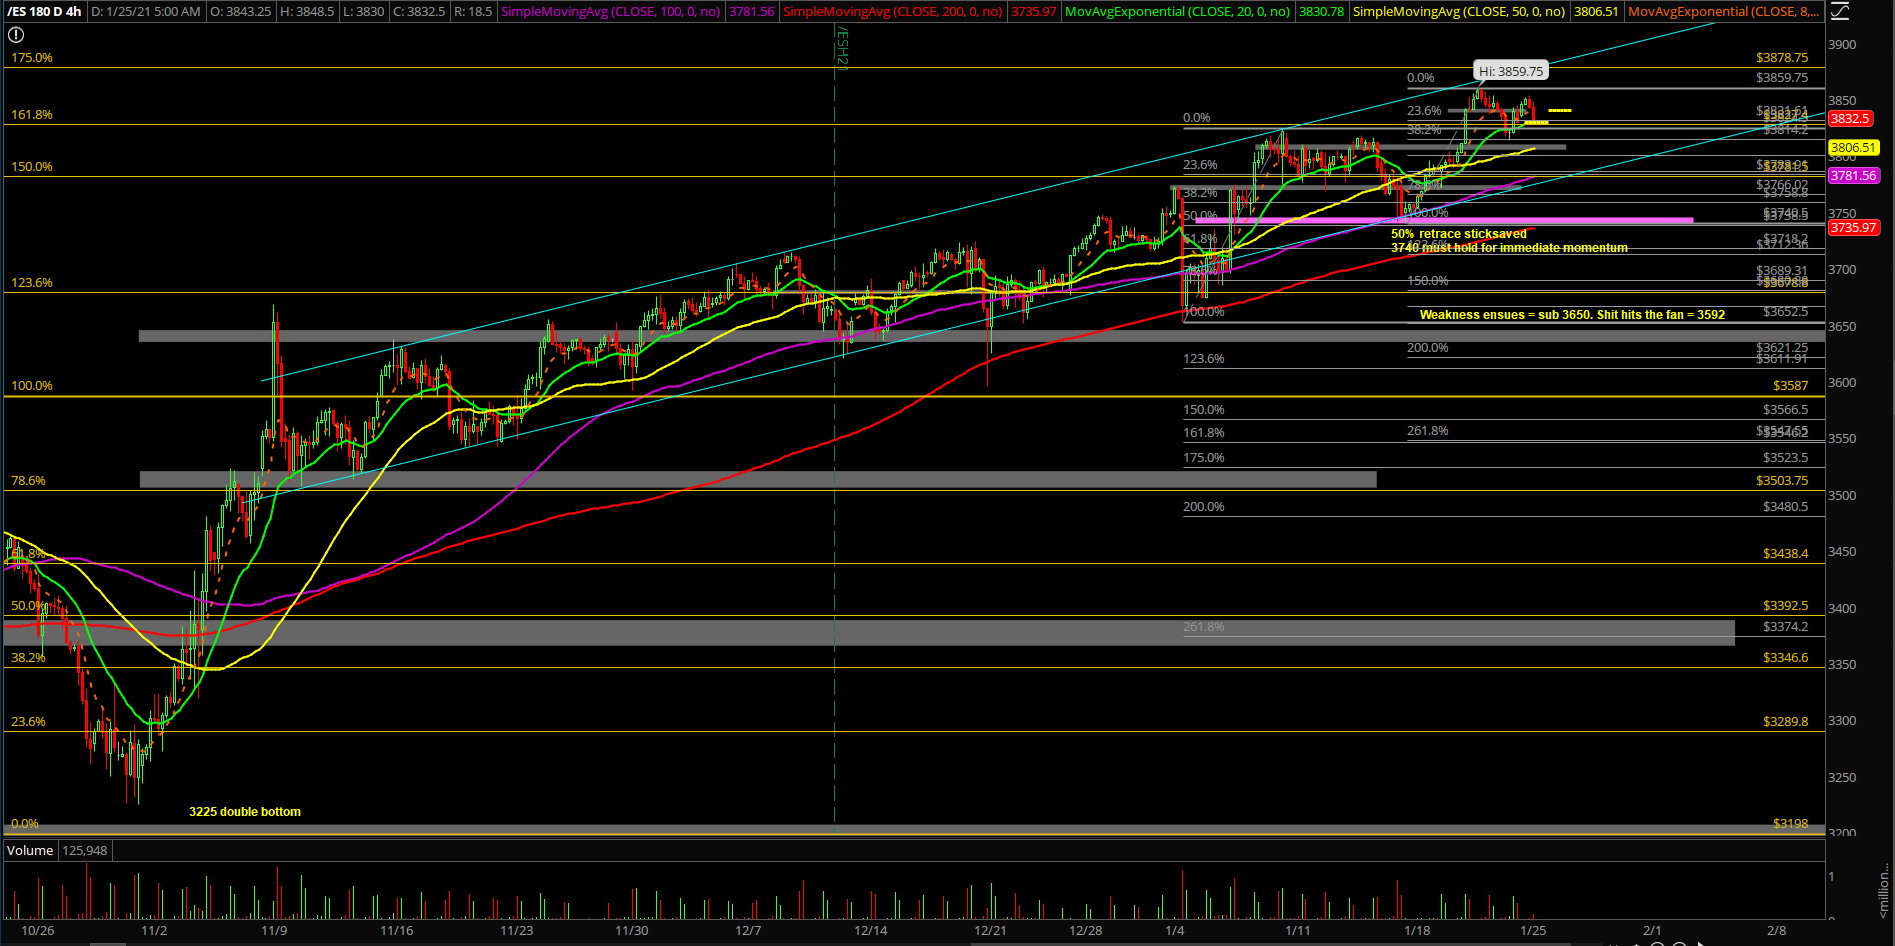
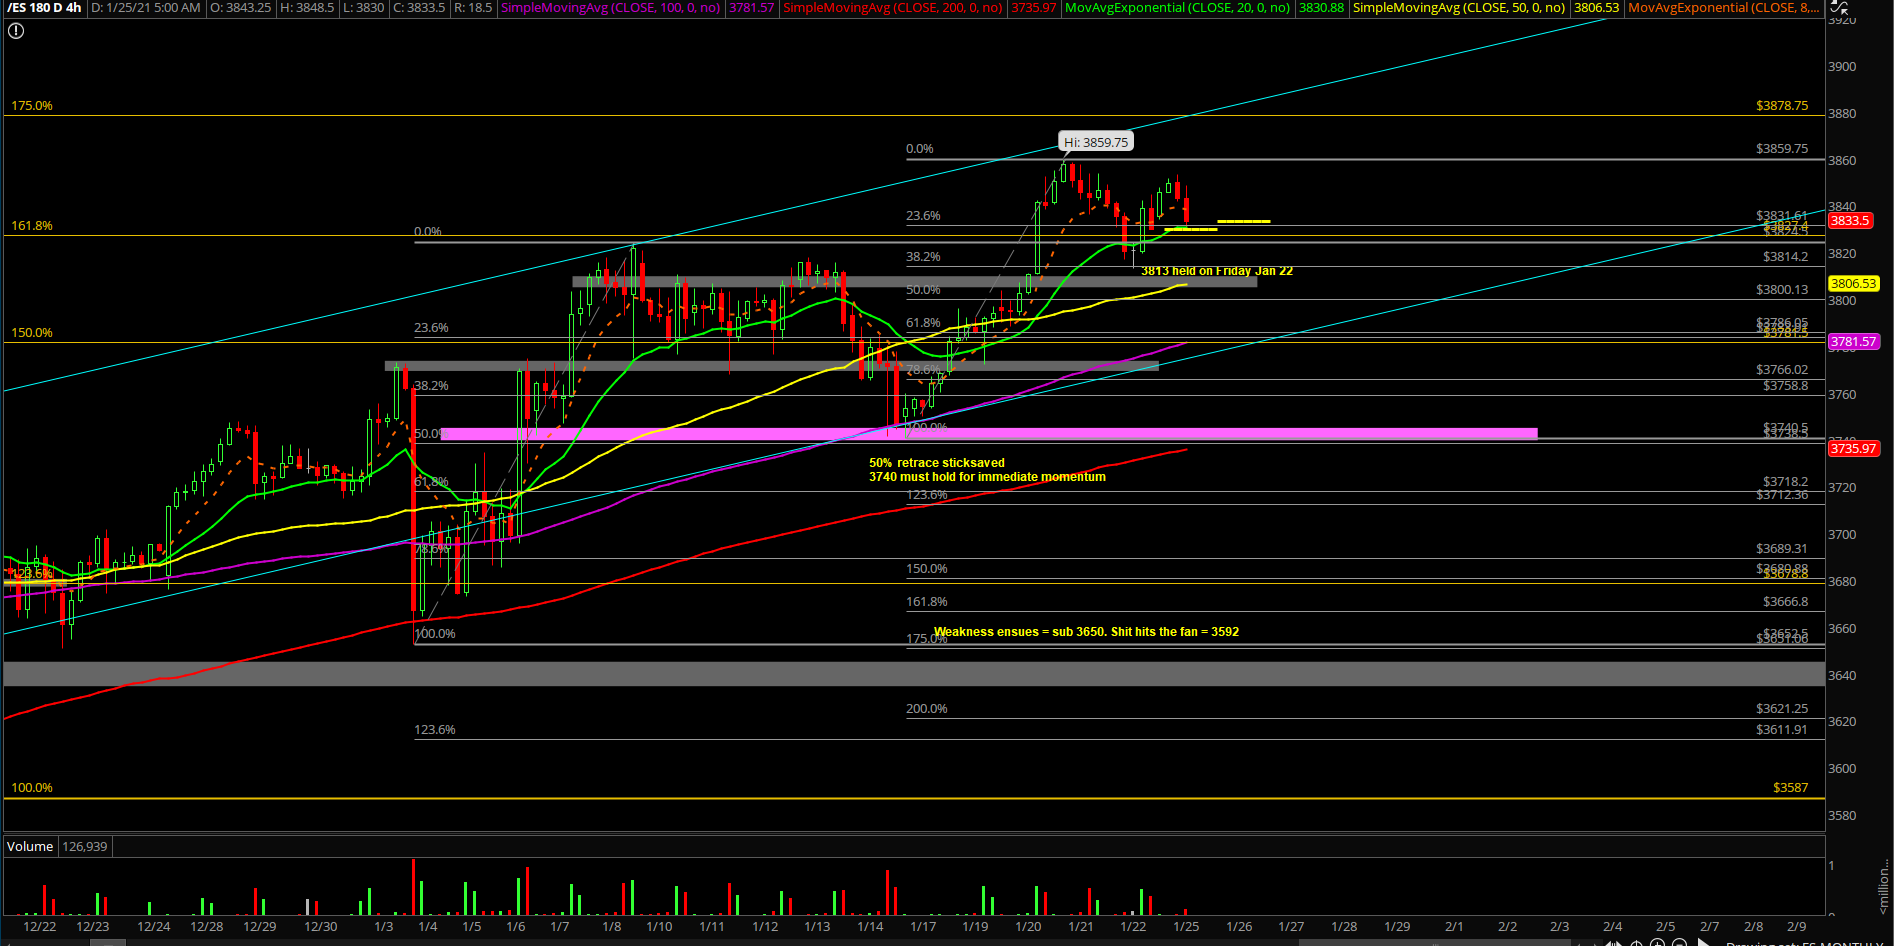
The main takeaway remains roughly the same: It’s been a healthy consolidation for the past few days and it looks more of the same going forward. Price action is doing its thing with stock rotations as the S&P 500 index "stick-saved" at the daily 20EMA trending support/confluence. It backtested into ES 3740-3750 confluence support and then made new all-time highs at 3850s. It’s very telling that there’s an insatiable bid underneath the market so we’ll continue to monitor this for additional clues. Either way, based on the bigger picture on the daily+weekly, it’s considered a bullish consolidation when above 3740 and weakness when below. As of writing, price action at 3830 and grinding on 4hr 20EMA, meaning that micro timeframes have aligned with higher timeframes, aka, timeframe alignment/golden goose setup.
What’s next?
Friday closed at 3830 on the ES, near the week’s high area as price is trending above the daily 8EMA support. For this week, it’s very easy to judge immediate momentum given last week’s daily 20EMA V-shape bounce into price action now doing the beginning of another acceleration phase to the upside.
In sum:
- Friday Jan 15, the market backtested into our 3740-3750 key support zone to shake out some weak hands, which represented the daily 20EMA trending support combined with the 50% fib retracement area of the entire rally from 3652.5-3824.50 (first week of Jan’s range).
- Then, during Jan 18 week, the market did its usual V-shape bounce into new all time highs as a trend week up and now we’re looking for another continuation to the upside.
- Just be aware, there’s a lot of earnings report this week so we’re bound to get some volatility. Manage your expectations and adjust accordingly. Know your timeframes.
- For today or heading into this week, utilize 3830/3813 as key trending support levels derived from the past couple days. Look for dip buying opportunities until support actually breaks.
- For reference, the bull train is doing 4hr 20ema grind up and aligning with the 3830 premaret low thus far, see if this momentum sticks after the RTH open.
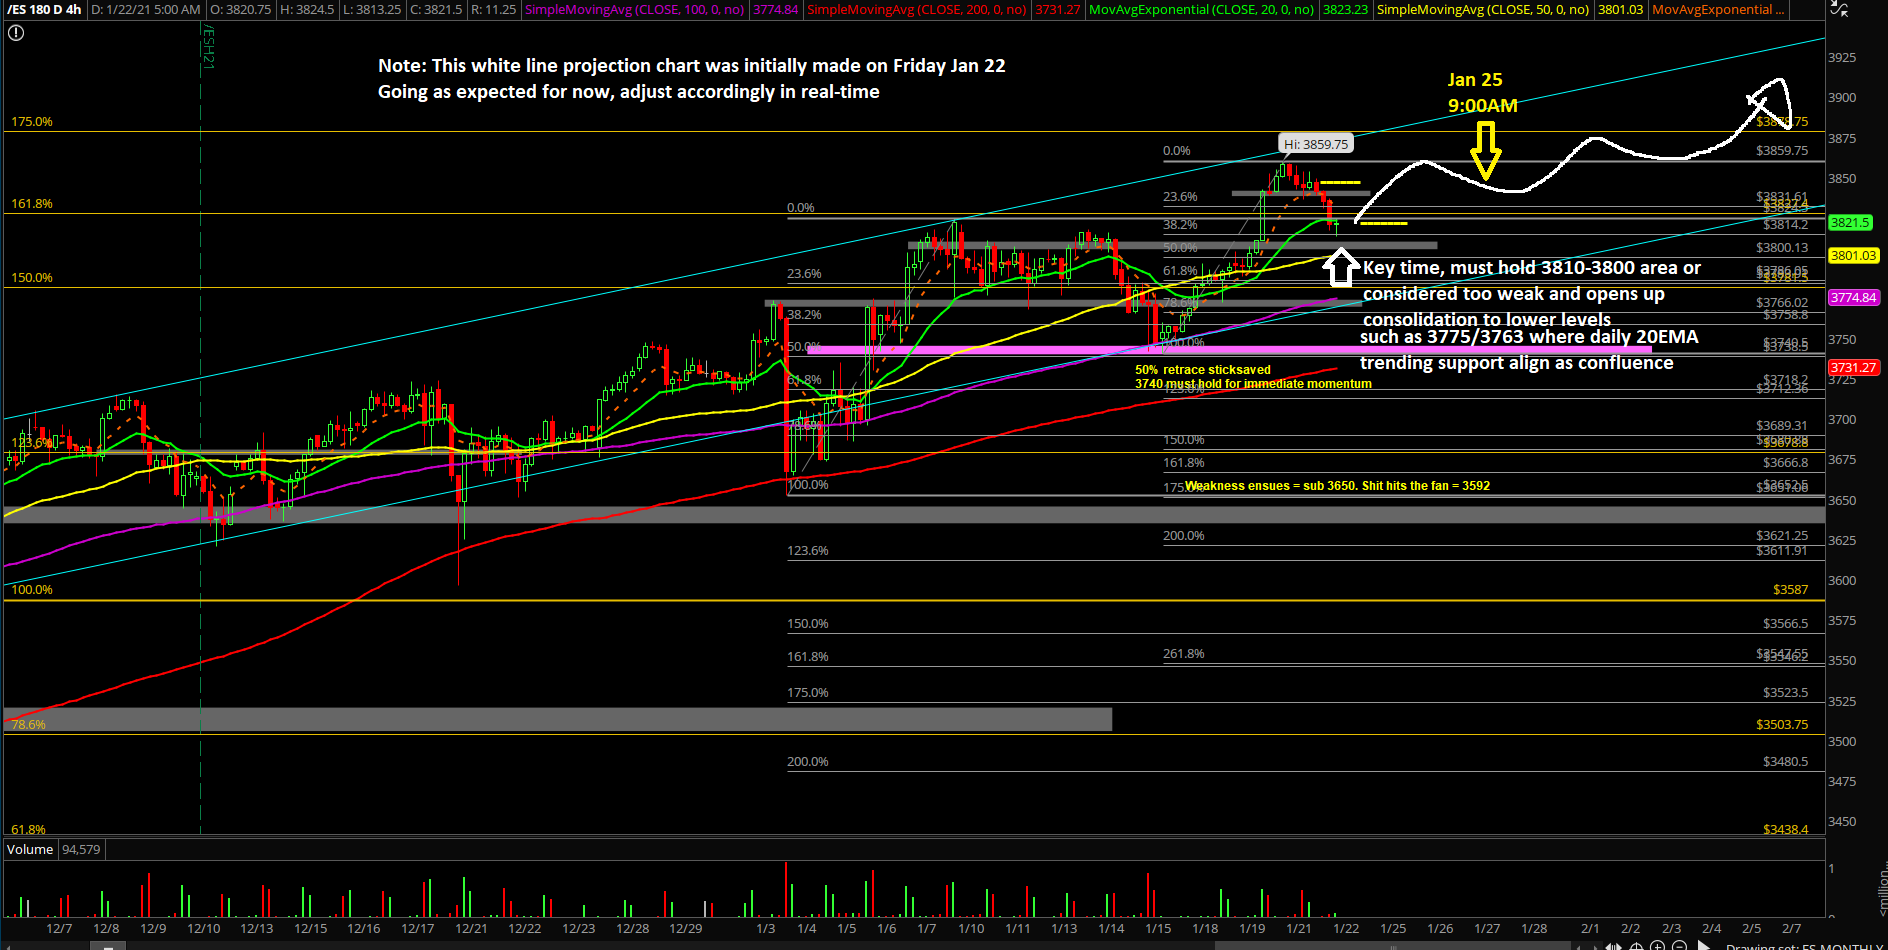
- A sustained break above last week’s high of 3859 would confirm 3878/3900 as immediate targets within the direction of our multi-month target of 3976 (calculated many months ago).
- Sustaining below 3813/3810 levels would open up immediate lower levels such as 3800/3785/3773…
- On the higher timeframes, we’re treating last week’s low 3740 as a key pivot given that this week could be a continuation week within the uptrend channel and have the potential to accelerate OUTSIDE this multi-month channel from November given how all the setups remain bullish. The surprise is to the upside for now, until at least one support could breakdown and price action sustaining below it.
- At this point on the short-term, there should be no breakdown below this 3740 number given the prior week’s breakout setup + powerful daily 20EMA bounce+ new all time highs being established. Otherwise, stay clear and objective.