PayPal: The Shift Is On
 By
Levi
By
Levi
By Levi at Elliott Wave Trader; Produced with Avi Gilburt
What shift is this? Actually, there are two possible shifts in play at the moment. We’ll talk about how these are likely to affect the stock. We’ll also examine how using crowd sentiment, especially in a stock like PYPL that is widely traded, can assist us with risk versus reward projections.
Firstly, when Lyn Alden renders an opinion for us in StockWaves, it is typically the distillation of many data points condensed into actionable insights. Recently, we asked her about one of the latest Wave Setups featured to members - PYPL.
Below we can review her updated perspective. Then, we will dive into the crowd behavior studies. Finally, this will blend into our overall scenario with an investment idea that provides specific price levels for confirmation or denial of the scenario. Here we go!
Shifting Fundamentals
Here are Lyn’s most recent comments to members:
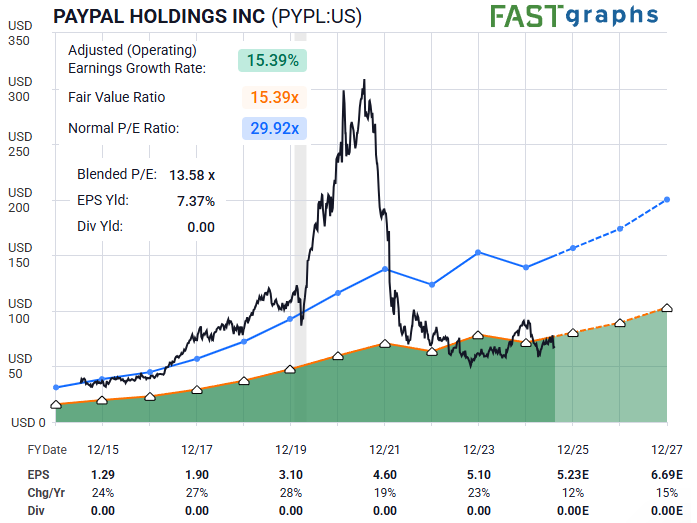
“PYPL has firmly shifted from growth stock to value stock, and its fundamentals point upward along with technicals.
It's inexpensive, has a decent balance sheet, and shoves cash flows into share repurchases. From a fundamental perspective, investors need to assess the probability that they rapidly lose market share or manage to hold on to what they have and return capital to shareholders for many years. My base case leans toward the latter.” - Lyn Alden
Let’s work with Lyn’s base case and see how crowd sentiment agrees with her take.
Studying Crowd Sentiment
With an average daily volume of 12 million shares traded, there are plenty of votes available to render an opinion from the masses. But how does this process actually work? A brief aside, if you wouldn’t mind. Let us frame this to make better sense of what we do every day for members.
Avi Gilburt regularly shares insights regarding our preferred method of analysis to track and project crowd sentiment. Here are some of his comments regarding this methodology:
“For those that have spent time working with me, they have learned that it is based upon a logical progression of if/then propositions.
You see, based upon the structure of the market action, we gain insight into where it will move next, in a probabilistic sense. Moreover, if the market begins to move in a manner that is inconsistent with that structure, then it provides us early warning signs so we can stop out and re-adjust our positions.” - Avi Gilburt
So let’s use this regarding the PYPL chart and look deeper into what the structure of price is communicating to us.
The Framework Of A Setup
Several times a week our lead analysts, Zac Mannes and Garrett Patten, generate new Wave Setups or update existing ones that are ongoing and in motion. Without going too much into the fine print and technicalities of how this is done, let’s take a peek at the recent PYPL Wave Setup shared a few days ago.
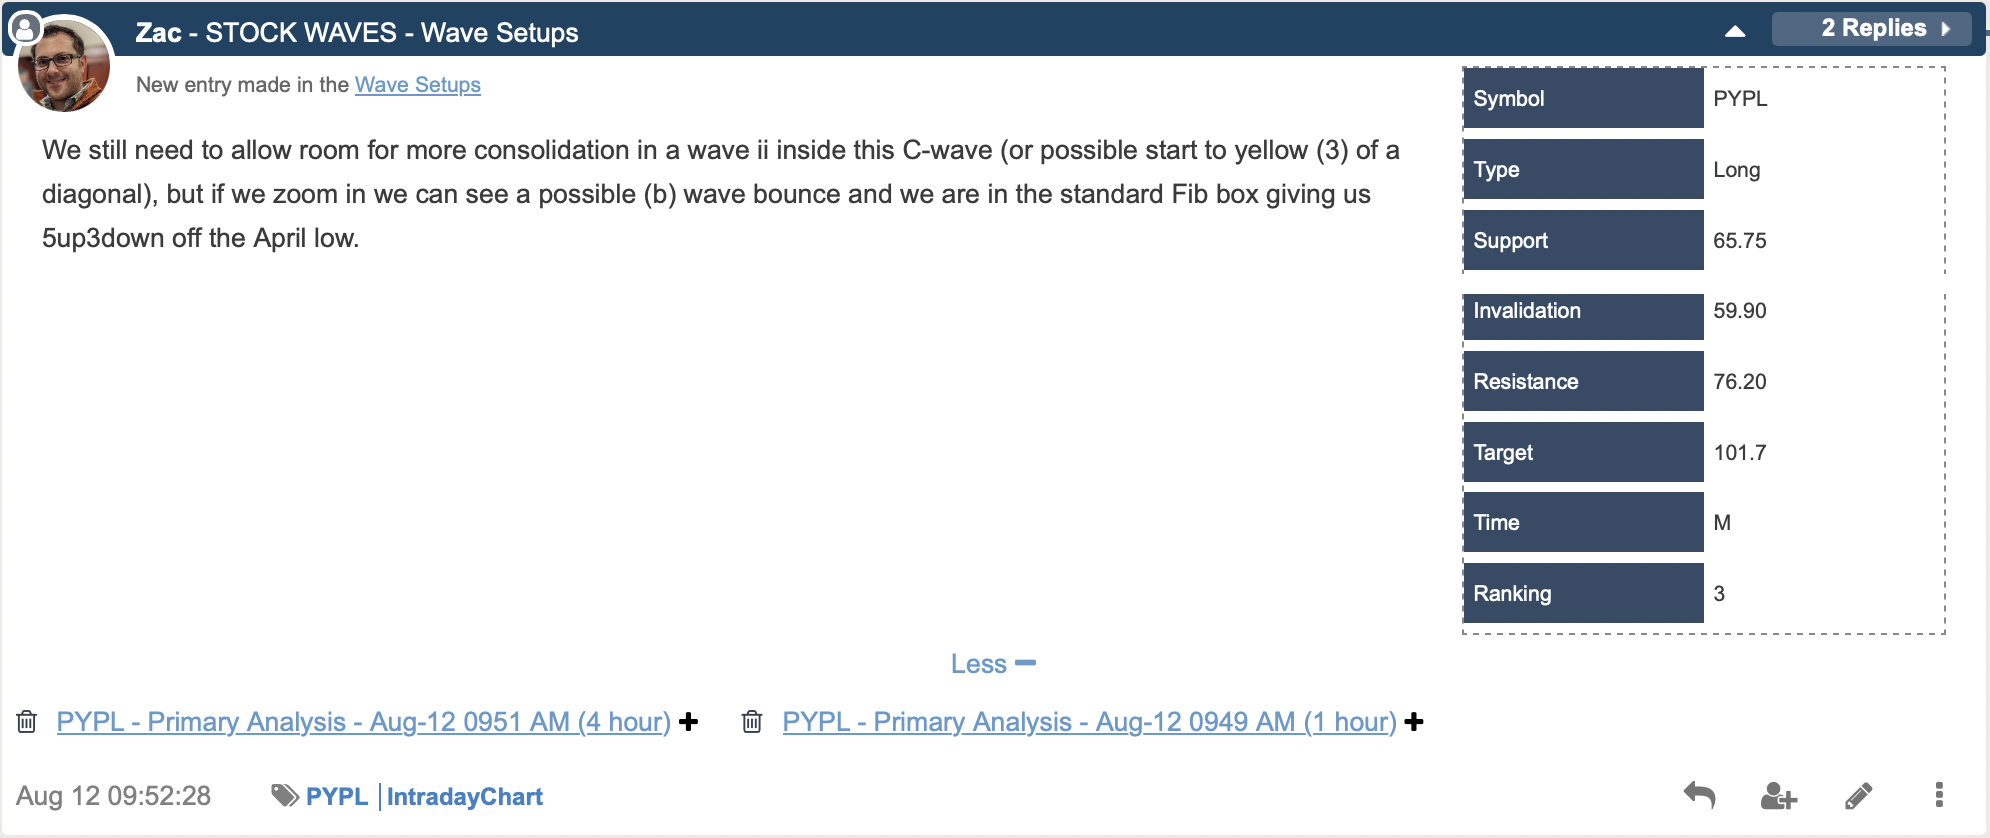
You can see how this scenario is framed with specific parameters. These price levels will either provide us further confirmation of our opinion, or they will tell us to take a more cautious stance. It’s also possible that the setup simply invalidates. And, you know what? That’s OK - not all setups are certainties.
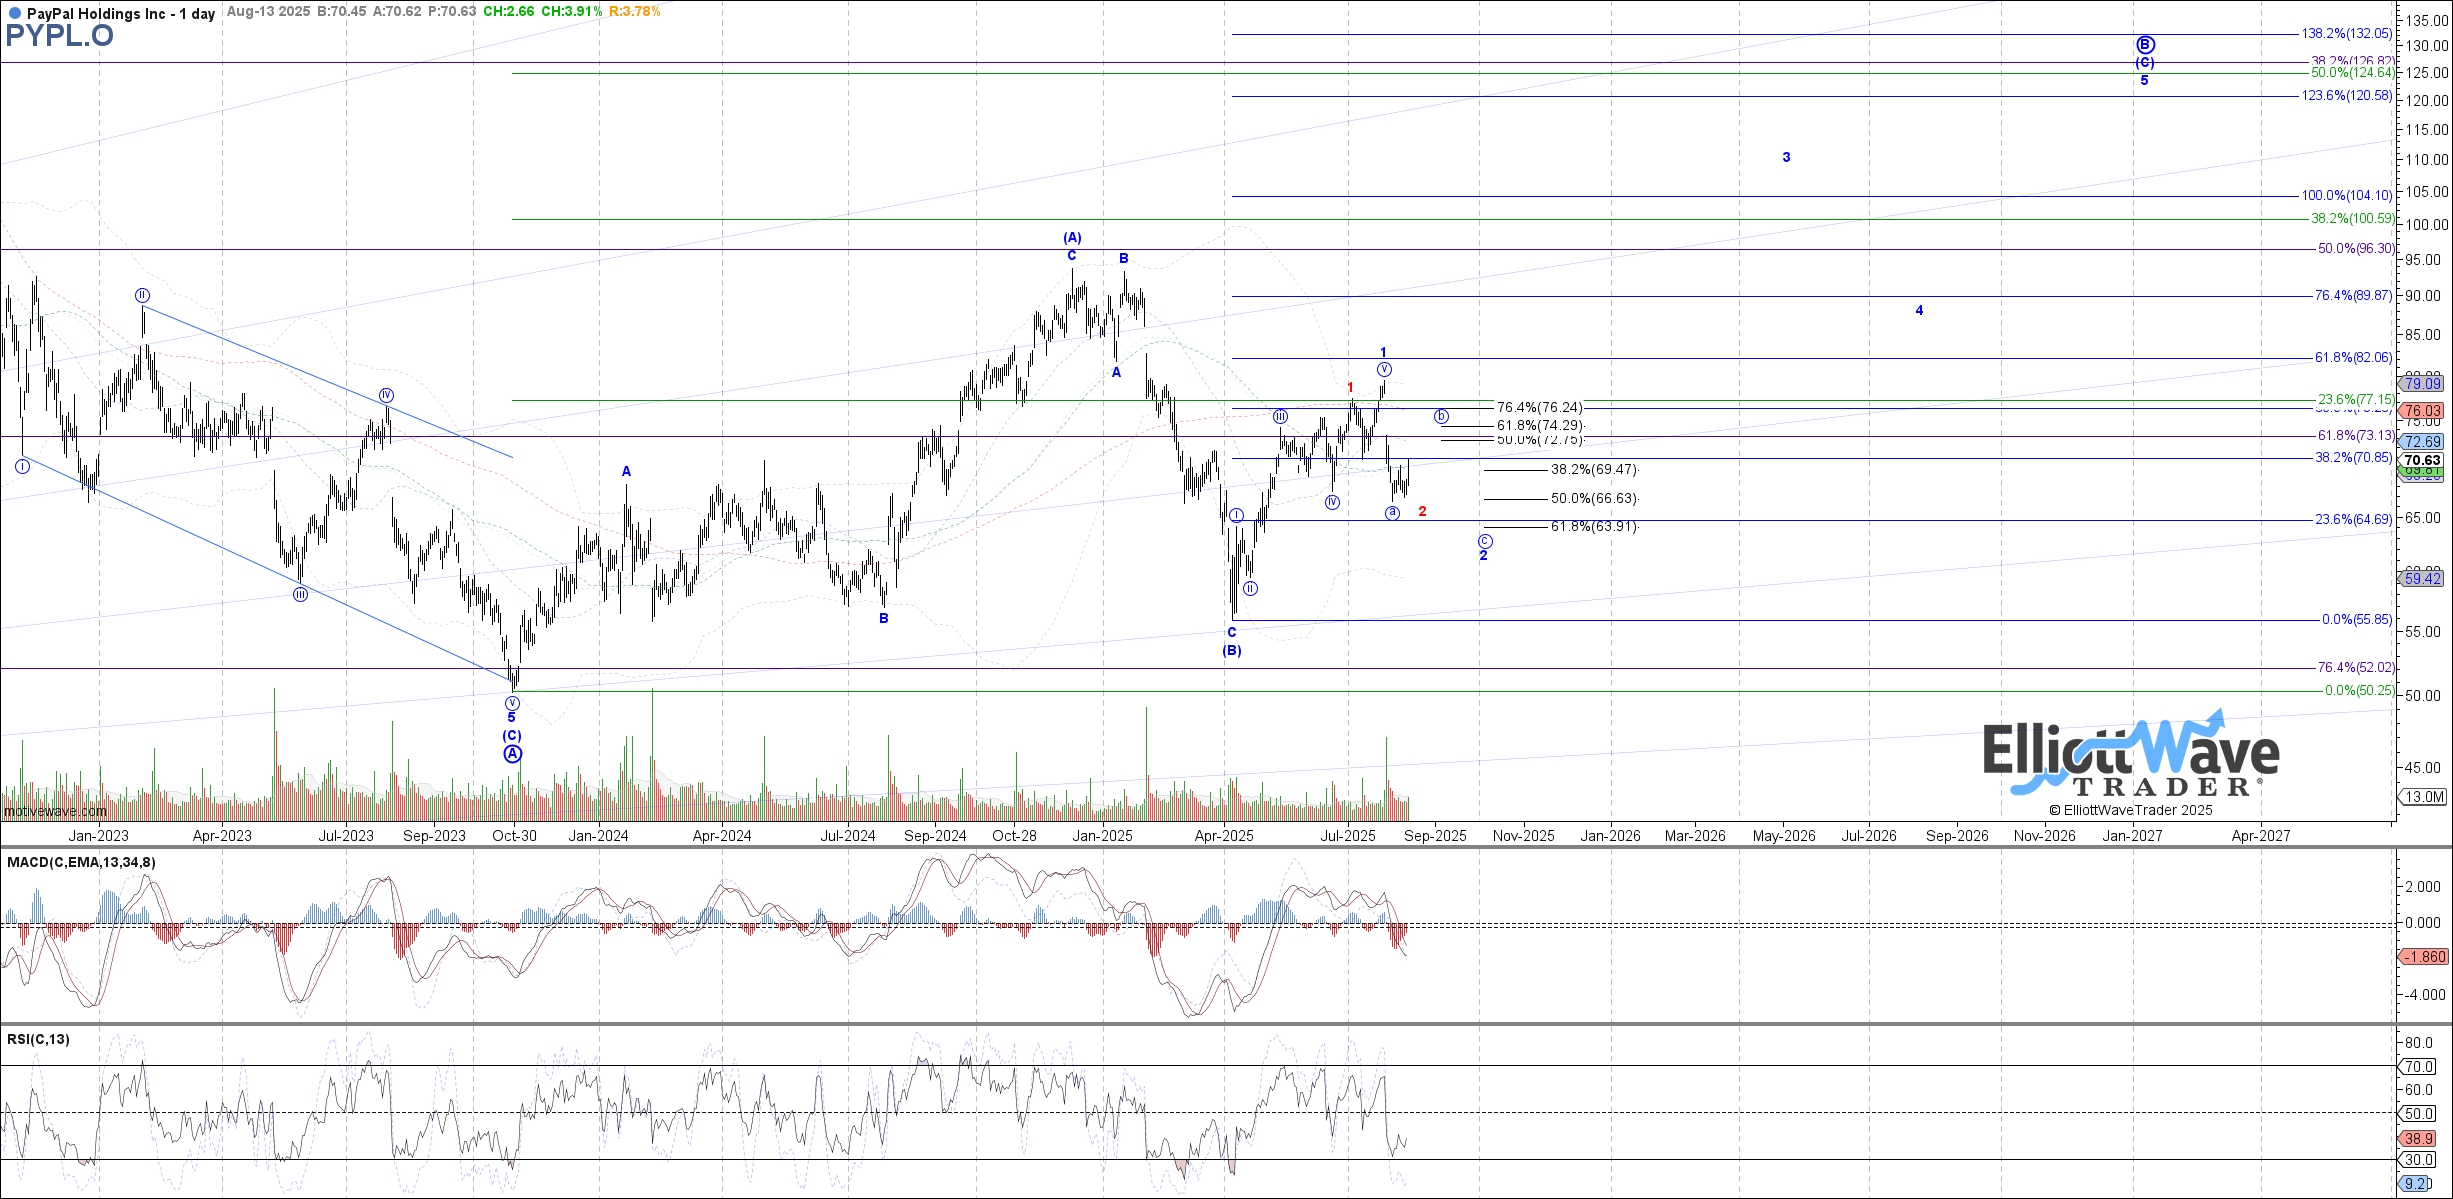
Regarding the PYPL chart, we can see the low struck back in April is counted as a ‘B’ wave. Since ‘C’ naturally follows ‘B’ and given that ‘C’ waves are 5 wave structures, we were on the lookout for the lesser degree wave ‘i’ of the larger ‘C’ waves anticipated.
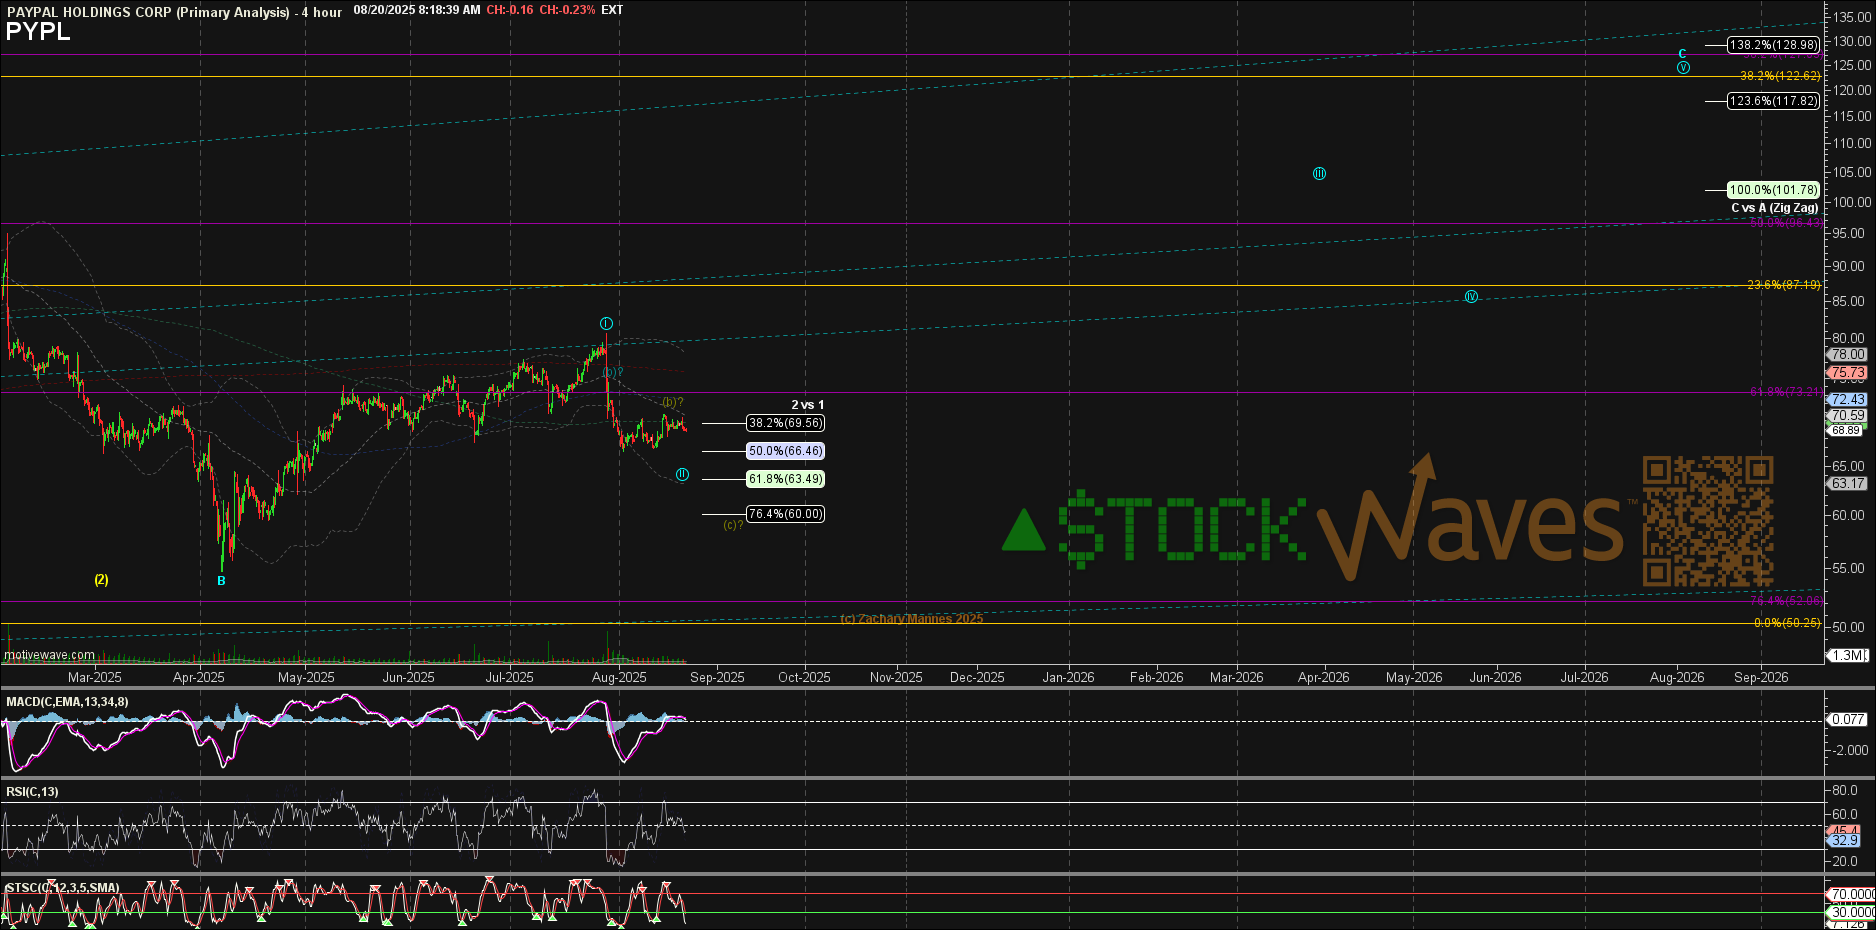
Price obliged with 5 waves up from the ‘B’ and has since pulled back in corrective fashion in wave ‘ii’. Therefore we can determine our risk either at the .764 retracement at the $60 level, or even as deep as the ‘B’ wave which would give it more room should the pullback be deeper than standard.
In this case, our analysts have opted for the $60 level as invalidation of this bullish setup, for the time being. A third wave of five total is usually the strongest and can extend to above the $100 level in this scenario. This clearly defines the current risk versus reward and the probable outcome if the setup unfolds as expected.
Conclusion
Using Fibonacci Pinball, we can now track the likely turning points for PYPL as this bullish structure progresses. This is a forward-looking method, not something that explains what just took place.
Yes, there are nuances to the analysis. Once familiar with our methodology, our members discover a powerful ally on their side to provide guidance and risk management in their trading/investing. It takes a bit of time plus effort to learn about a new way of viewing the markets and the stocks that make them up.
We have an extensive Education library available at Elliott Wave Trader. In addition, we regularly teach this methodology through beginner and intermediate-level videos three times a week, where we demonstrate wave counts and in-depth analysis techniques. Give it a chance, and this methodology could completely transform the way you invest. More on that can be found here.
There are many ways to analyze and track stocks and the market. Some are more consistent than others. For us, this method has proved the most reliable and keeps us on the right side of the trade much more often than not. Nothing is perfect in this world, but for those looking to open their eyes to a new universe of trading and investing, why not consider exploring this further?
We encourage all to visit with us, engage in the discussion, ask questions regarding this method. Many arrive as skeptics and stay as regular users of this utility. See for yourself how we perform this analysis on a daily basis — you may just find what you have been searching for all along.
