Patterns Getting Quite Full
 By
By
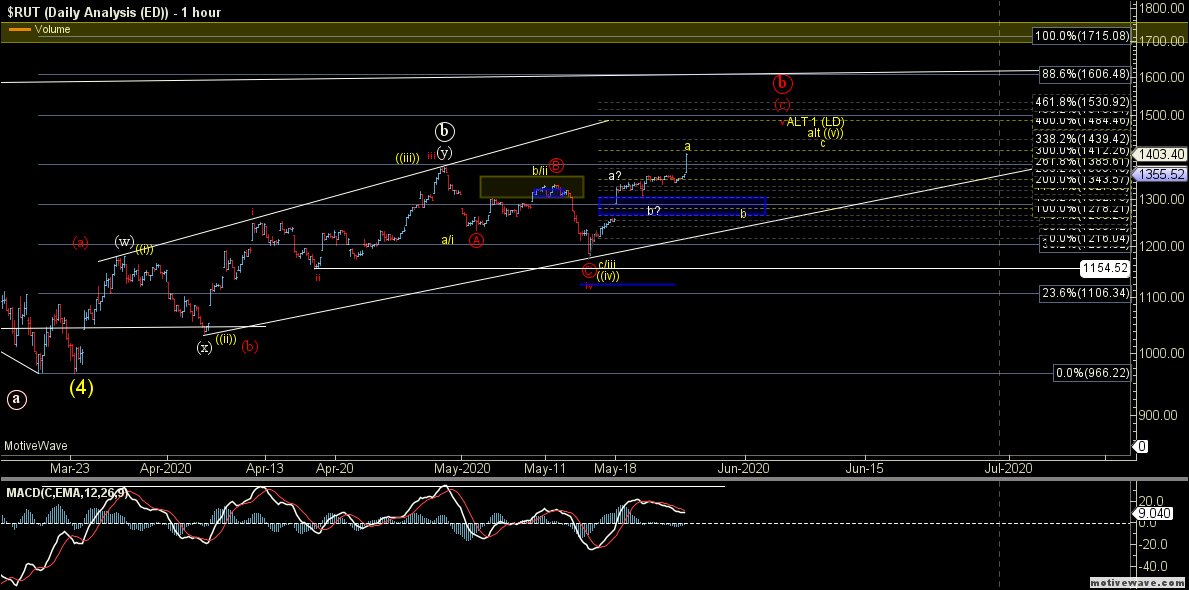
The Russell 2000 Index (RUT) has continued to extend higher this morning and has now broken back up over the April 29th high. We now technically have enough waves in place to consider all of the diagonal up off of the lows completed.
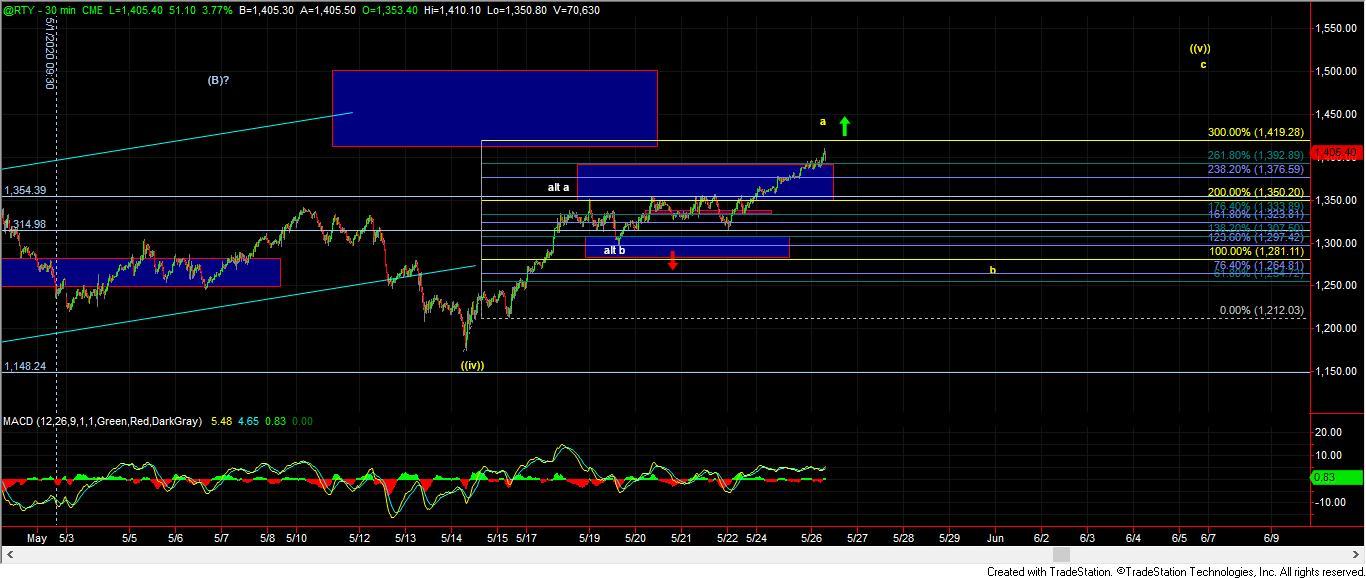
That said, given the way that the move has subdivided off of the May 18th low, I still prefer to count this as part of the wave a of the final move which I am showing in yellow on the charts. This would still suggest seeing a retrace for a wave b followed by another wave c up to complete the pattern.
Similarly, the Nasdaq 100, with the break higher, now has a full five-wave pattern up off of the May 14 low. We still do not have an initial signal of a top just yet, but this pattern is getting quite full as well on multiple timeframes.
So, as with the RUT, I am still also quite cautious to the upside on this chart as well. Support/pivot zone comes in at the 9346-9231 zone, so if we can hold that zone this still can push higher, but moving below that zone would certainly be the initial signal that this has indeed struck at least a local top.