Oracle: Is A Bearish Setup Around The Corner?
 By
Levi
By
Levi
By Levi at Elliott Wave Trader; Produced with Avi Gilburt
With increasing frequency, you’re going to hear “StarGate” and “hyperscaler” as well as other newly minted buzz words. While one may be able to form an investment thesis for the long term with these concepts, our information is telling us something different in the near term. First, we want to glean as much as we are able from Lyn Alden’s spectacular research and findings. Then, seek the synergy between what that is telling us and the structure of price on the chart. Dive in with us and find out why ORCL may be at an important and pivotal moment.
Lyn Alden Discusses The Fundamentals For Oracle
“Oracle is an interesting case of re-pricing. For a while the company was priced as a legacy provider, and was relatively cheap compared to its growth metrics. In recent years, it has been priced along many other profitable large-cap US growth companies, which means a higher valuation.
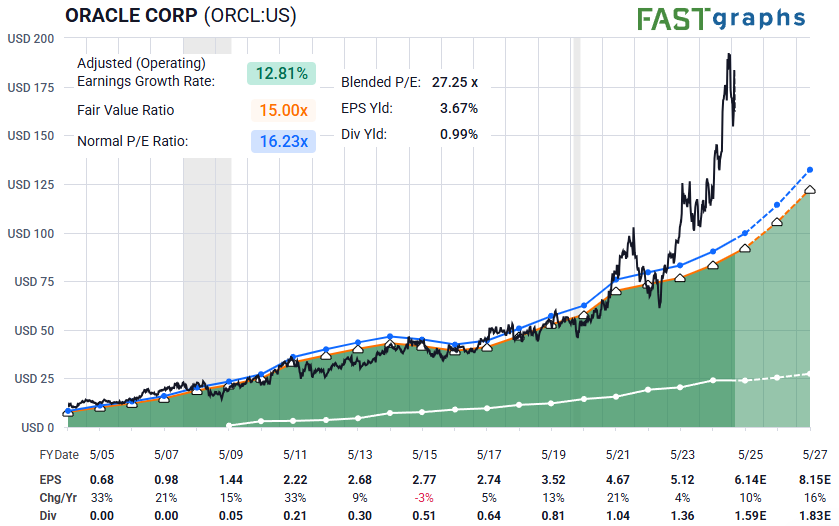
Many investors and analysts are now treating the company as one of the country's hyperscalers: cloud-oriented technical superpowers that are heavily tied to AI and other growth trends.
A 27x price/earnings ratio is not unreasonable, but it's on the high end of a typical norm relative to expected future growth rates. If the balance sheet were pristine, I would support that valuation, but the issue is that the balance sheet leaves something to be desired.
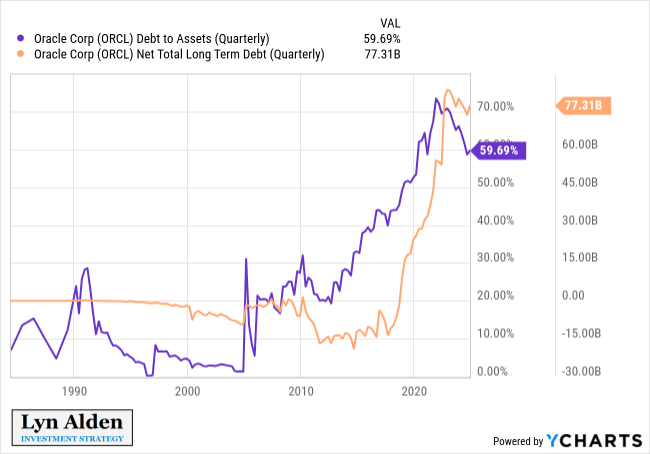
With a BBB credit rating and $77 billion in net debt (11 years worth of annual net income), their balance sheet is rather leveraged.
Overall, my view is pretty mixed on the fundamentals, with no strong view as a bull or bear. I would defer to technicals/sentiment on the stock, with a note of warning about the relatively high valuation for a company with this type of balance sheet.” - Lyn Alden
So, using these metrics via the current fundamental snapshot, we now marry these with what sentiment is telling us via the structure of price on the chart. What comes next may surprise some.
Let Sentiment Speak
For the purposes of this article, let’s assume that the reader has a basic understanding of our methodology. If not, take just a brief moment to briefly brush up on how we view the markets here:
“This Analysis Will Change The Way You Invest Forever - Part 1”
And, for those that don’t like homework, we’ll give you the Cliff Notes version - look for 5 waves up and 3 waves down in a bullish environment and the inverse for bearish. It truly is worth the momentary effort to comprehend before coming to a conclusion.
In any event, let’s get into what the chart is telling us here. Note how Garrett is viewing the structure at the daily time frame.
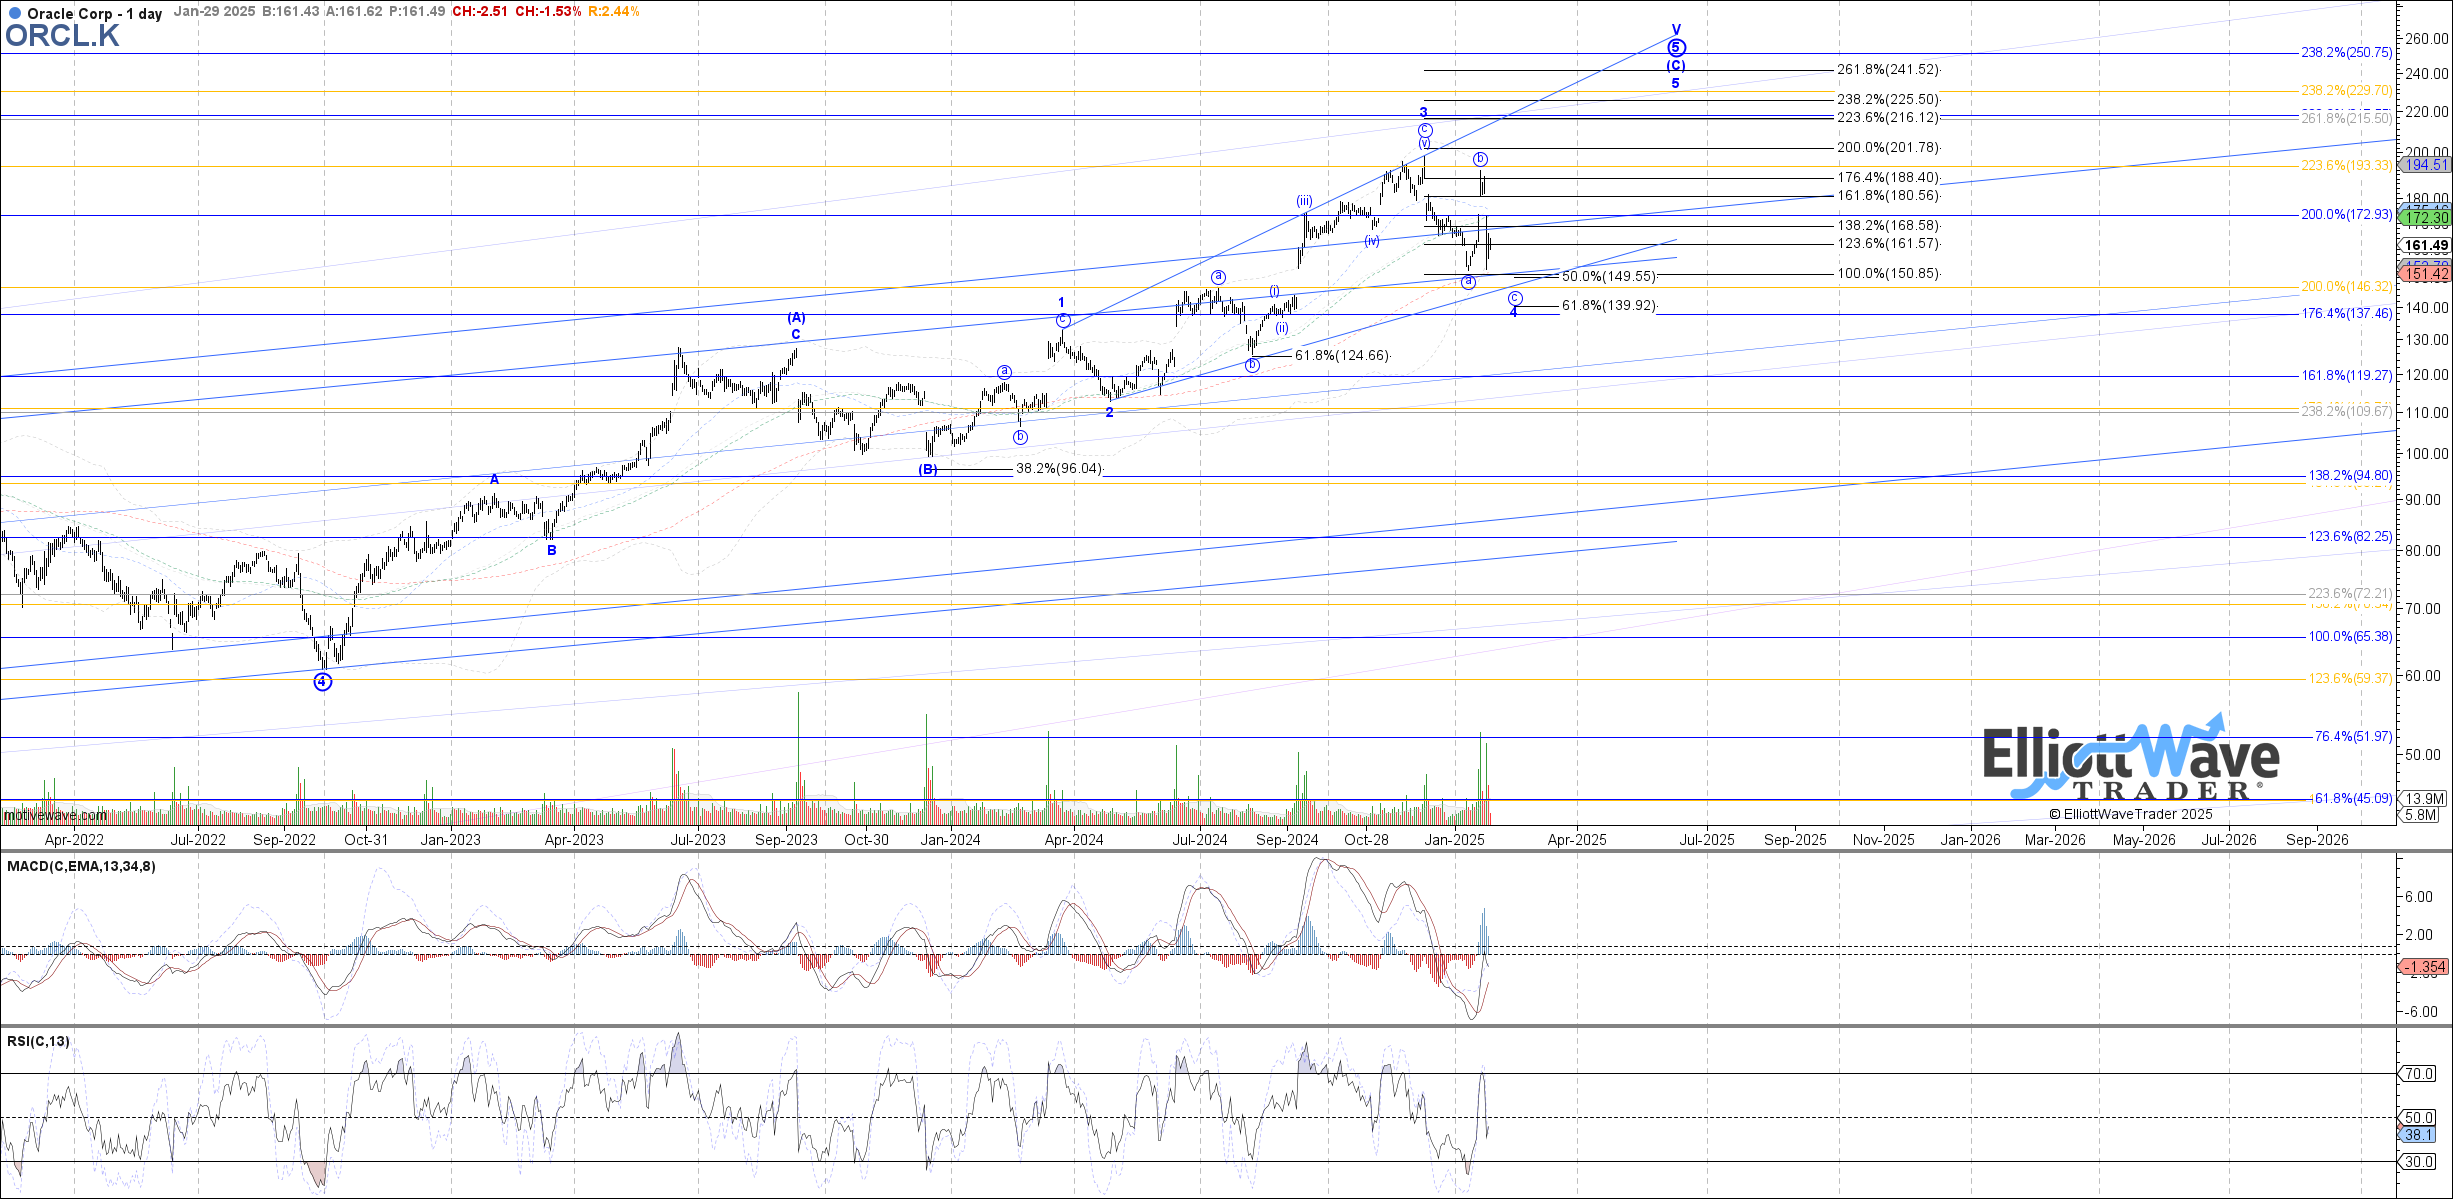
Most salient is the big blue stack at the upper right side of this current rally. What does the nomenclature mean? In rudimentary terms, several degrees, or intervals, of the structure are coming to fruition at one point.
Here’s one comparison: A year is divided into months, weeks, days, etc. Each week has days and each day even has hours, we could go on. This is quite similar to this number of degrees of a structure coming to a completion at once. It’s like a year ending and another year beginning.
In the case of (ORCL) though, when this structure completes we anticipate the resulting pullback and correction to take a great amount of time. The high struck next may be quite long-lasting in duration.
At the moment, we can place a ‘bullish’ rating for the purposes of this article. But that near term bullish setup comes with specific caveats. Price should really not close below the 140 level. And should it move below 124 instead, then the stock may have already found an important high. For now, though, given the current parameters, we can look for one more high to the 225 - 241 zone.
What Do Others Think Of This Analysis Method?
Many will argue with us regarding how we arrive at these targets and parameters. Some outright dismiss the methodology without even taking a minimum requisite time to understand. And, you know what? That’s OK.
Some simply will not allow themselves to see the markets through a probabilistic lens as we do. Granted, we will help others to learn our methodology, even those that begin begrudgingly. Many begin as skeptics.
In fact, there are literally thousands of readers and members that attest to the veracity and utility of this work. Avi Gilburt wrote a recent blog post that he shared with the readership. It is well worth the read. For your convenience, here it is:
“Insights From Investors And Money Managers All Around The World”
Does This Really Work? See The Results For Yourself
We will be the first to tell you the answer to that question: “Not always”. However, we have yet to find another analysis methodology that can provide context at any moment in time for the observed market/stock. Nor have we found another tool that can dynamically adapt in real-time to the markets as this does.
Over time with a large sample size of setups, you will come to appreciate the utility of this analysis method for your trading and investing. Of course not all setups are going to play out as illustrated. That is simply the nature of dynamic markets in action. This methodology will tell you when to shift your weight and when the scenario invalidates.
So, a setup can be wrong. The opinion of the analysts may need revision. It’s OK to be wrong - just don’t stay wrong. Does your current method tell you when to adjust your view? We should be students and observers of the emotions ever present in the markets. But we don’t benefit from becoming participants in this sentiment.
There is much more education available in the articles shared with the readership as well us a plethora of resources at your disposal in our Help Section. Yes, there are nuances to the analysis. Once familiar with our methodology, our members discover a powerful ally on their side to provide guidance and risk management in their trading/investing.
