One More High Or Not?
After striking a new all-time high last Monday, the market has provided us with the minimal number of waves to consider both the IWM and the SPX as having topped. However, as I have been noting for the last two weeks, the NQ still suggests that it has not completed its 5-wave structure, so we are left patiently waiting for another rally to complete or an invalidation of any further rallies.
I want to quote something I wrote to our members this past week:
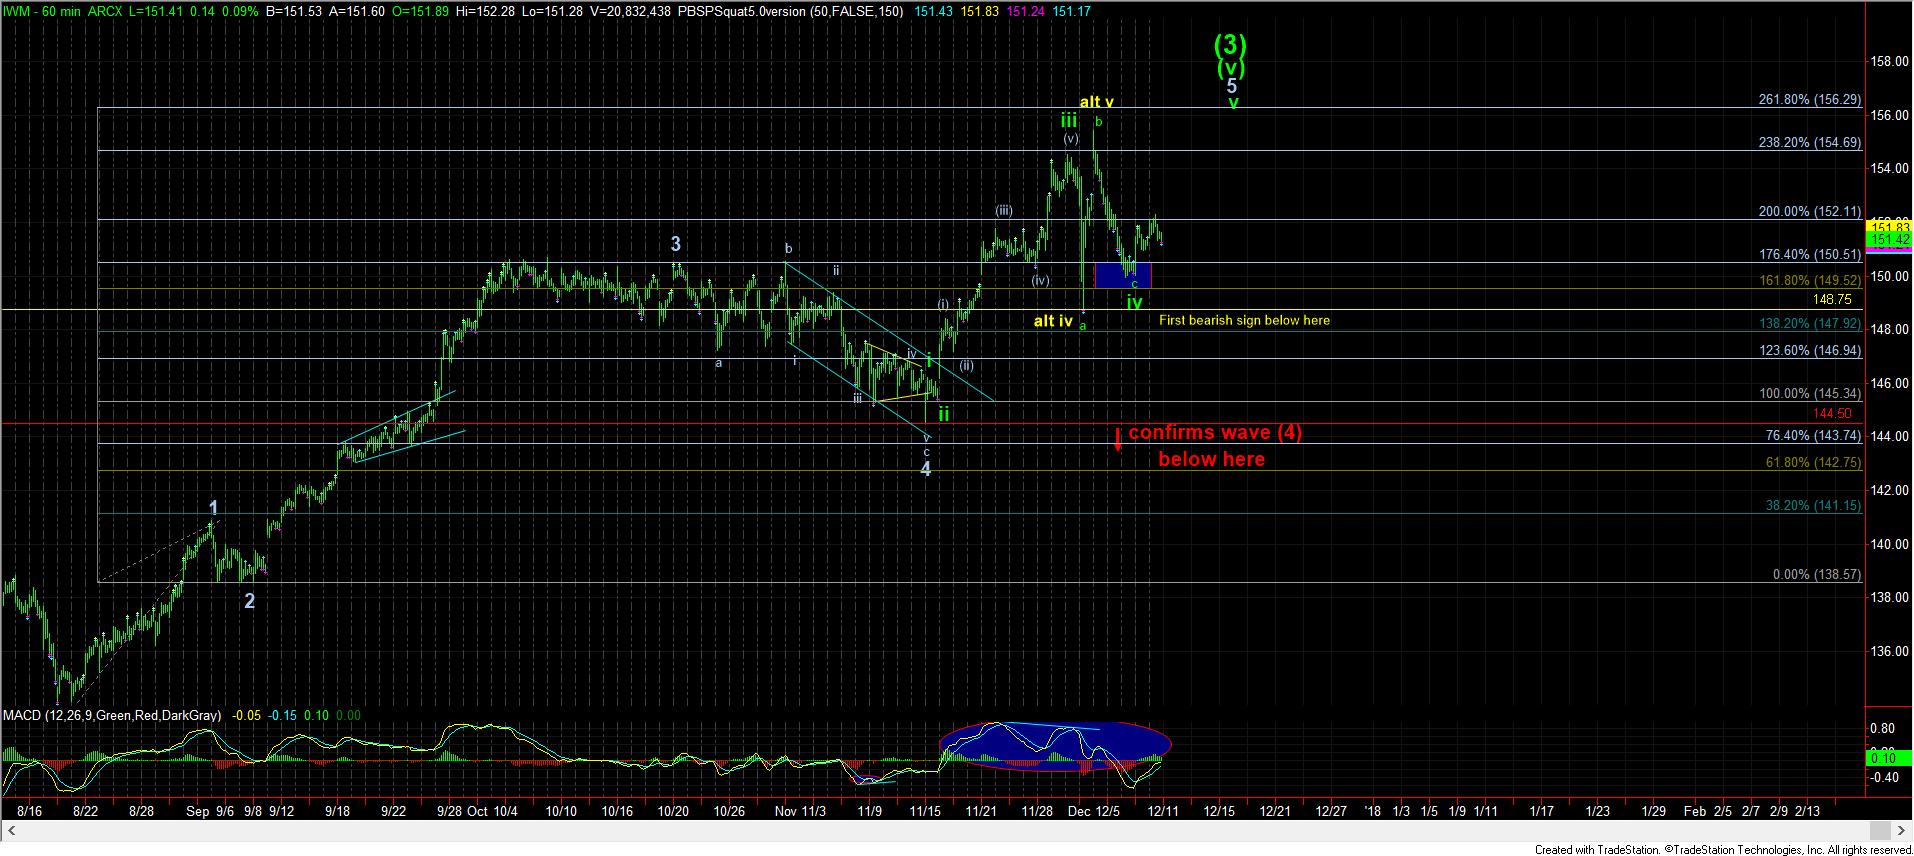
Back in early to mid-November, I had strongly reiterated that I cannot consider that the equity market has topped until we see a completed 5th wave up in the IWM. And, so, with the pullback just below the 145 region in the IWM, I went long for a trade, while looking towards the 152-156 region. To date, we have hit our target, with the high, thus far, being struck at the 155.41 level.
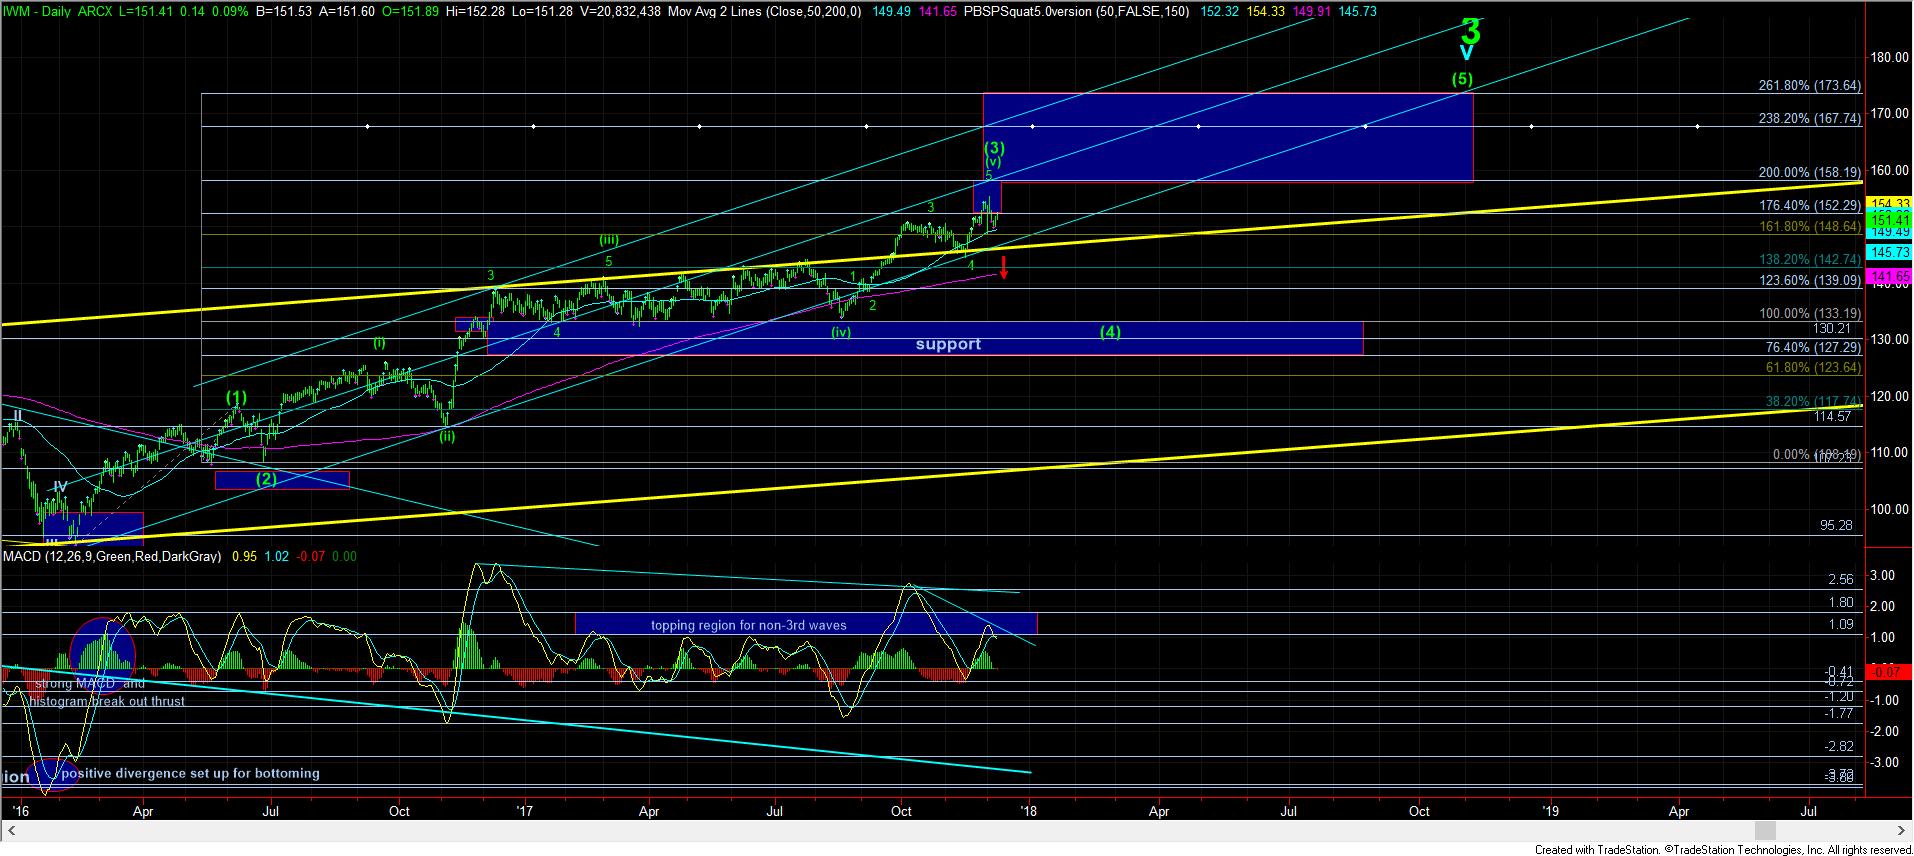
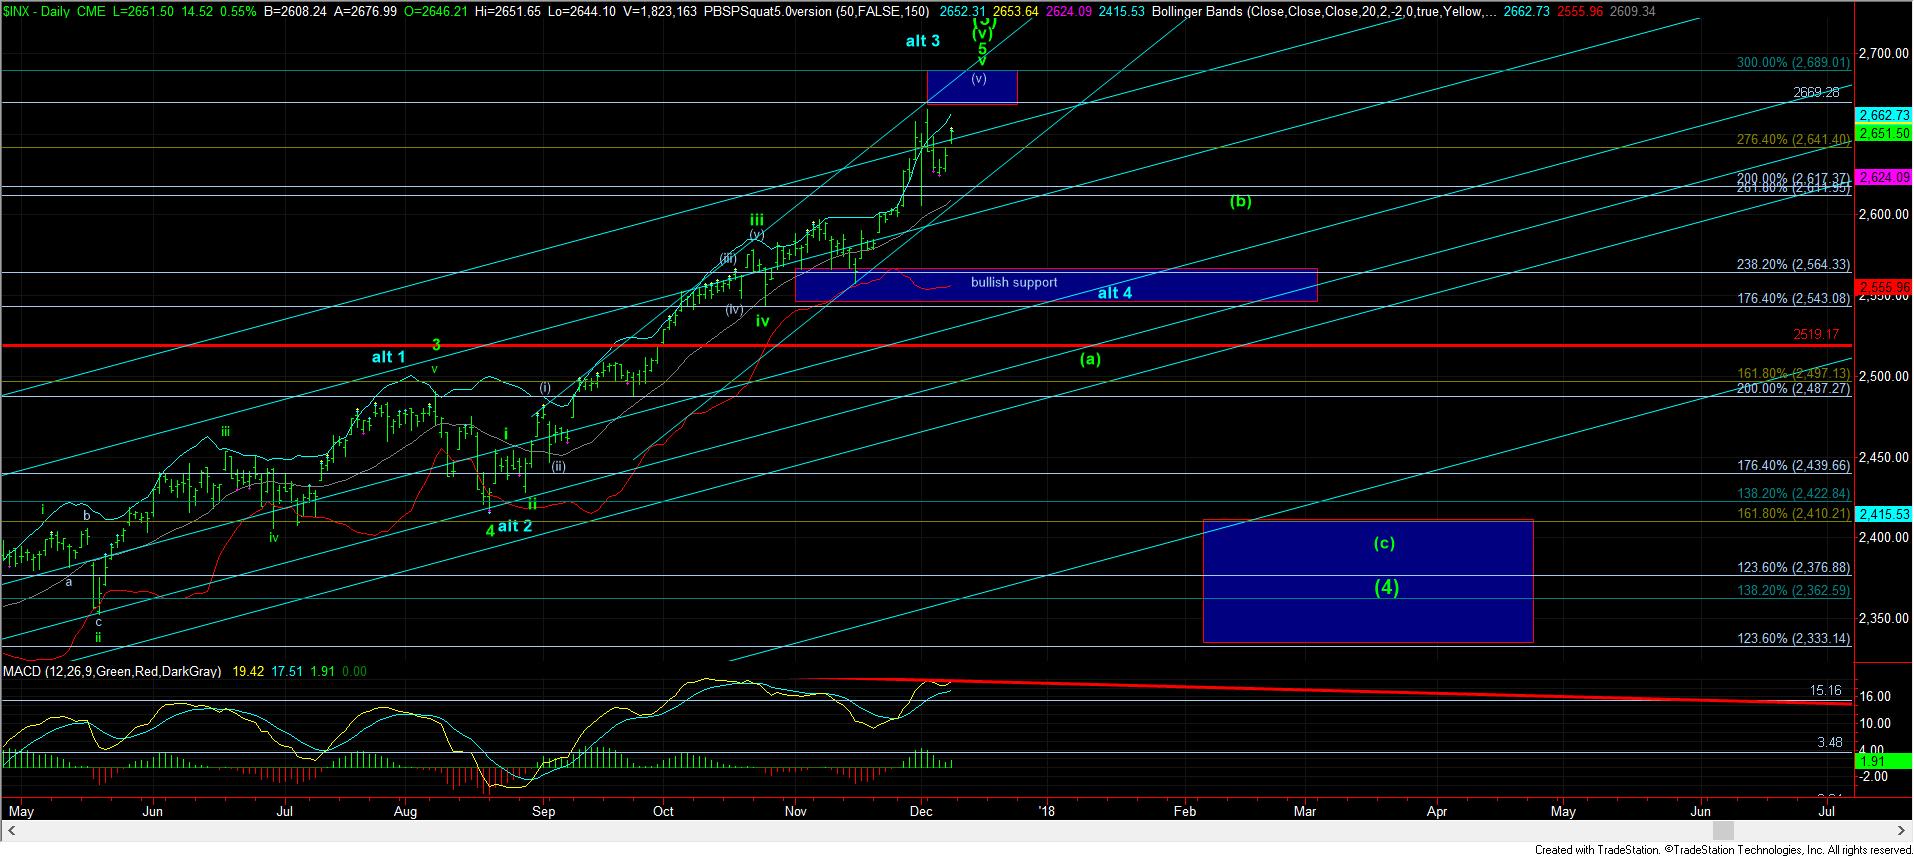
Therefore, if we take a step back, we must recognize the potential that we are close to completing (or have indeed completed) the 5 waves we expected in mid-November. Such a completed 5 wave structure would complete the entire wave (3) off the February 2016 lows, and suggests we should be on the lookout for a larger degree wave (4) in the coming months. That 4th wave is pointing us towards the 2400 region in SPX, and the 133 region in the IWM.
Additionally, if you take a look at the daily chart of the IWM, and notice the MACD, it has provided us with textbook indications supporting our Elliott Wave count. The wave 3 of (iii) clearly showed the most strength, whereas the wave 3 of (v) showed the first negative divergences of relative 3rd waves. That is a textbook indication of us being in a 5th wave in wave (3). Moreover, we are now seeing even further divergences on the daily MACD, which supports our perspective that we are LIKELY completing the 5th wave of wave (v) of (3). So, yes, the technical indicators are supporting our general wave count on the larger degree. While it does not mean that we have certainly topping in the micro structure up here, it is supporting the bigger perspective we present on the daily chart.
Now, there is a difference between having a potentially completed pattern, and confirmation that the bull market is now entering a larger degree pullback. As I have often warned, bull markets love to extend beyond standard targets. In fact, as I noted last weekend, we have exceeded the target we set for the SPX back in 2015 by approximately 2% at this time. And, the market has not yet proven that further extensions will not be seen.
While it certainly means that risks have clearly risen when we move through our standard targets, the market has to provide us with the signal that a larger degree pullback is in progress. And, with the NQ chart still looking incomplete, I think we have to be a bit more patient before we can expect a bigger pullback to take hold. So, it means I am still looking for one more rally to take place in the coming week or two before a top may be struck.
However, a break down in the IWM below 148.75 will make it much more likely that the high struck earlier this week did mark the top of the 5th wave in the IWM. So, it means that, even though I am still looking for one more potential rally, I am going to be very cautious about trading further upside because there is a good chance the IWM has completed it pattern at its last high earlier this past week.
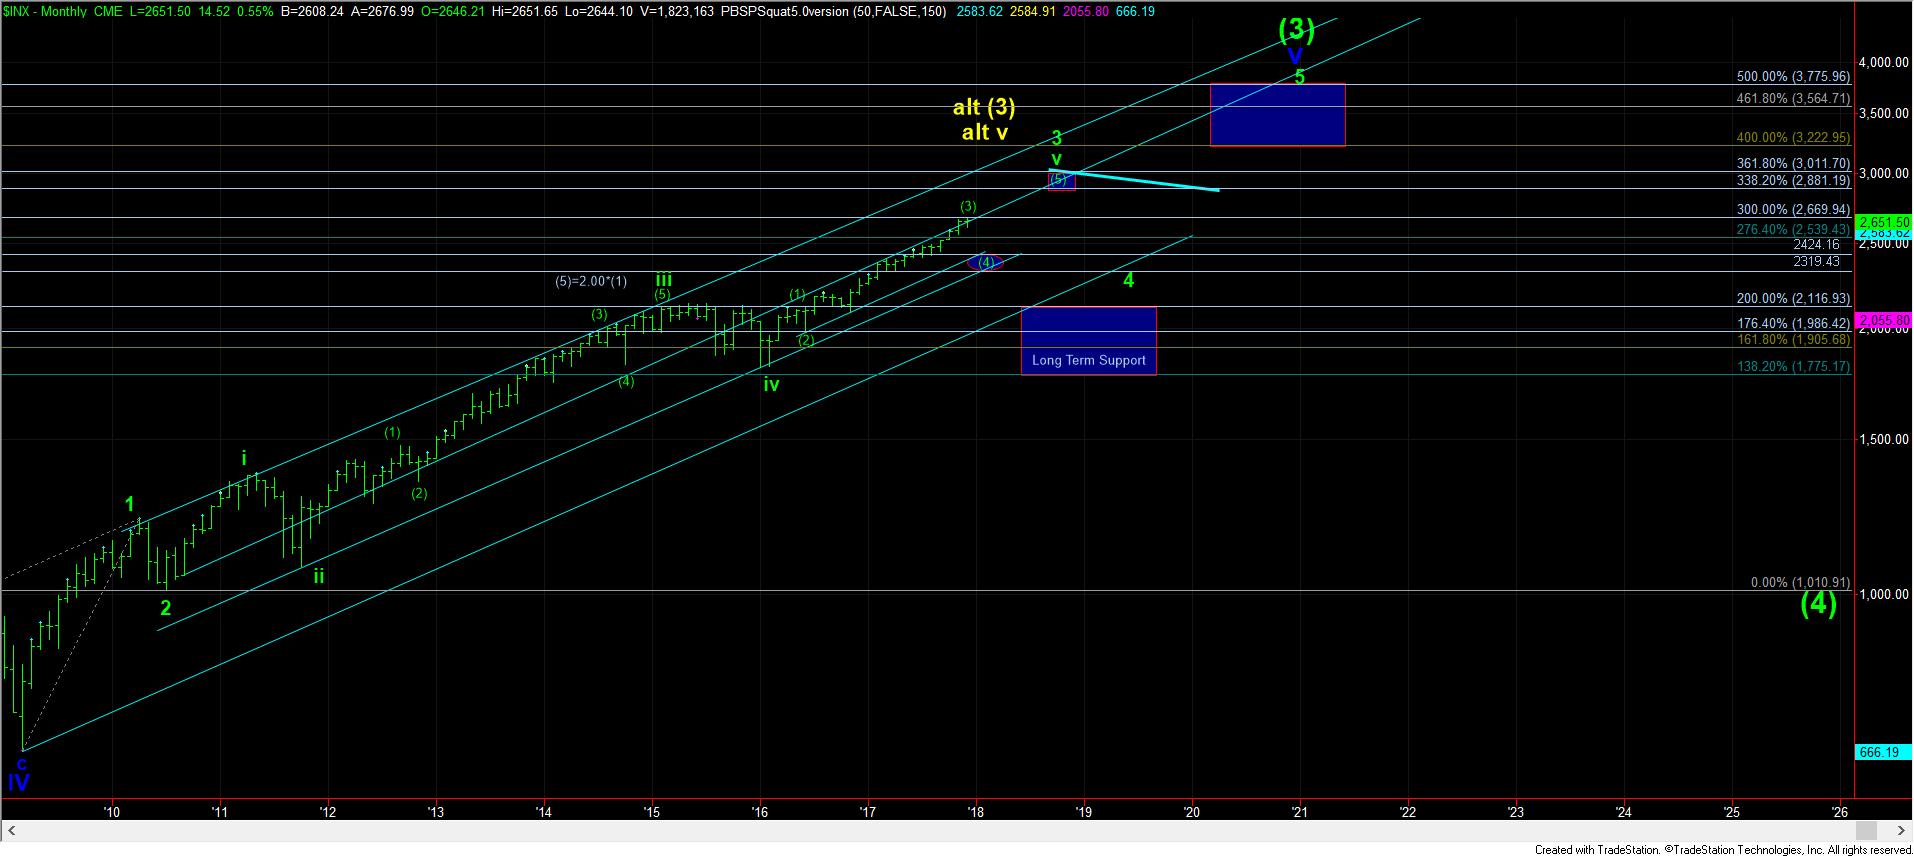
Lastly, I want to remind you that, even though I am expecting a larger degree pullback to begin in the not too distant future, this pullback will simply set up the next larger rally phase towards the 2800-3000 target region in 2018.