One Last Push?
I am putting the SPX weekend update out early so you can plan due to the treacherous posture with which the market has now presented us this week.
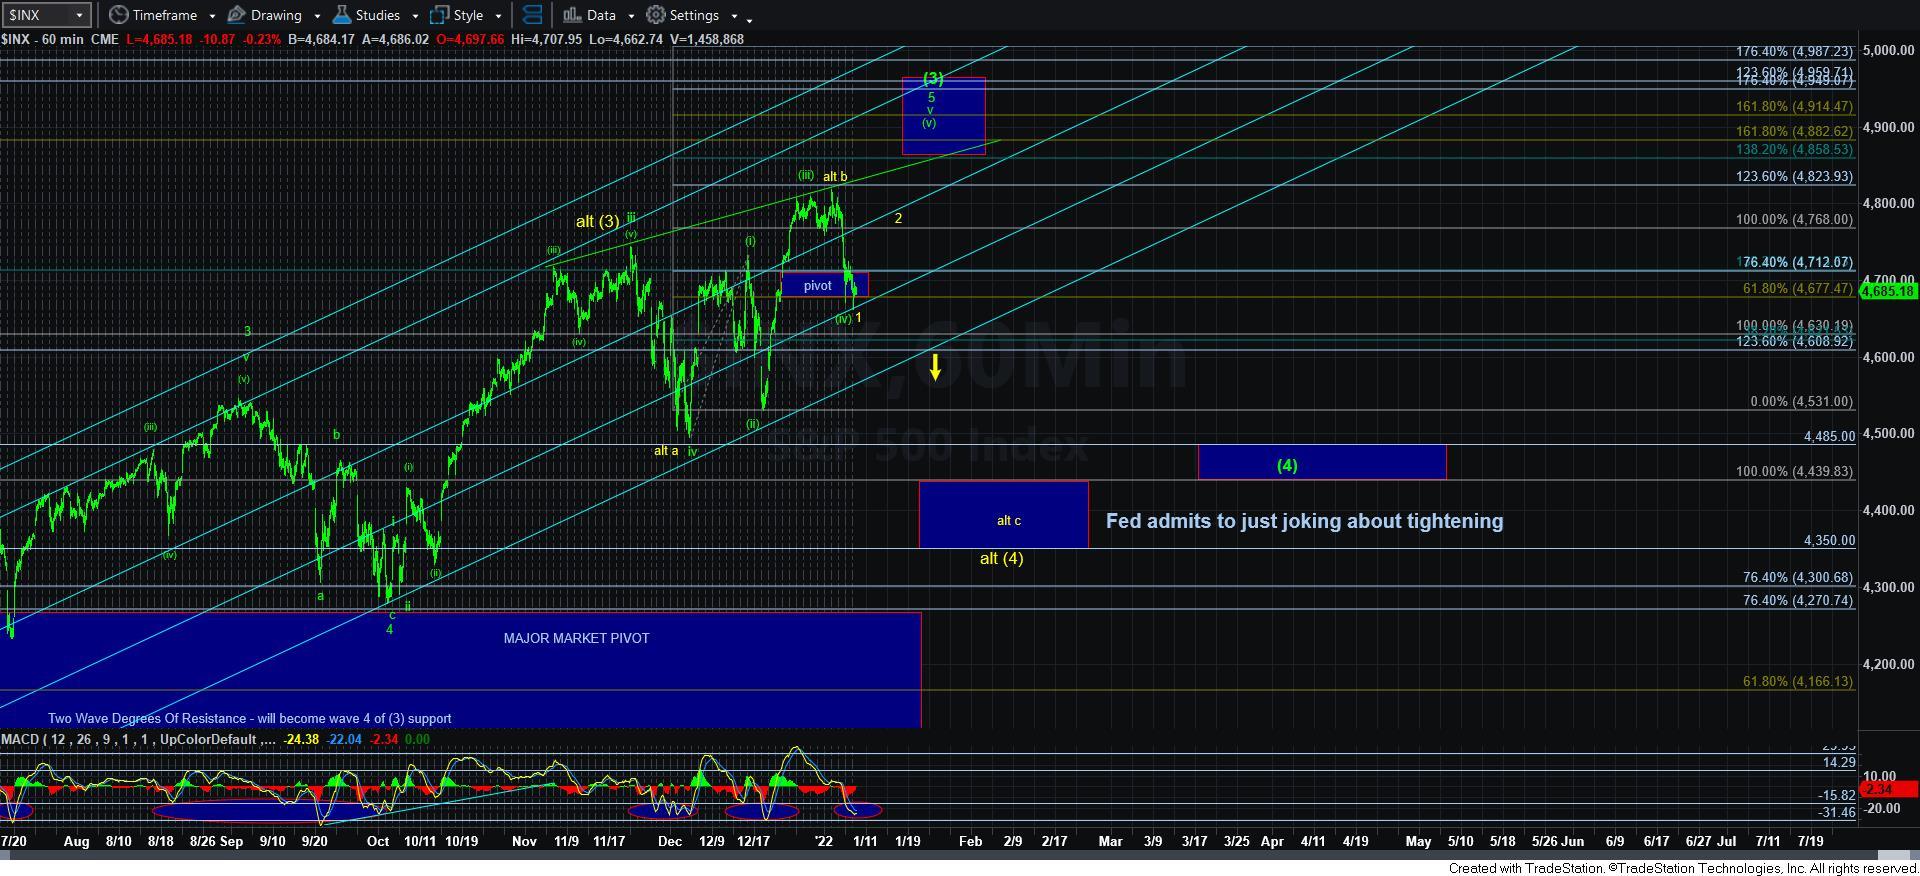
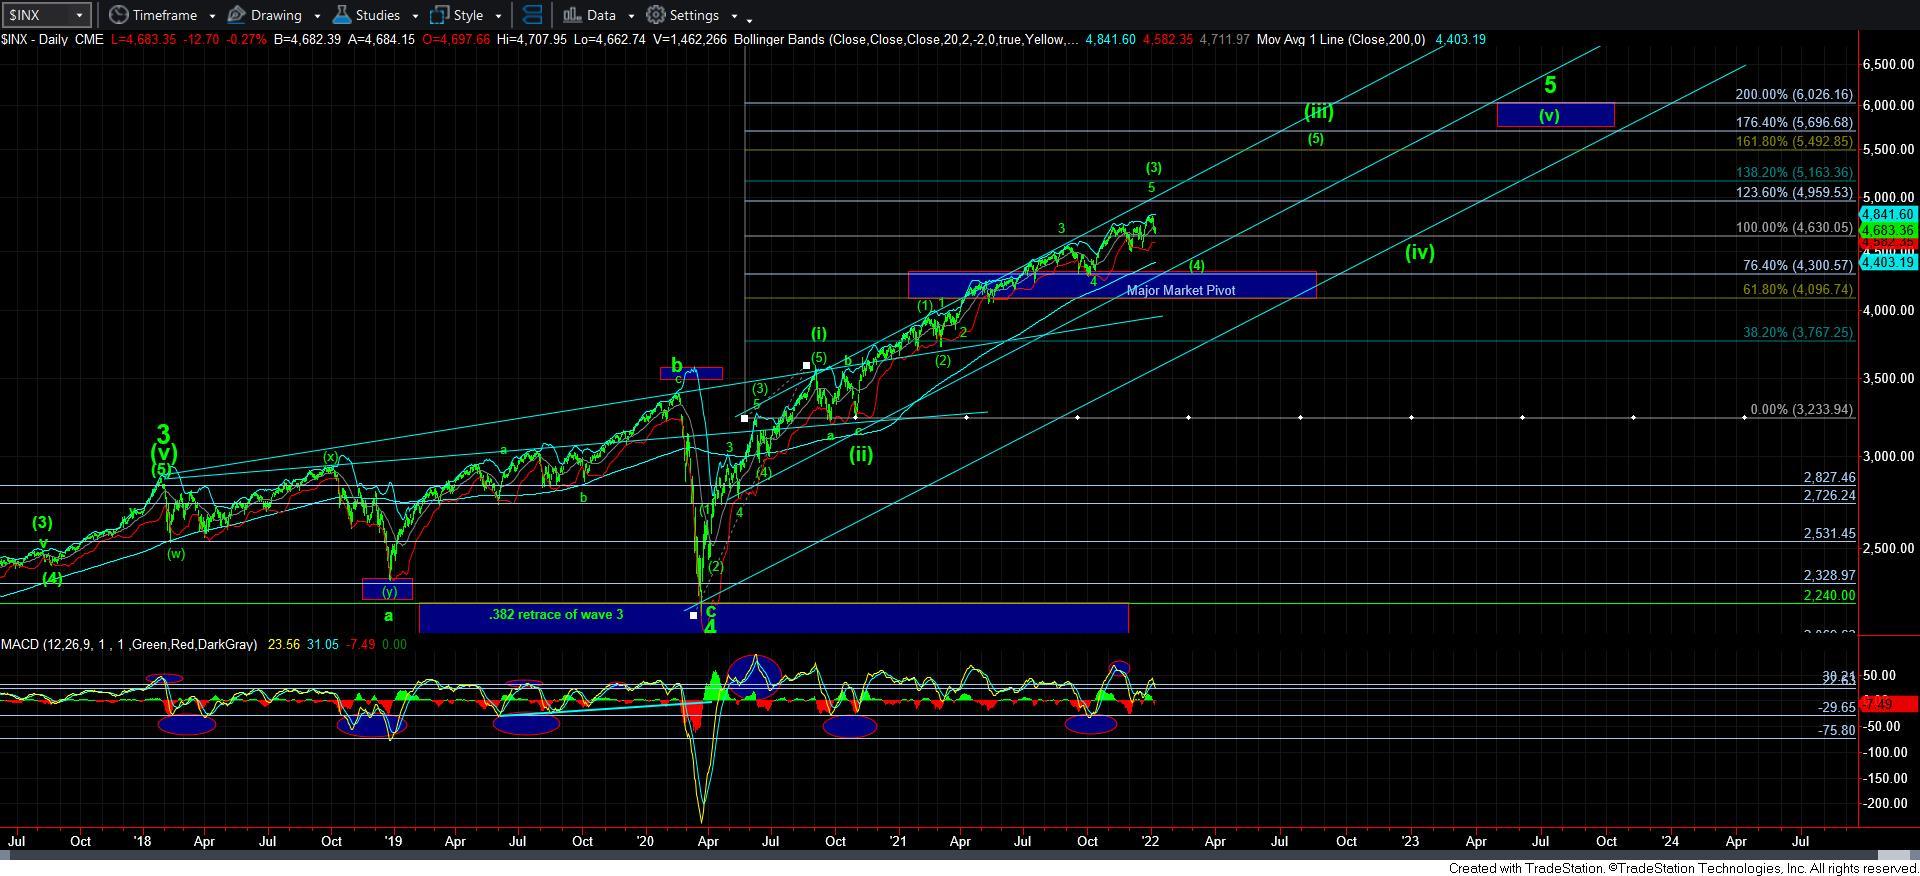
With the market breaking down our ideal support region this past week, it tells me that risks have certainly risen. I think it is no surprise to anyone reading my analysis that I am looking for a return to the 4400SPX region sometime in the first quarter of 2022 to complete wave [4] of [iii] off the March 2020 lows (which can be seen on the daily chart). And, the question has been where wave [3] of [iii] will top.
If you have been following my Fibonacci Pinball analysis, you would know that my target for wave [3] has been 4882SPX-4960SPX. The 4882 region represents the 1.618 extension of waves [1] and [2] within wave [iii] off the March 2020 low, and that is a typical target for wave [3]. The 4960SPX region represents the 1.236 extension of waves [i] and [ii] off the March 2020 low, and that is also a typical target for wave [3] of [iii]. At this point in time, we have struck a high of 4818SPX, so I still think we are a bit short of our ideal target for wave [3] of [iii] off the March 2020 low.
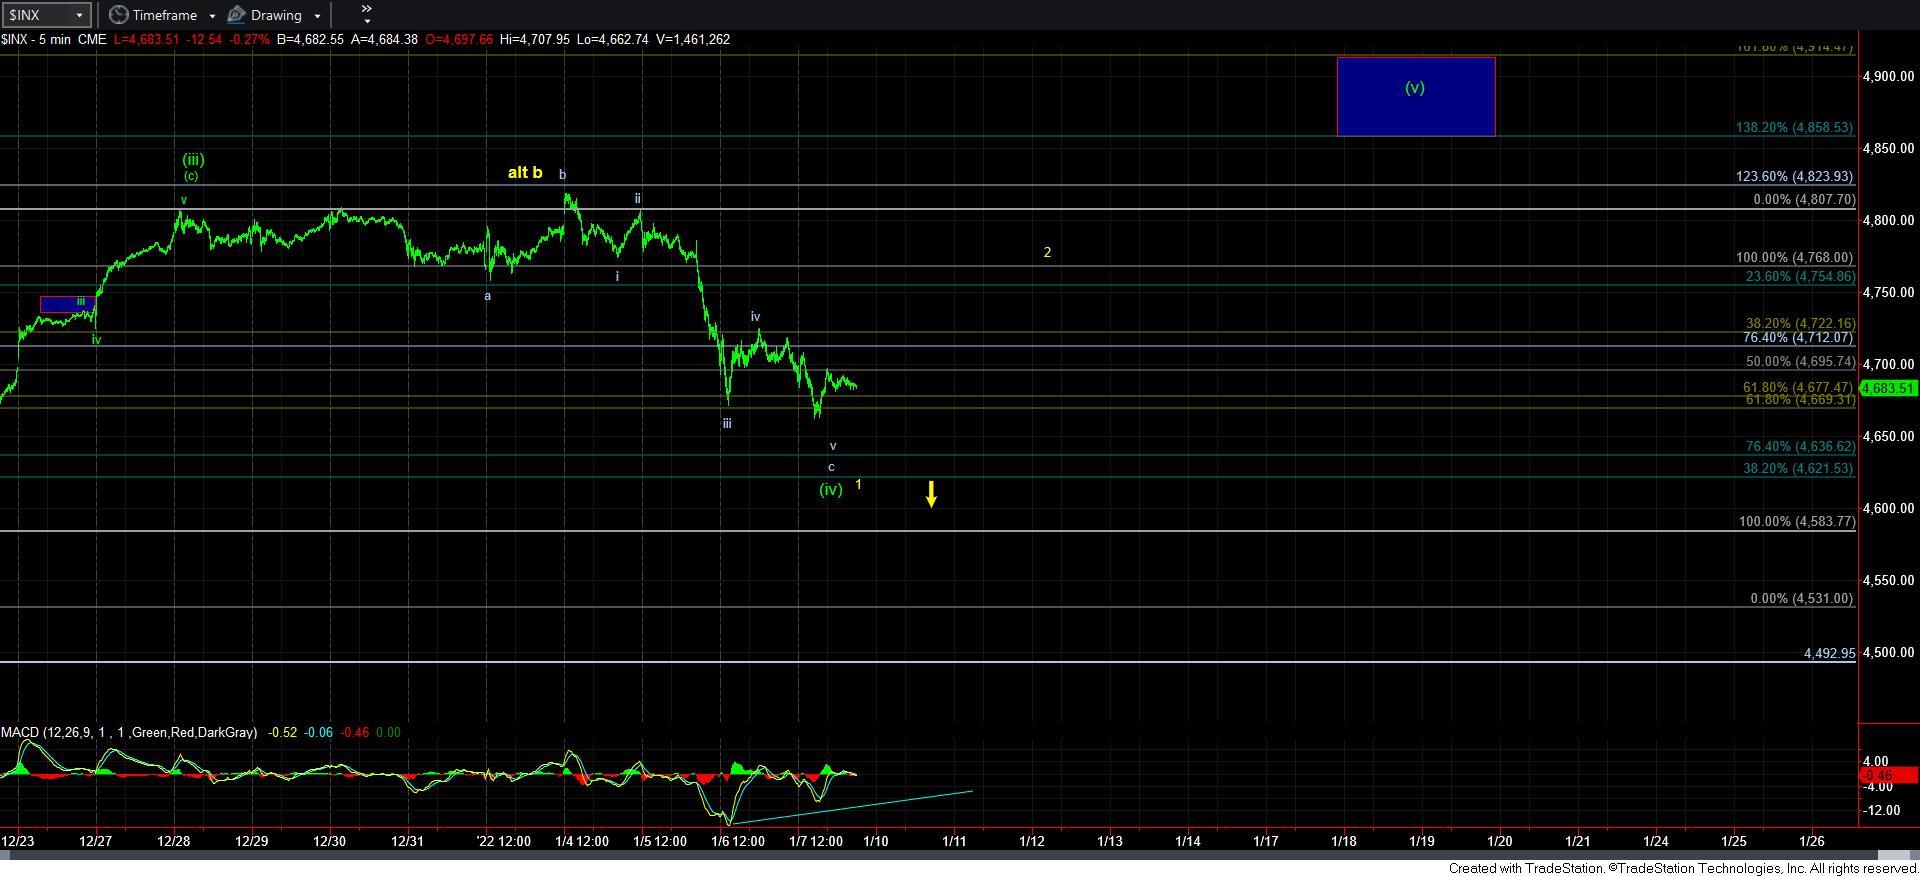
Up until this past week, I have been tracking a 5th wave extension that would have projected to the top of our target for wave [3]. But, with the market breaking down below our pivot, it tells us that the standard impulsive structure is not likely going to take shape. Therefore, I have adjusted to an ending diagonal for this last 5-wave structure to take us to our target.
There are a number of reasons as to why I am maintaining the green count pointing to a higher high as my primary count. First, we have not struck our ideal target, and the market does reach those targets the great majority of the time.
Second, with the market topping out this past week at the 1.236 extension of waves [i] and [ii] of the rally off the early December low, that is a much more common target for a wave [iii] within a diagonal, as compared to a b-wave, which is our alternative count. Rather, b-waves often top at the 1.00 or 1.382 extension within their [a][b][c] structures. While this may seem like a minute point, it is a nuance that has helped me many times in the past.
Third, with the 60-minute MACD again hitting the floor of its support region, this has almost always portended a very strong and sizeable rally taking shape. The last two times the market dropped this deep into the MACD support region over the last few months we saw rallies that were almost vertical in nature of over 200 points. And, I am counting those rallies as waves [i] and [iii] within this diagonal.
While there are several other reasons, I will simply add a fourth reason being that Luke Millers Bayesian analysis, which has been outstanding this past year, has the probability of that higher high at 61%. While that clearly does not consider a higher high as a slam dunk, I think taken with all the other factors certainly make it a better probability than most believe at this time.
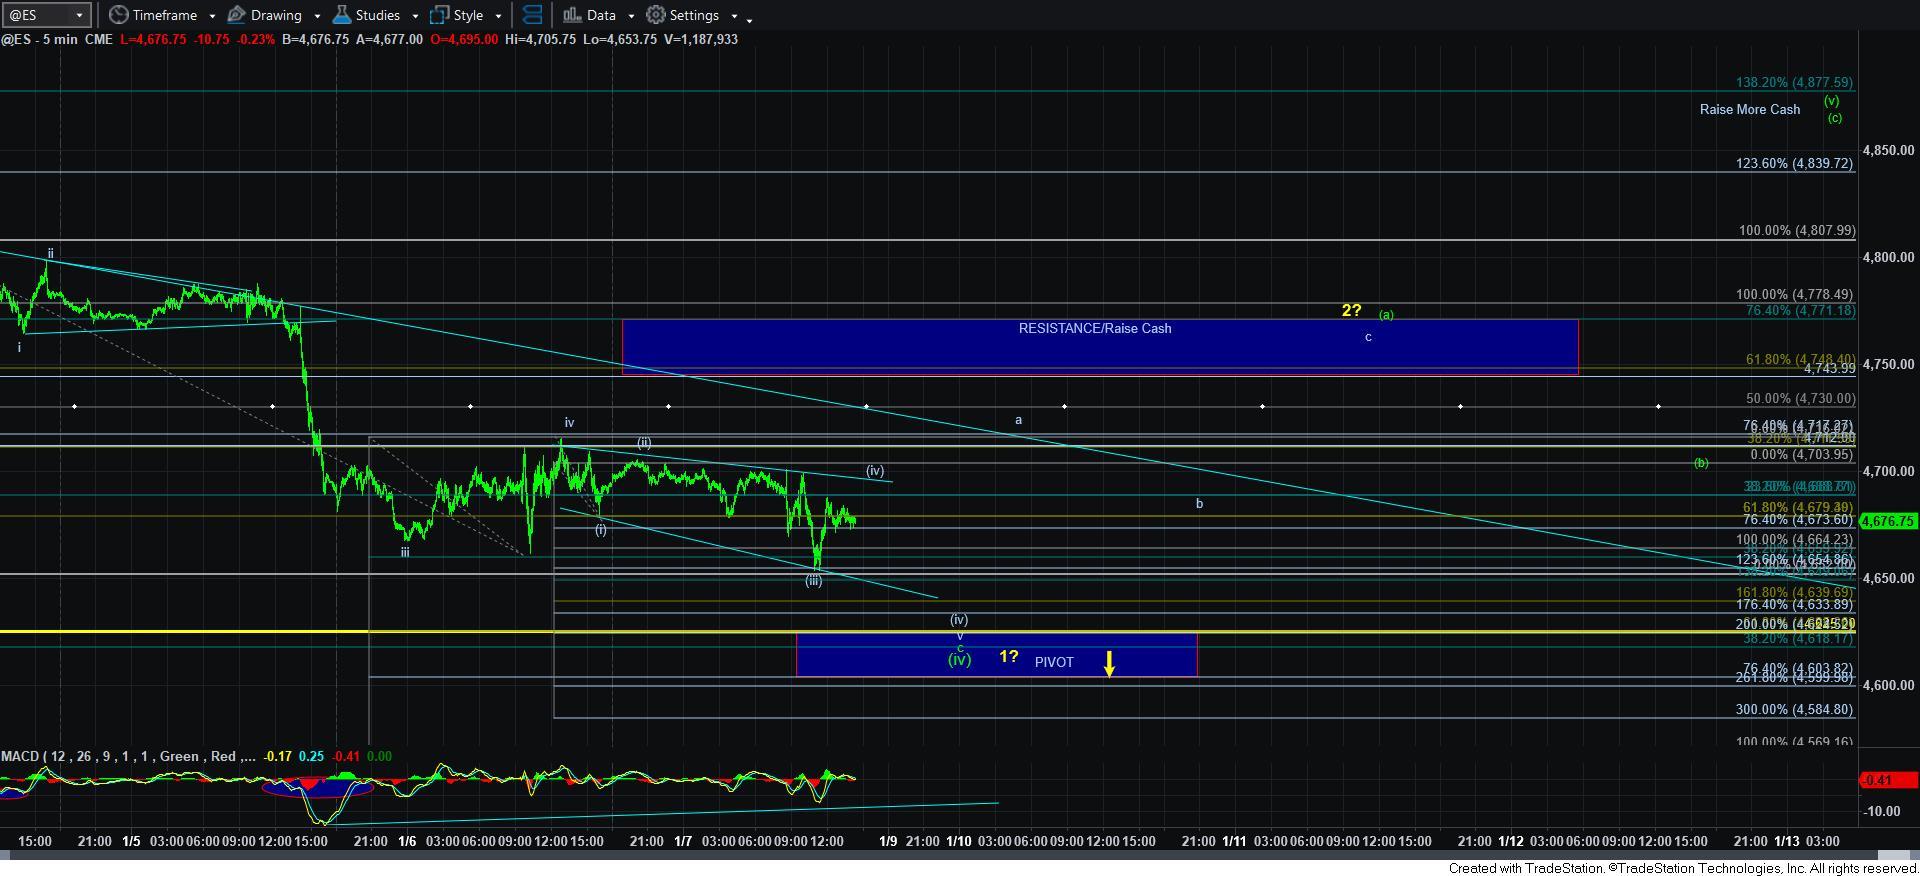
So, let’s address our parameters. With the market breaking down to lower lows on Friday, I am counting this as a 5th wave in a c-wave off the highs, which would complete wave [iv] in the diagonal. My alternative count views this as a 5th wave in wave 1 down in the yellow c-wave. What they both have in common is the exact same support. You see, a 5th wave does not usually exceed .618 the size of waves 1-3. That places a floor to the market in the 4625ES region, which is approximately 4635SPX. And, as long as the market respects that support, I am going to be looking for a rally to begin next week.
But, that rally will not be easy to trade. You see, even in the scenario that we see a higher high, that rally will be an a-b-c structure, since all waves within a diagonal are 3-wave structures. And, since a wave 2 is also a 3-wave structure, the only way we will be able to distinguish between the diagonal to a higher high or a wave 2 top in yellow is after the initial a-b-c rally concludes. That conclusion will either be wave 2 in yellow, or the [a] wave of wave [v] in the ending diagonal. The only way we will be able to tell the difference is based upon how the market drops thereafter. If the drop from that high is corrective in nature, then it means we are pulling back in a [b] wave, and setting up a [c] wave rally to a higher high. However, if that drop is clearly impulsive, then it likely signals that it is completing wave i of 3 down in the yellow count, and we will have to prepare for a 3rd wave down towards 4400SPX sooner rather than later.
The other potentiality that must remain on our radar is a direct drop in the 3rd wave of the c-wave in yellow. While I see this as a lesser likely outcome based upon all the factors outlined above, I have to at least present to you where I will be forced to adopt this perspective. As I noted below, our floor is the 4625ES region. If the market were to break down below that region, and follow through below 4600ES, then it opens the door to us already being in wave 3 of the c-wave down in the yellow count, and we would be targeting the 4400SPX region box below. Again, I see this as the lesser likely outcome, but you must at least be aware of it since there is going to be a strong gravitational pull towards 4400SPX for wave [4].
It was due to this gravitational pull that I continued to warn about the risks in the 4800SPX region, as I was highlighting that the upside potential was maybe 100-150 points, whereas the downside potential was 300-400 points. And, I still have an expectation that we will likely return to the 4400SPX region to complete wave [4] before we begin wave [5] into the end of 2022, or early 2023 with an ideal target in the 5500SPX region.
In summary, we have a floor to the market in the 4625ES (4635SPX) region. As long as that floor holds as support, there are many factors suggesting we can see a sizeable rally. How that rally progresses in the coming week or two will tell us if we can see a higher high to complete the ending diagonal in the green count, or if we have to prepare for a 3rd wave decline to 4400SPX sooner rather than later. For now, my primary count is looking for the higher high in green. But, please recognize that any break down below 4625ES, which sees follow through below 4600ES will likely have me looking for 4400 sooner rather than later.