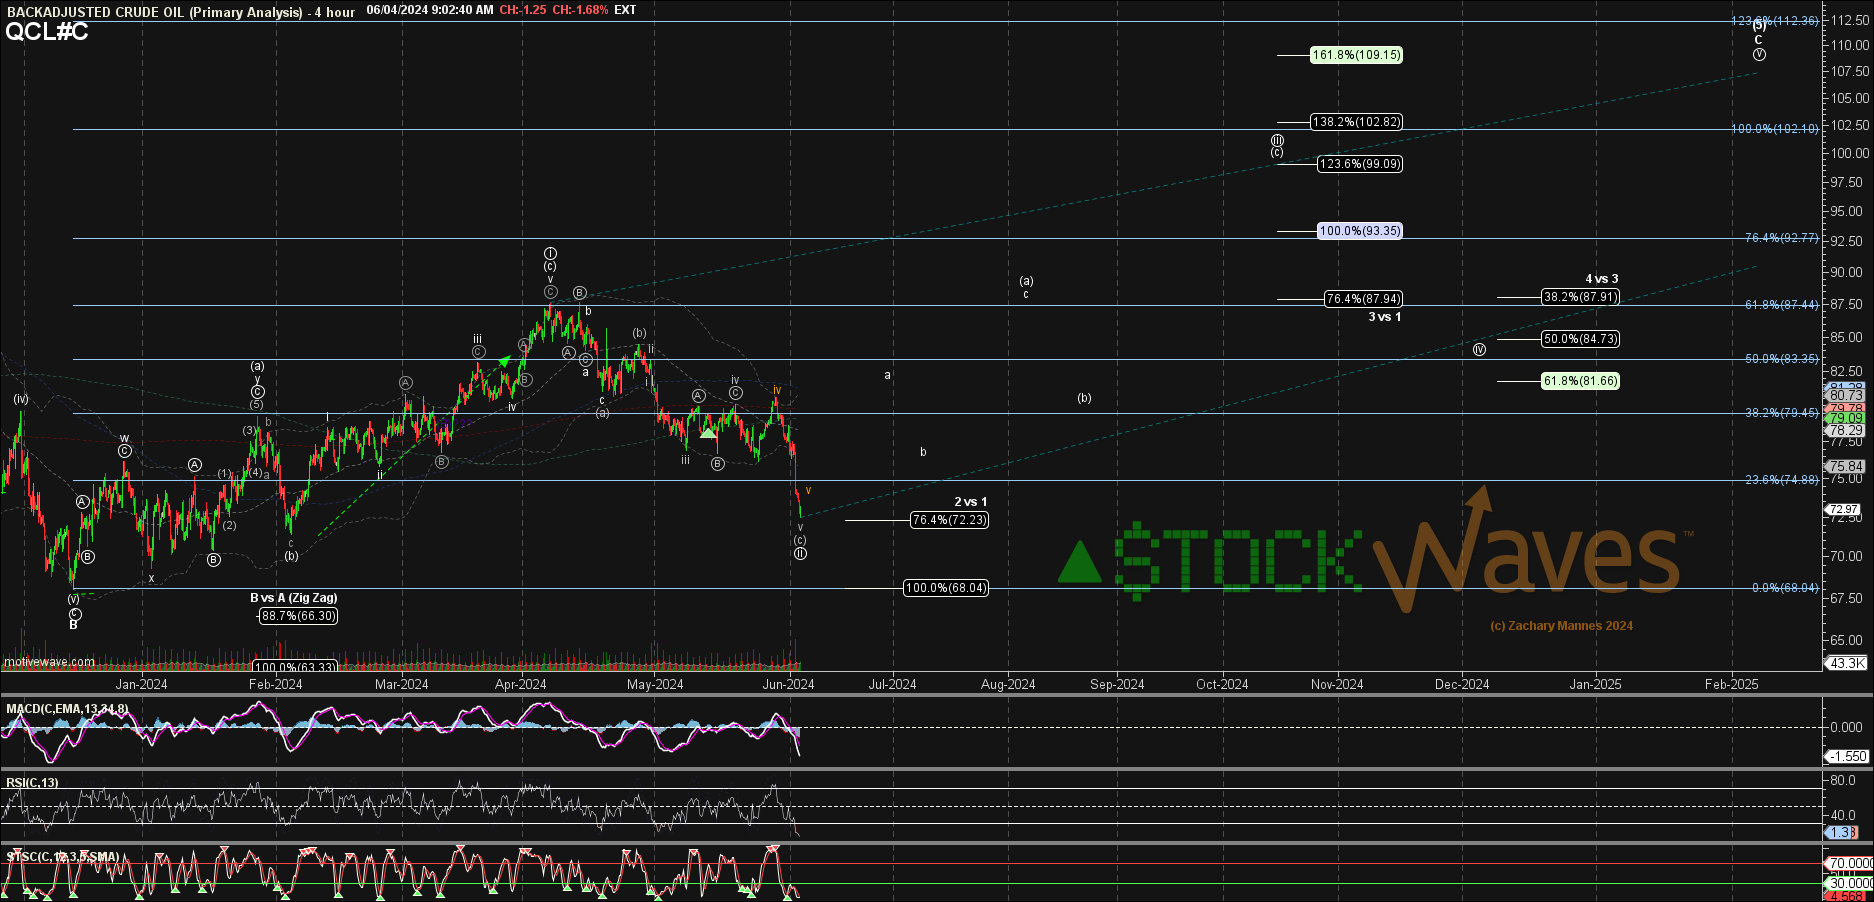
Oil now at the 76.4% Fib, is that less bullish?
 By
Zac Mannes
By
Zac Mannes
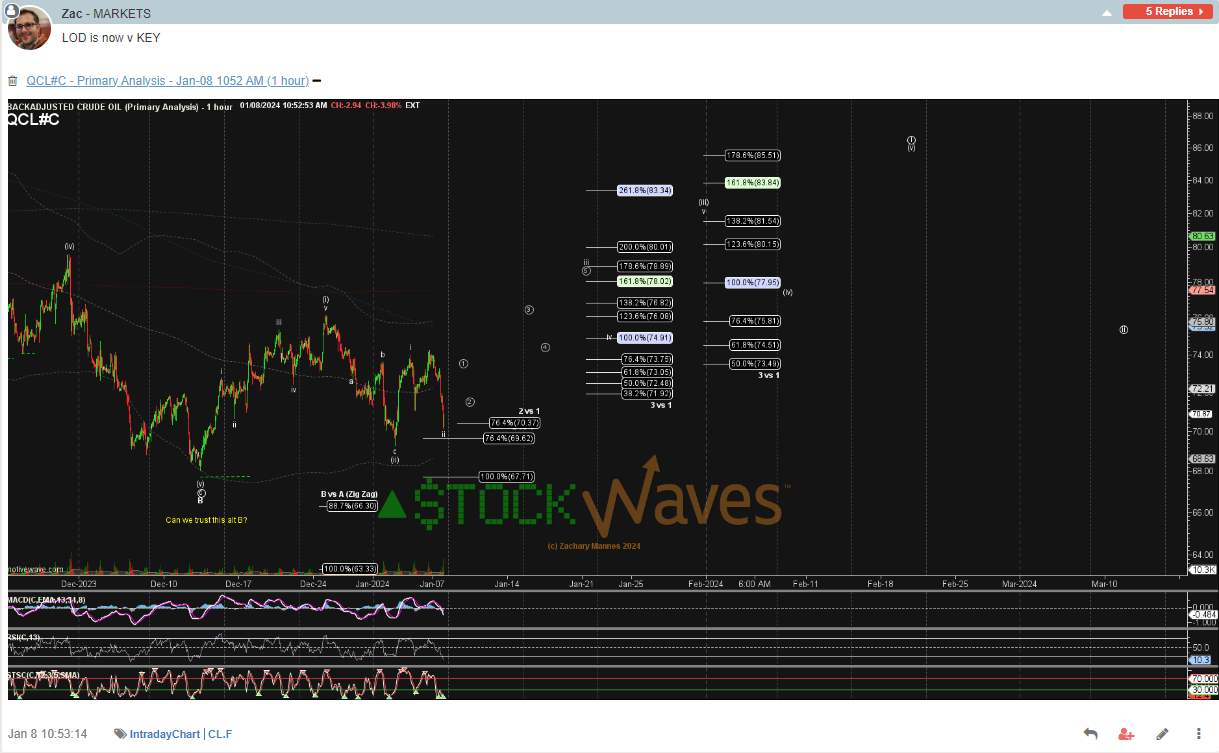
In early Jan despite only a small 3up off the very deep Dec low I thought we were heading higher as wave i of C.
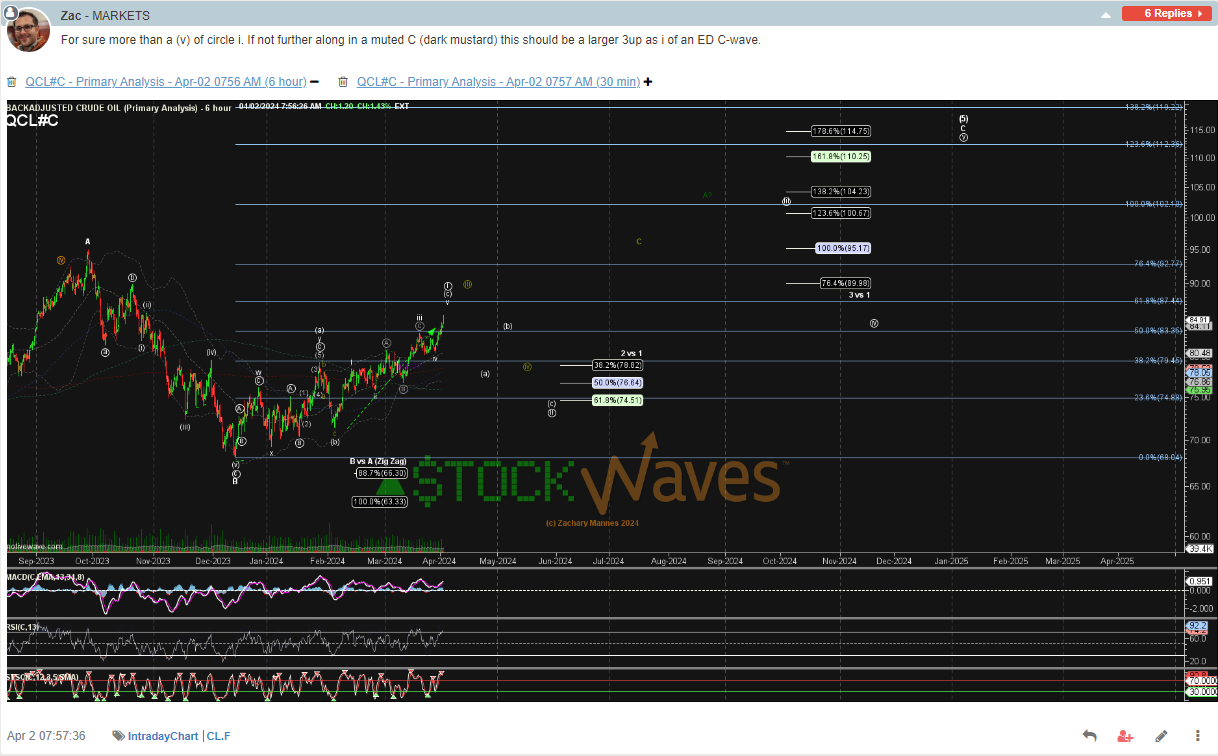
Into early April I thought we had a complete (a)(b)(c) for wave i of an ED for the C wave and should fade in a wave ii.
Our (a)(b)(c) for that possible wave ii has slipped past the 61.8% Fib in the alt orange v cautioned about to the next Fib support level, the 76.4%. As discussed though this does now have the potential to count as 5 down from April rather than an (a)(b)(c) with an extended vth of (c).
If it is 5 down it should bounce back toward 81-85 soon before heading lower. I think this is still reasonable as wave ii, especially given the structures we see in XLE & XOP and many of the key component names we track in #StockWaves regularly.