Oh, So Close - Market Analysis for Aug 30th, 2017
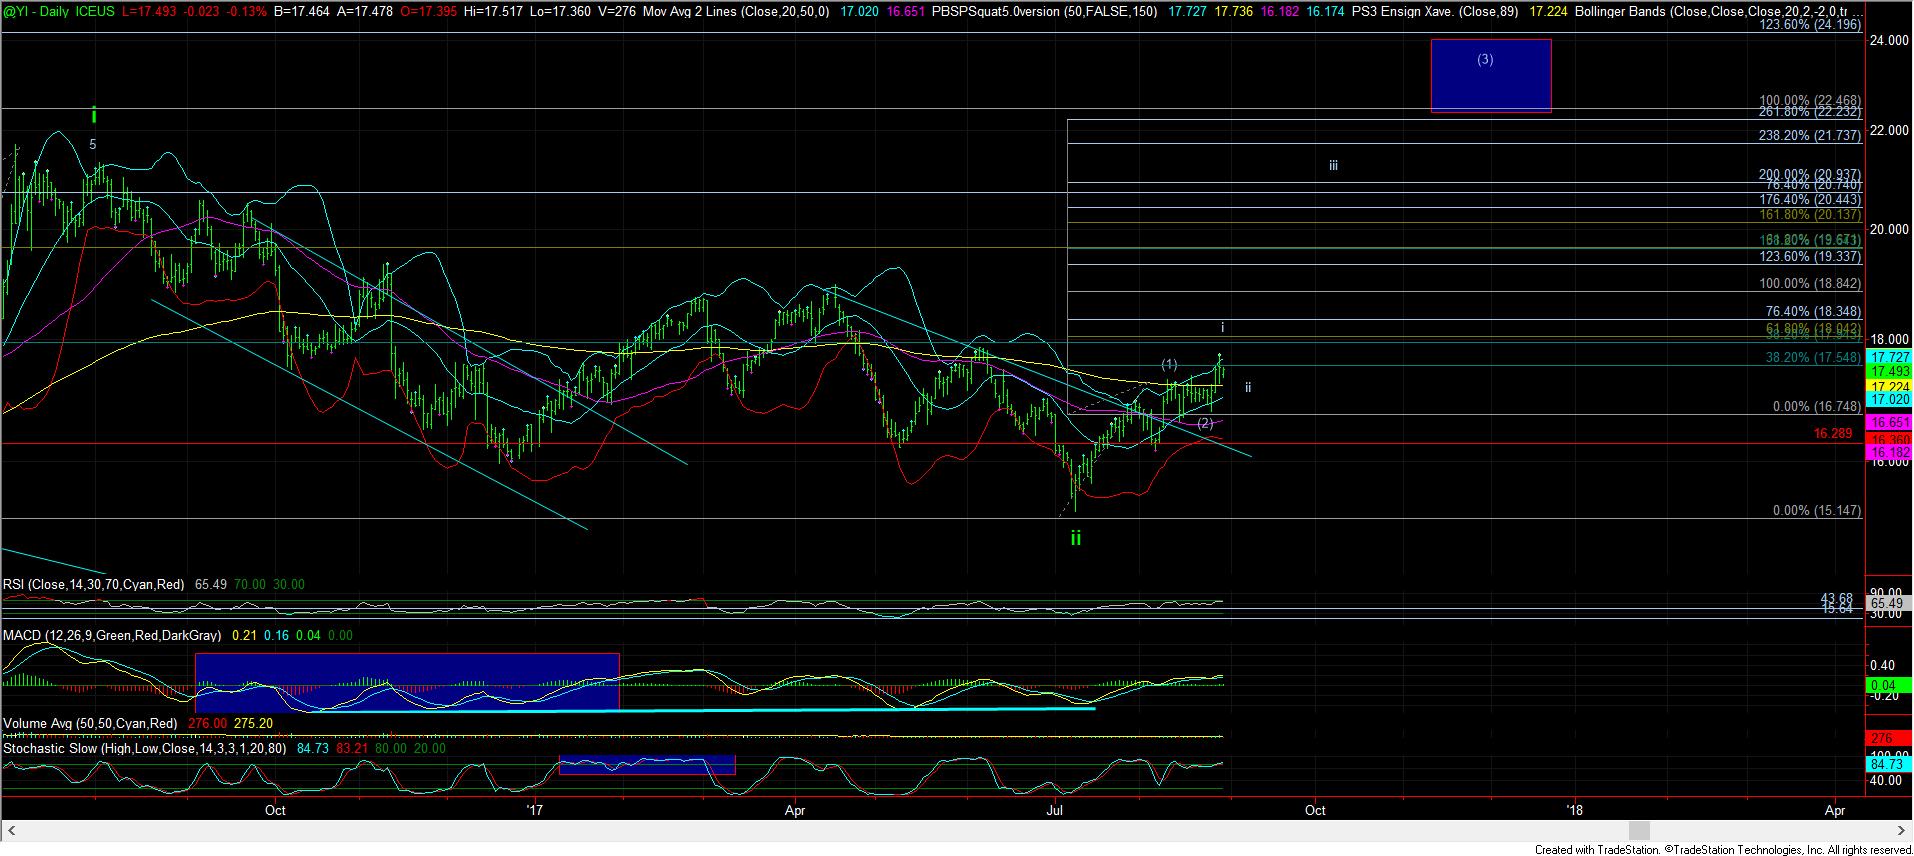
With the upside follow through we have seen in the metals complex this week, they have really gone a long way to confirm that a 3rd wave has potentially begun. But, we still have some small issues which must be addressed before we can be more confident.
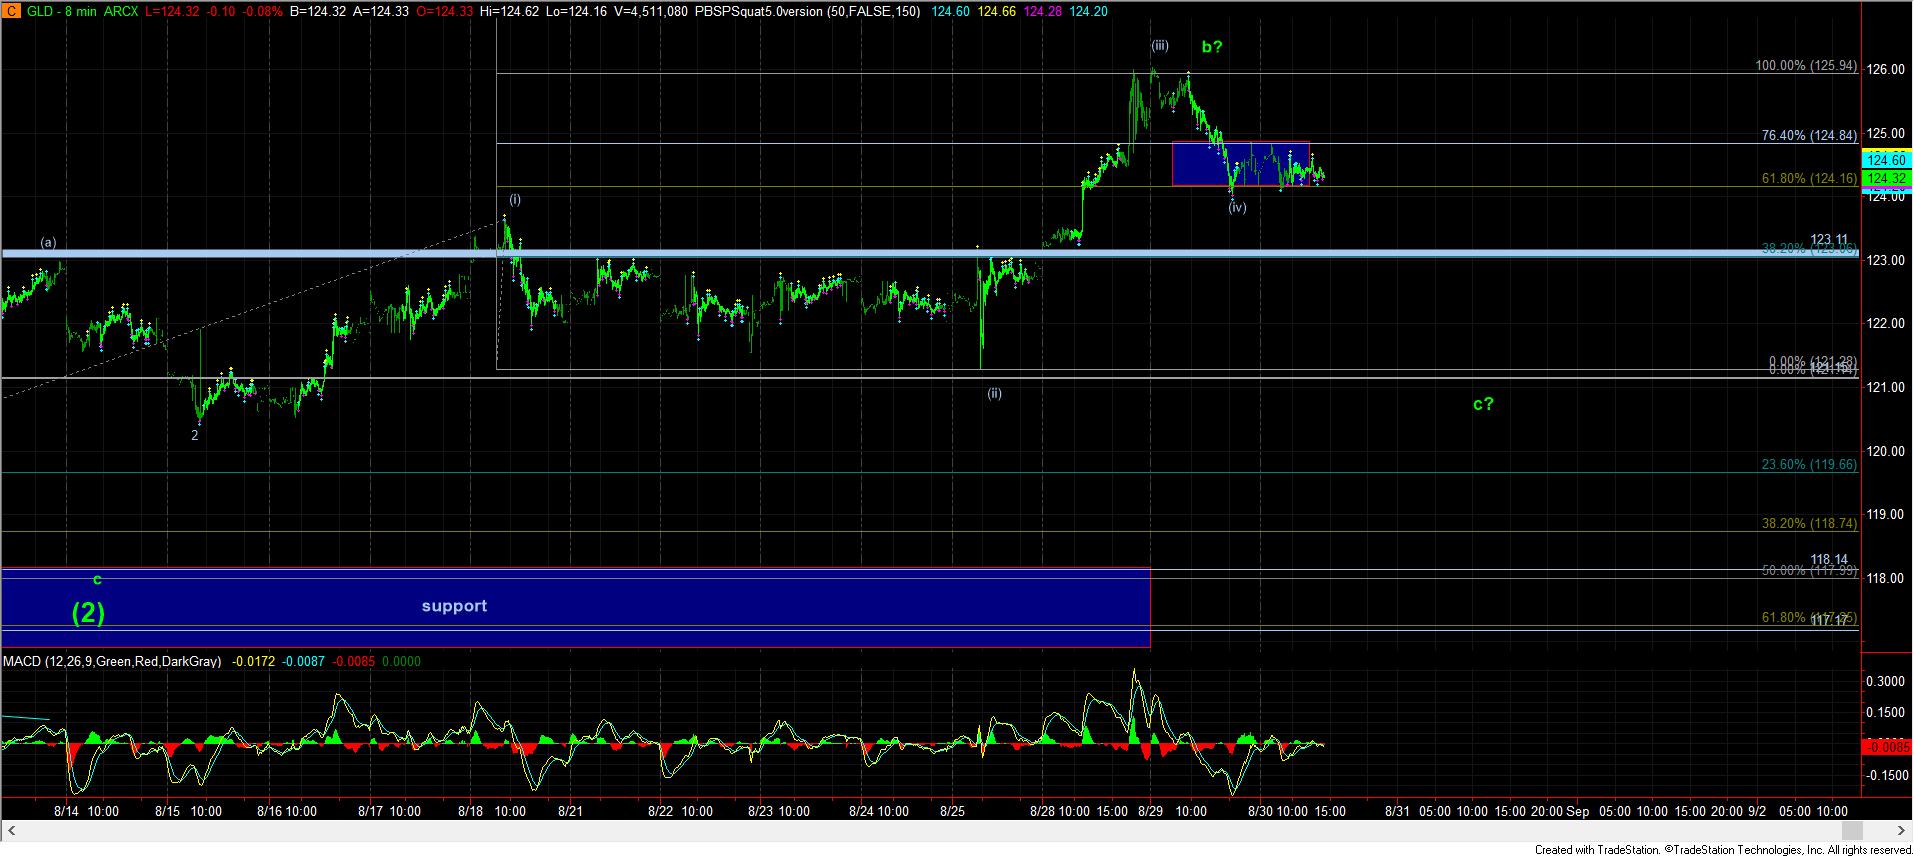
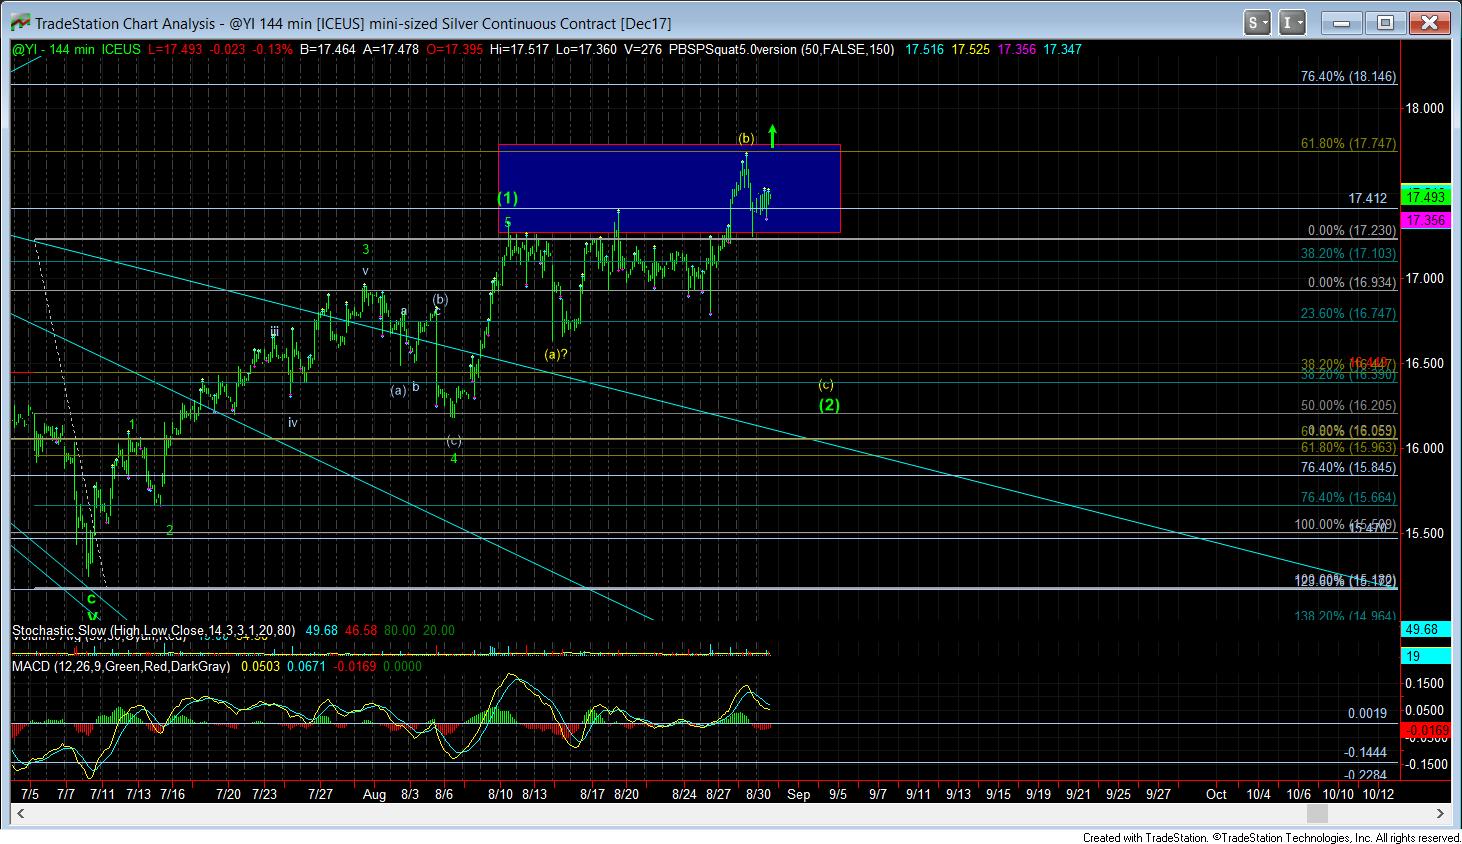
While GLD and GDX have certainly taken out their near-term resistance regions, silver still has not broken out of the “box.” In fact, silver can still count as an expanded (b) wave, unless it gets a rally up towards the 18 region to complete wave I of (3). Moreover, it is entirely possible that the GLD has the same potential, which can still take it down to the 121 region, in a more expanded a-b-c structure, as it stopped right at a 1.00 extension overhead, as shown on the 8-minute GLD chart.
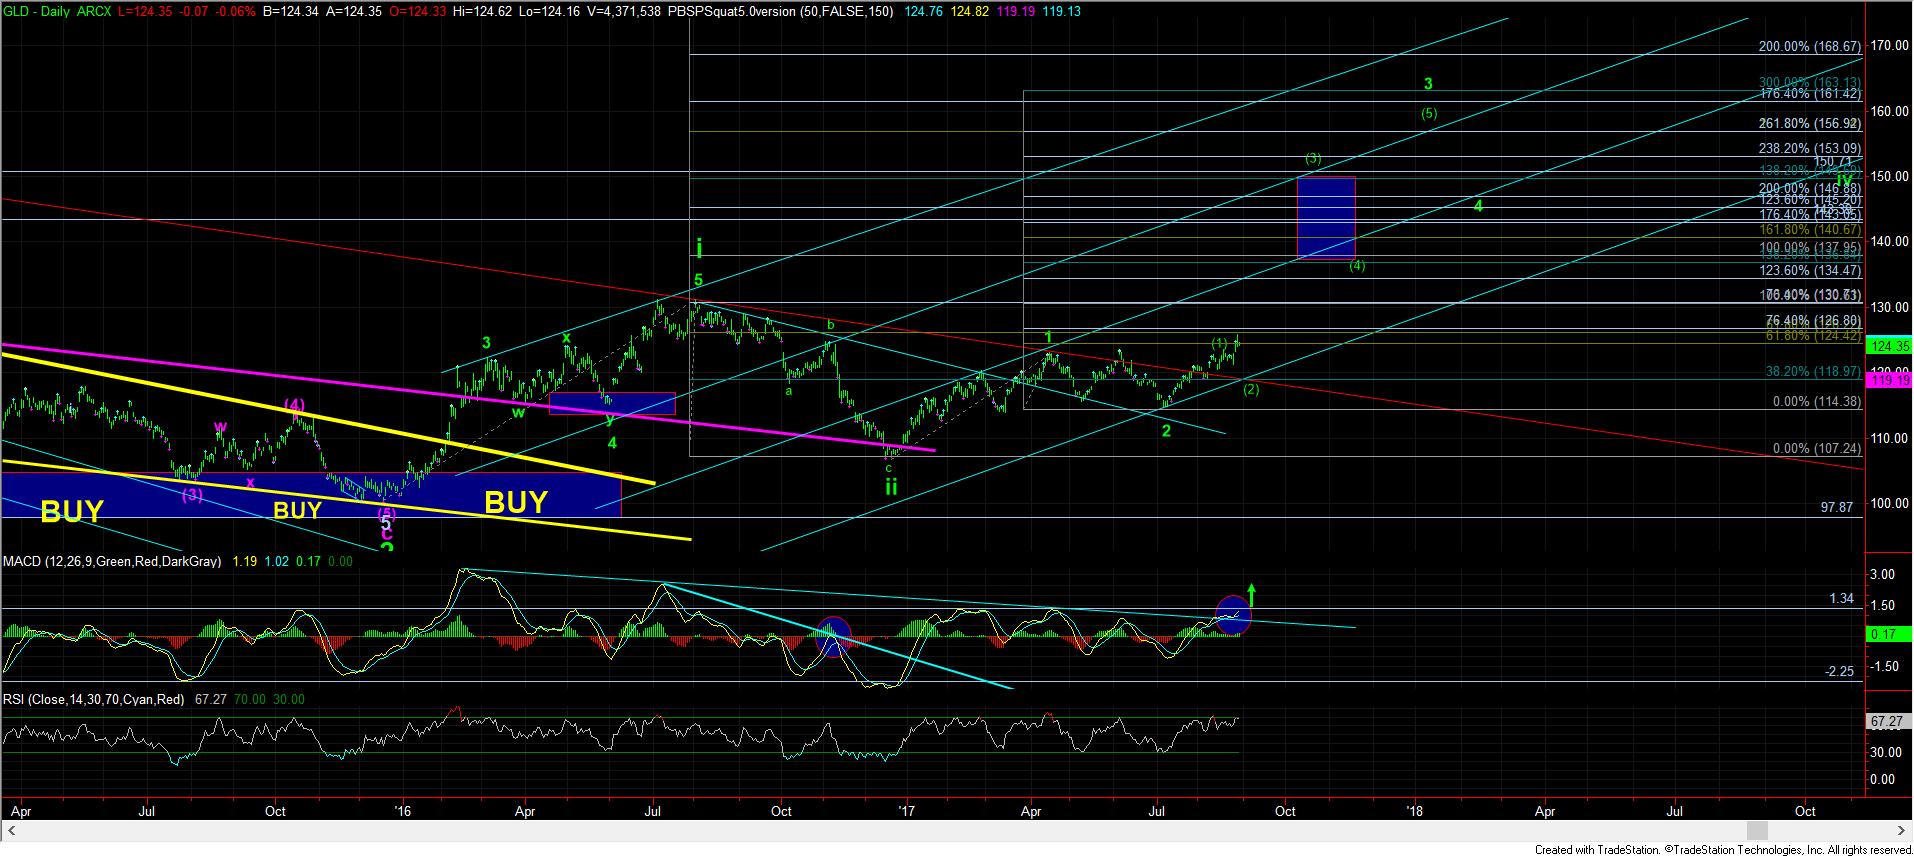
But, before you get all bearish, I am going to note, yet again, that I am not bearish this complex at all. Rather, even if we do see a c-wave down, an expanded b-wave structure is a VERY bullish indication within a market. (And, we still have no certainty as to whether that is the case here). If silver does move up to the 18 region VERY soon, then it would take that expanded structure off the table for me. But, it will still likely see a wave ii pullback/consolidation, as shown on the daily chart.
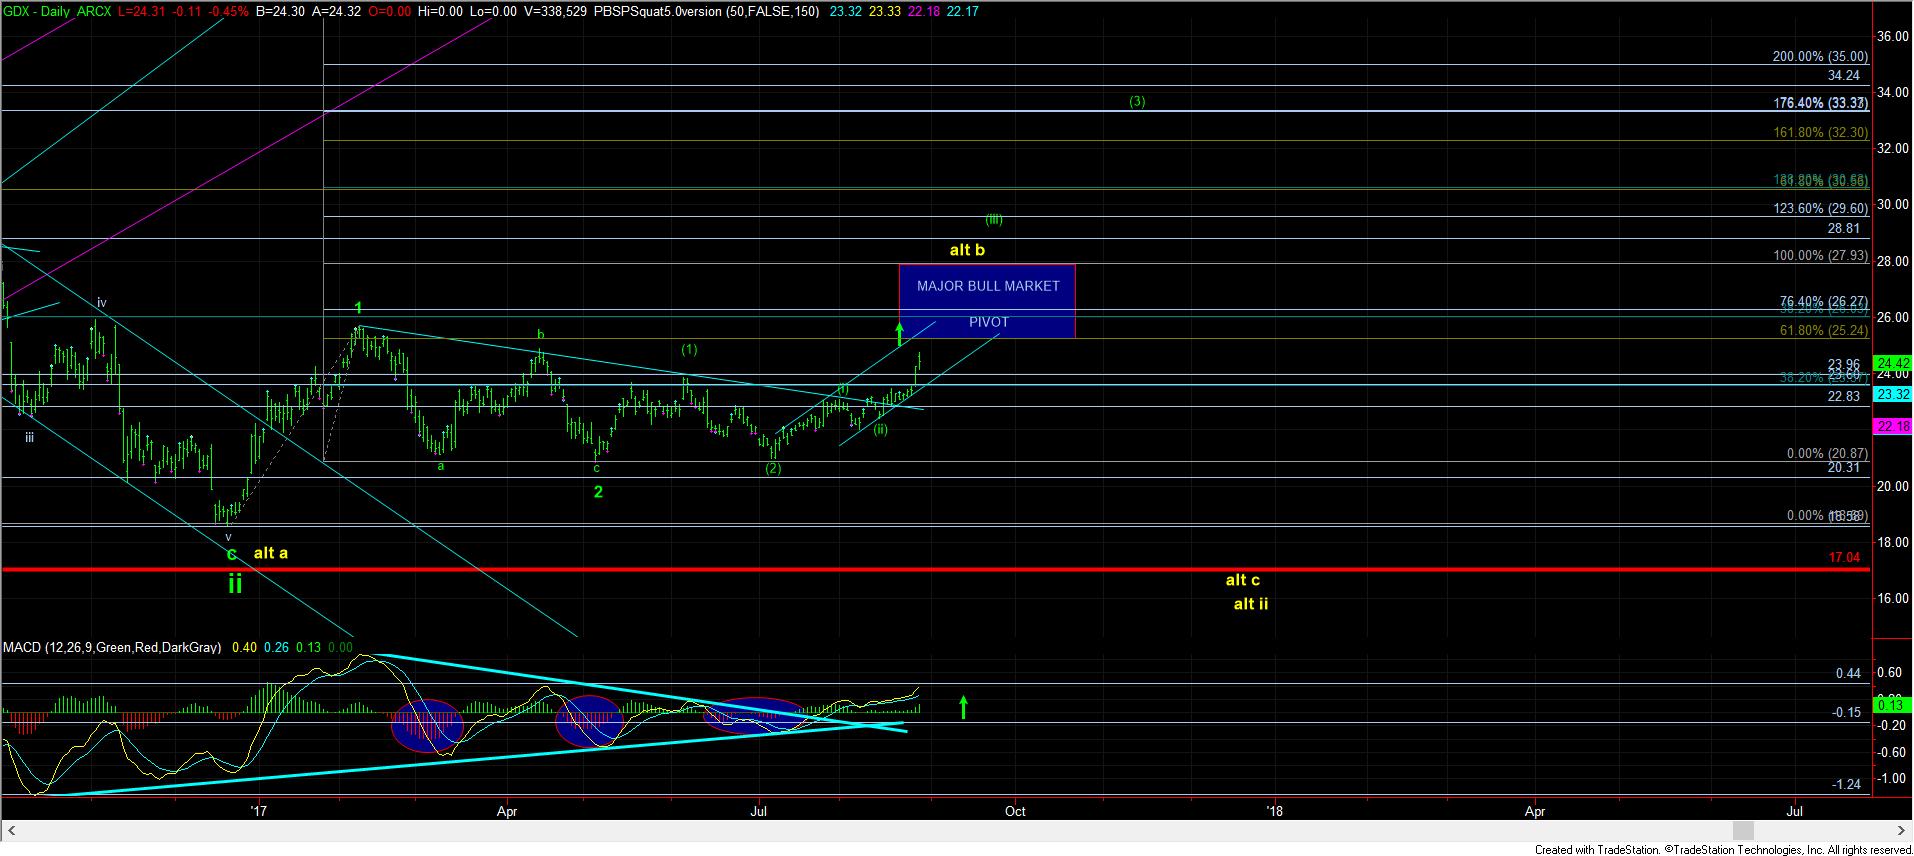
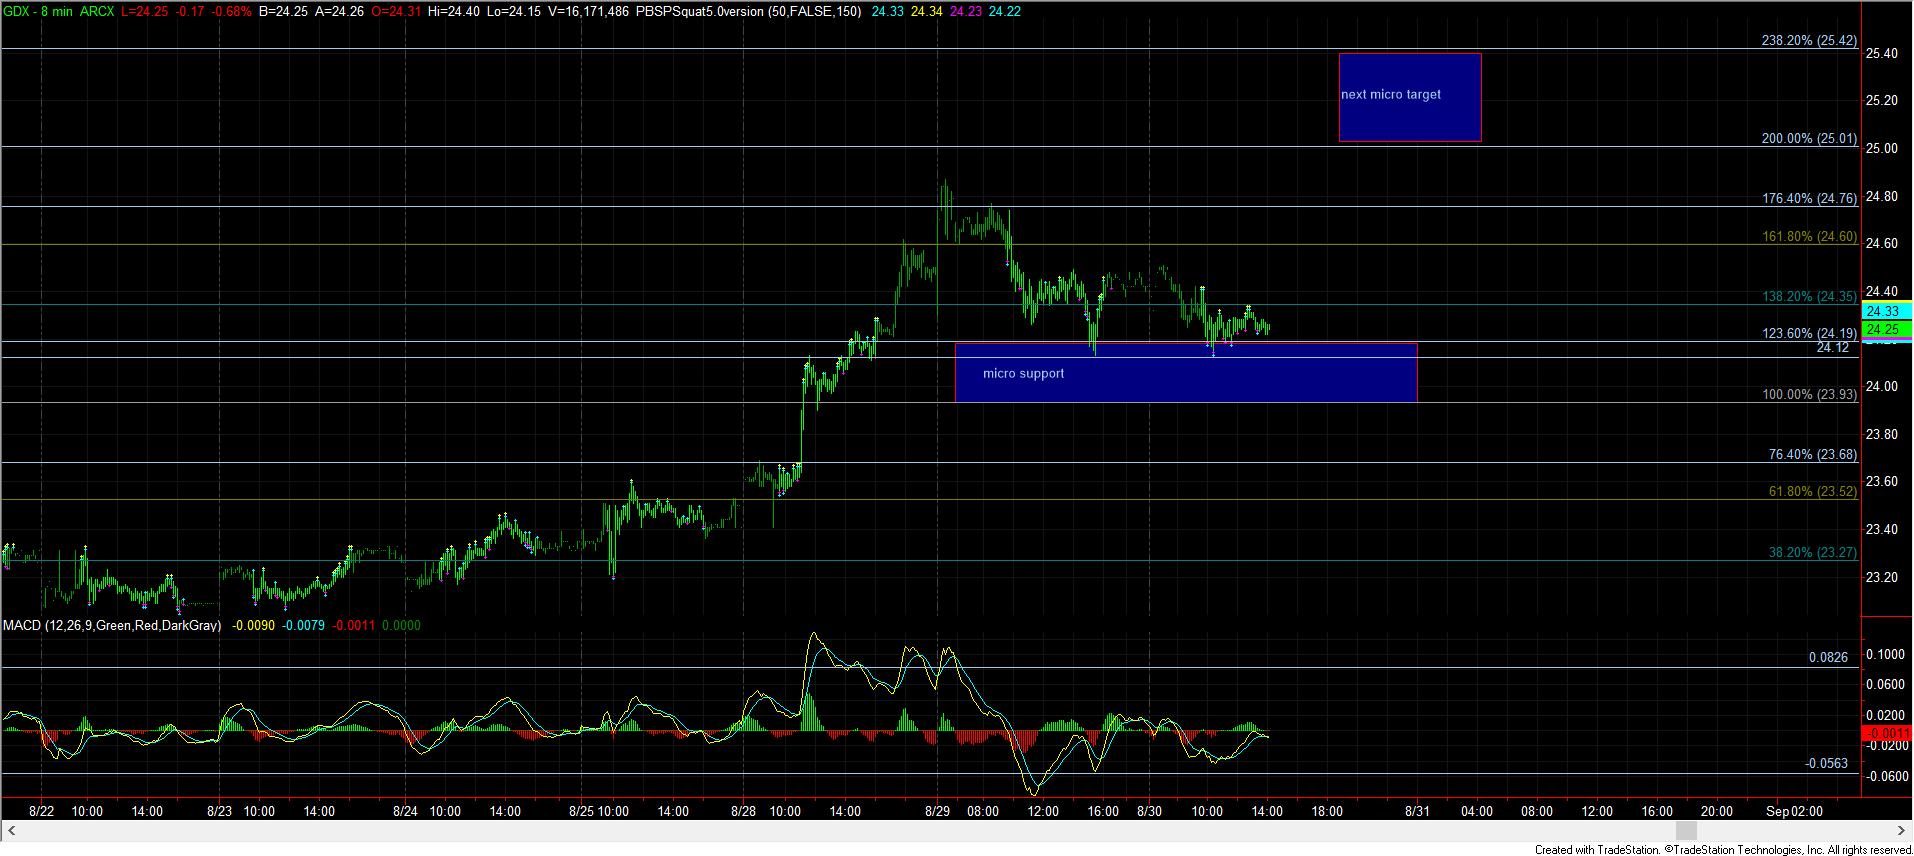
Right now, the 124 region is the ideal support for immediate upside follow through in GLD, with the 23.90 level acting as support in GDX. Should we see support break, GLD and silver may provide us with a bigger c-wave down, as shown on their smaller degree charts. Silver can drop back down to the 16-16.50 region, and GLD can drop down to the 119-121 region.
As far as GDX is concerned, it is still hard to gauge just how deep it can drop, as the micro structure on the way up has been more of an issue. But, if I were to apply the same count to GDX, it would suggest it can come back down to the 22 region. Yet, again, it is a bit harder to make that determination in GDX, as the micro pattern is not as clear.
But, take note, if silver can rally up to the 18 region within the next day or so (and the other charts follow along), that would give me the 5 waves I need to see for wave I of (3), as noted on the silver daily chart, and make it much less likely that a deeper pullback will be seen.
So, while the market is still very close to strongly suggesting the resumption of the bull market move, silver is giving me a bit of question due to the lack of another 5 up so far.
As far as the larger degree pattern is concerned, there is one more possible bull trap sitting out there, as shown on my daily GDX chart. As you can see, if the GDX made a straight up move to the 28 region, and top there, and then break back down below the bottom of the pivot labeled on the daily chart, that would open the door to a drop below the July lows for a bigger wave ii potential, as presented in yellow. Clearly, this is only an alternative count at this time, but I do want to forewarn you that, should we continue to break out, this is my next “trap” that I will be watching so that we do not get caught in the trap.