October Surprises Begin - Market Analysis for Oct 2nd, 2020
 By
By
For the month of October, we are looking for and expecting surprises. There was some question in the monthly outlook as to whether these would be of a more serious nature or of a more giddy tone depending on the current orientation of social mood vs. effect. The announcement of President Trump's testing positive for the Covid virus does give pause as to the very serious and drastic potential of this month. Although it's possible for monthly and weekly sentiment to be opposites, the weekly pattern matches that serious month of October interpretation in the Oct. 17 - 26 timeframe.
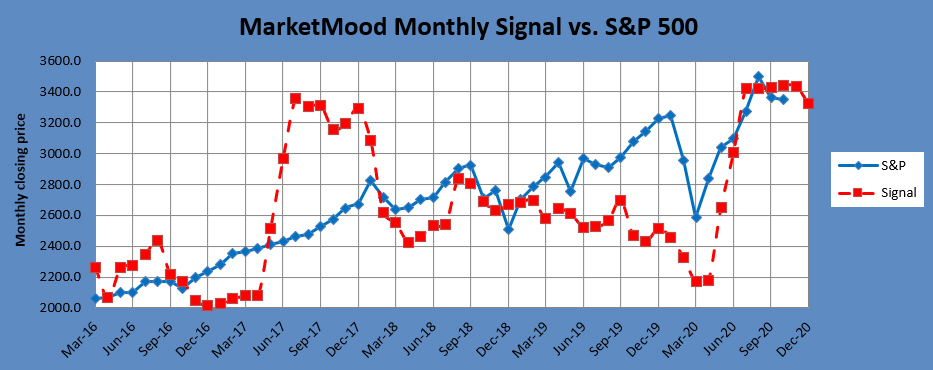
As far as the markets go, the monthly chart continues to show 3400 SPX to be important over the next couple of months. As a standalone, the monthly chart (below) shows 3400 is likely to be an important resistance level, and that the market may yet again try breaking back over it before the end of the year. The plot thickens as a local top is showing in the weekly charts as the month of October begins.
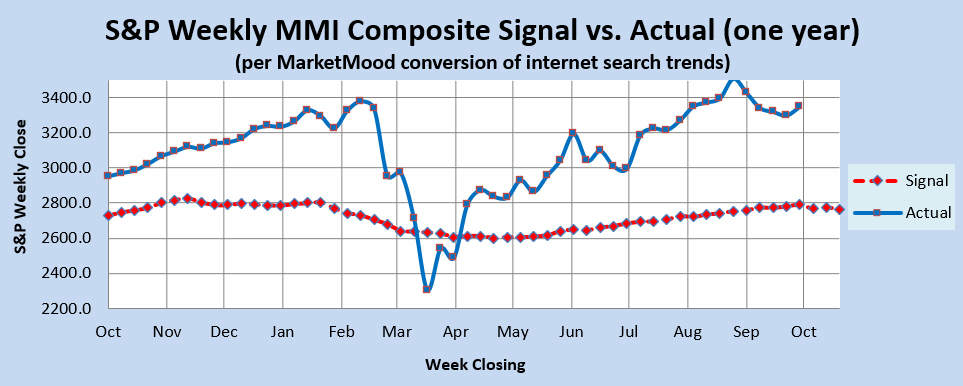
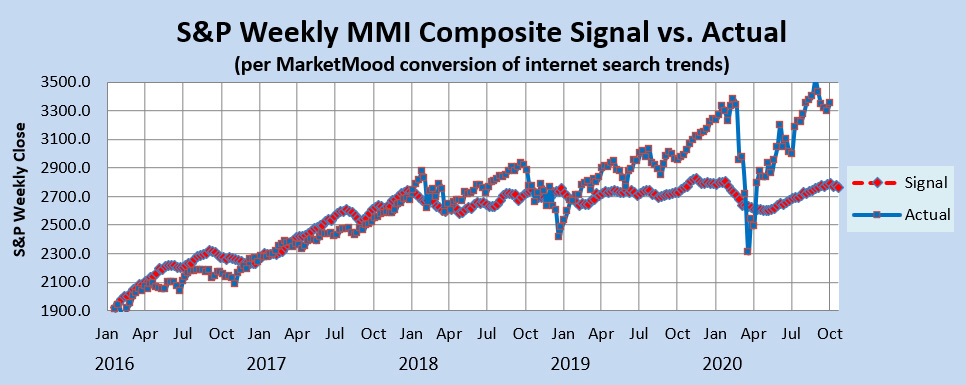
The weekly chart has been climbing, yet at the same time warning that the market is extremely and unsustainably overbought vs. sentiment and that it has no business being up this high. Often the resolution to this is a sharp drop which could occur at any time. However, it's also possible for sentiment to turn up and embrace a positive resolution which it has been trying to do, although so far inadequately. As October begins, a local top is appearing in the chart. That could add momentum to any bearishness over the next few weeks.
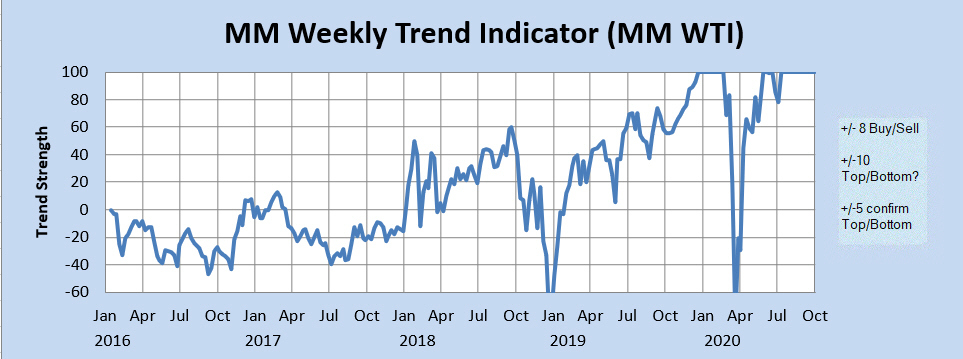
The weekly trend indicator continues to show an extremely strong, yet unsustainable bullish trend, only matched by the record extremity seen from December 2019 through mid February of this year. This was then followed by record extremity on the bearish side in March. Will this time resolve differently? Stay tuned.
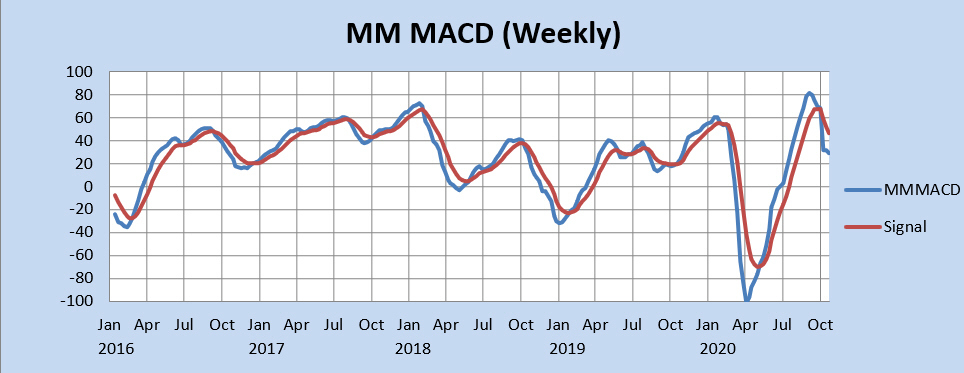
Finally, the weekly MM MACD is at a crossroads and giving mixed signals (bearish in a bullish trend).
Taking all of this together, the monthly chart is really fixated at 3400 SPX which will act as a magnet pulling the market up. At the same time, the weekly data still implies that a correction is long overdue. The weekly charts show a market that has no business being up as high as it is right now. Sentiment has been pointing in a generally bullish direction overall, but is now showing a local top as October begins. If the market has a good sized correction in it, it will have the opportunity over the next few weeks.
