
ORCL: A Tale of Two Charts
 By
Levi
By
Levi
Some companies are hard to analyze because there is not enough information. Oracle has the opposite problem. There is plenty of information — and it points in two different directions at once.
Lyn Alden, whose fundamental work needs no introduction from me, framed it this way:
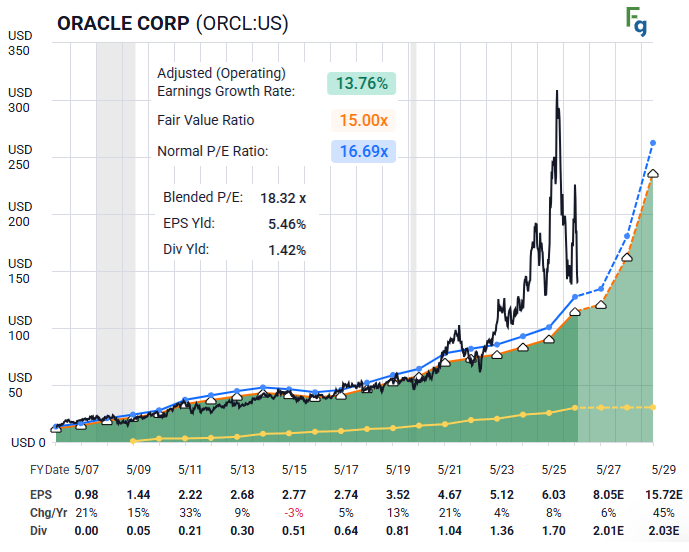
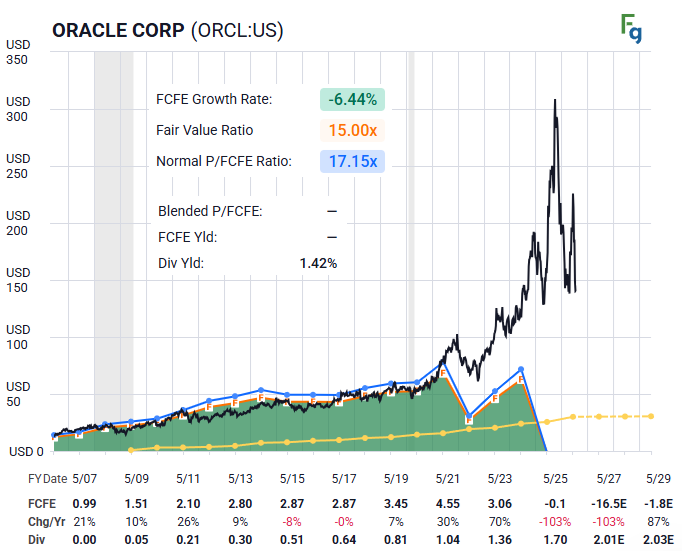
"Oracle is a tale of two charts: earnings and cash flow.
From an earnings perspective, including forecasted earnings by consensus analysts, Oracle has come down from its overvalued peak. If their AI investments pay off in the years ahead, then Oracle is positioned to do well, and no longer in a bubble of extreme sentiment.
However, free cash flow paints a different picture and shows just how large their capex is. After years of being free cash flow positive, Oracle now burns cash to make investments. And, when that proved insufficient, Oracle went to the debt markets and took out tens of billions worth of additional leverage to fund its AI-buildout. Its credit rating is now one step above junk.
While I'm not short Oracle, I just don't have positive conviction in them at the moment. I'd like to see more of a discount to take on that risk. An investor who has a more specific and bullish thesis around the returns they will get from their AI investments may see things differently, but for me, there are other parts of the AI ecosystem that I find more interesting than Oracle."
Sit with that middle paragraph for a moment.
A company that generated free cash flow for years now burns it. And when burning it was not enough, it borrowed tens of billions more. One step above junk.
Here is the question I keep turning over: where did all of that cash go?
It did not vanish. Money does not vanish. It went somewhere — and if you follow it, it leads to a very specific corner of the market. The chips. The memory. The semiconductor complex that builds the hardware this entire AI era runs on.
Think about what has actually happened over the past two years. Five hyperscalers, Oracle among them, have poured historic sums of capital expenditure into the buildout. That spending is not an abstraction. It is revenue — someone else's revenue. Every dollar of free cash flow that left Oracle's statement showed up on the income statement of a semi or a memory maker. The cash did not disappear. It changed holders.
Which means the AI buildout, so far, has one confirmed set of winners: the companies being paid to supply it. The sellers of the picks and the shovels have already collected.
The open question — the one that decides Oracle's next several years — is whether the buyers get paid back. Whether the data centers filled with that expensive silicon produce the returns that justify the leverage taken to build them.
Lyn wants a bigger discount before taking that bet. That is the fundamental read.
The structure of price has its own opinion. Let’s look at what the chart says.
Sentiment Speaks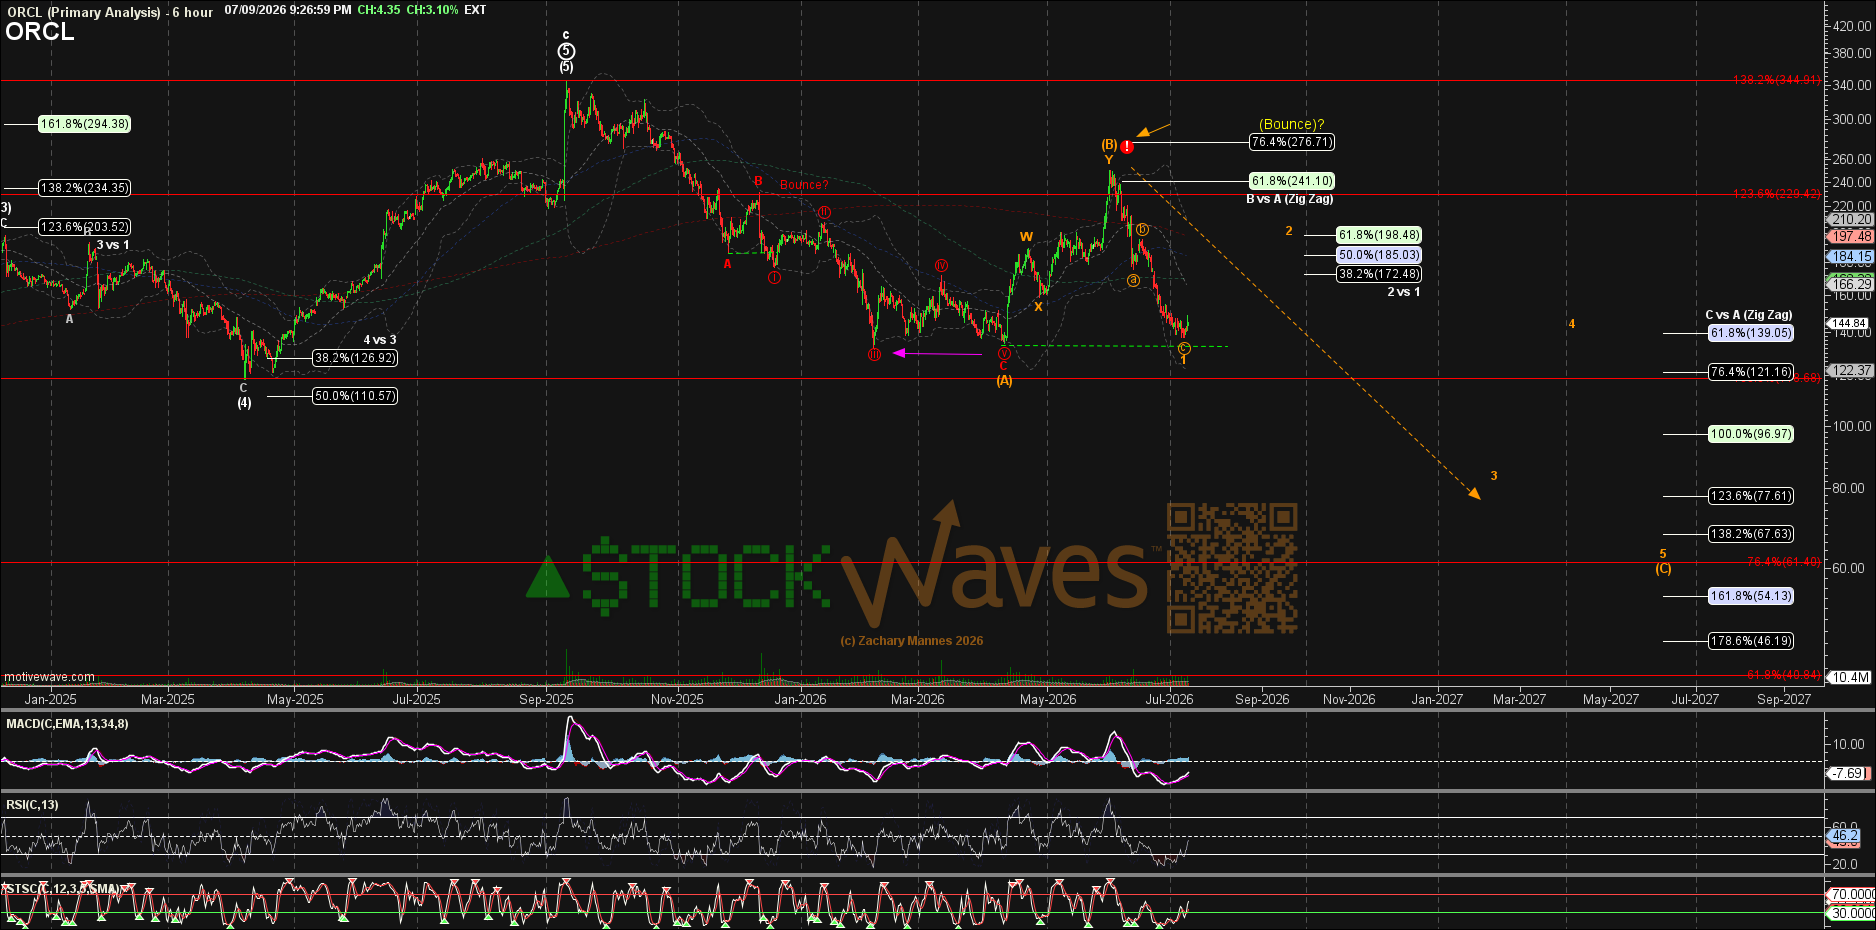
We love it when fundamentals intersect and agree with technicals. These terms are used as colloquial expressions but the “technicals” here are something distinct from what many are used to knowing.
Zac’s chart is literally showing crowd behavior as it unfolds before our own eyes. It is this structure of price that communicates with the beholder. These patterns have variable self-similarity apparent at all degrees of the structure. That is the very power that this methodology brings to the user.
Probabilities can then be projected with specific parameters and risk versus reward calculated for favorable setups.
The ORCL chart is telling us that there is a possible bounce soon in what will likely be a wave 2 of a larger (C) wave down. That (C) wave could even target the $67 region. How will we know that is indeed the target we seek?
(C) waves are five wave structures. With wave 1 likely completing soon, the wave 2 bounce, once formed, will tell us the probable zone for wave 5 of (C). What’s more, wave 1 appears to have formed as an a-b-c. This suggests that the 5 waves in (C) may take shape as a diagonal.
So, once waves 1 and 2 are in place, 3, 4 and 5 take their positions in the standards we have developed over thousands of case studies from years of close observation.
Conclusion
So we return to the two charts.
The earnings chart says Oracle has already paid its penance — down from the bubble, reasonably priced if the AI bet pays. The cash flow chart says the bet is still very much open, funded with borrowed money, one rating notch above junk.
And the price chart? It leans toward the second story. A bounce may come soon, but the structure suggests it would be a wave 2 within a larger (C) decline — a move that could reach toward the $67 region before this correction finds its footing. The bounce, when it forms, will sharpen that target. The structure will tell us, wave by wave, whether it remains the path.
Notice what that alignment means. Lyn wants a bigger discount before taking on Oracle's risk. The chart suggests the market may be in the process of offering one.
That is not a prediction of doom. Oracle spent its cash and its credit building for a future it believes in — and the companies it paid have already banked the proceeds. Whether that future arrives on schedule is the open question, and no one on either side of it knows the answer yet.
What we know is simpler. The fundamental read and the structure of price are pointing the same direction for now. When those two agree, we listen. And when the discount Lyn wants and the target the chart projects start to converge — somewhere down there, the two tales may become one.
