NuScale Power (SMR): More Power Coming Online
 By
Levi
By
Levi
By Levi at Elliott Wave Trader; Produced with Avi Gilburt
NuScale Power. This may be a name you begin to hear much more about and soon. And not because of its current revenue nor profits. Rather, the concept and the belief in it as well as continued progress with their business model (nuscalepower.com) will likely drive growth in the stock price.

What’s more, we want to share with you some more power. The power of our Wave Setups feature in StockWaves. (SMR) was shared about 5 weeks ago as a new setup with specific parameters and guidance inside the structure of price on the chart. Yes, the stock is up nicely today, but it’s not a new idea for us after the fact. The setup continues to play out as drawn up so let’s update where we find ourselves and what is likely next.
First, A Quick Look Back At The Setup
This was initial shared on April 22 with the following parameters:
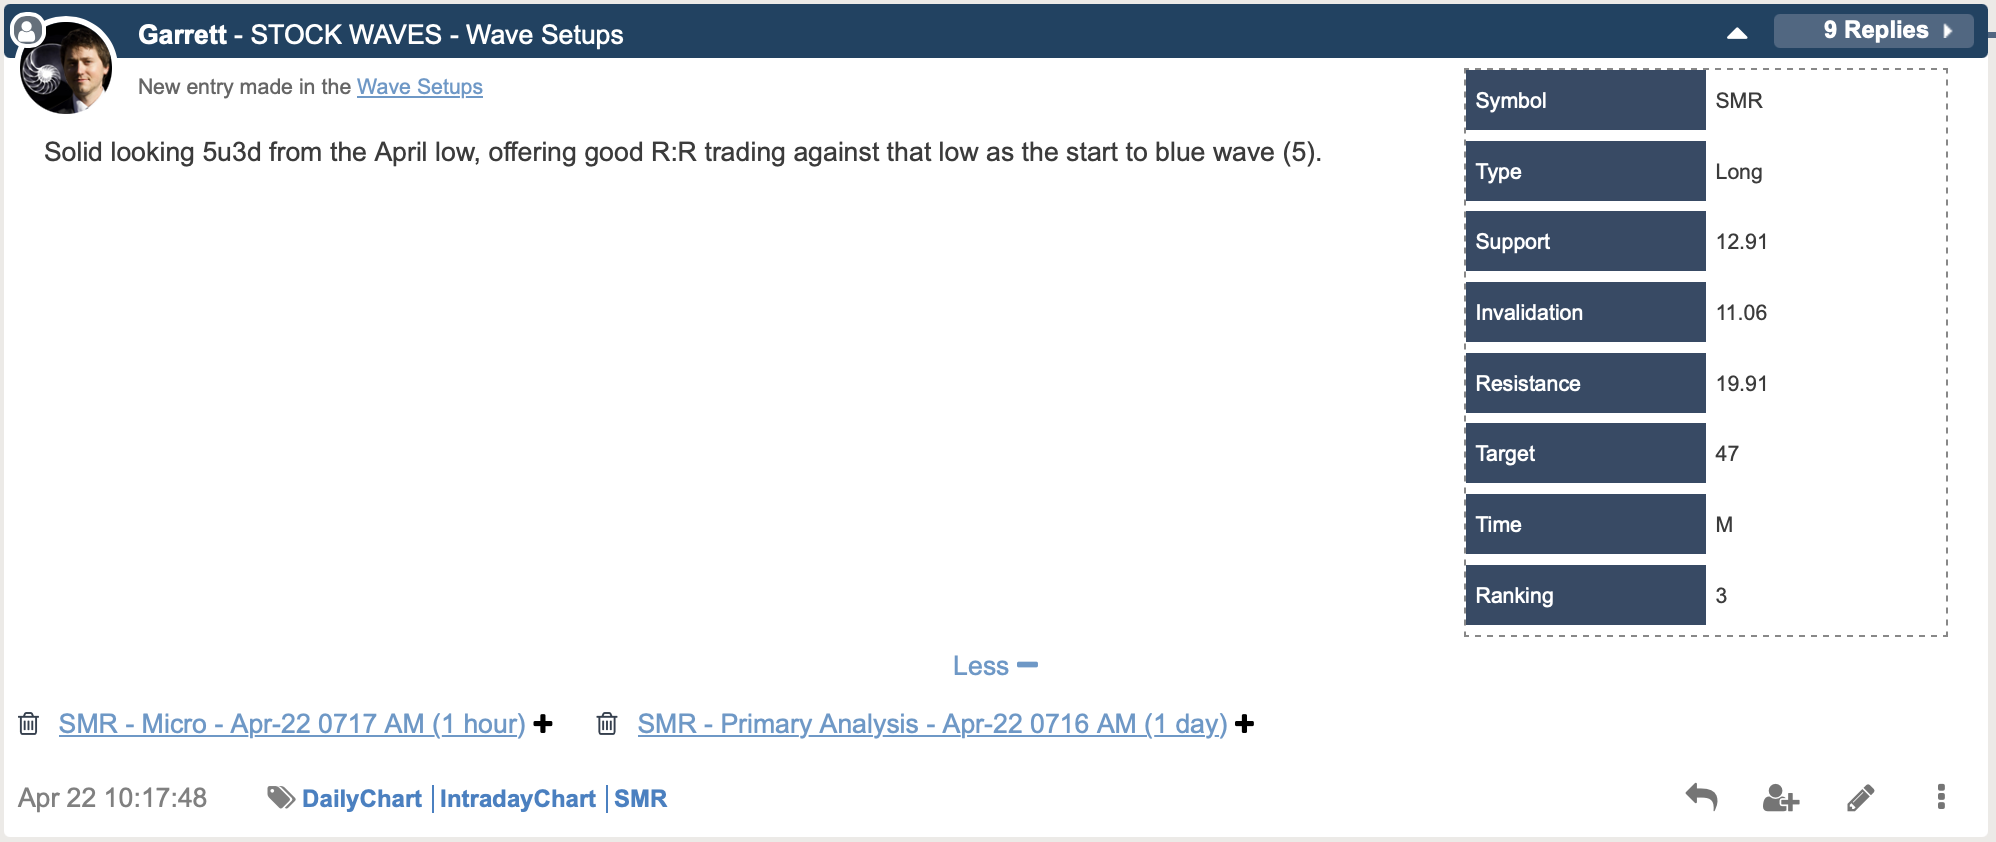
Of course, not all of these setups are going to play out as illustrated in the Wave Setups table and chart. A key feature is that the levels are clearly stated in the table and then the bigger picture of what is expected going forward is projected. Once the stock in the setup begins to work its way through the structure and important levels are struck, we will update the parameters. At times this will happen within just a few days or it can be some weeks. In this case it was last week where we had an important update.
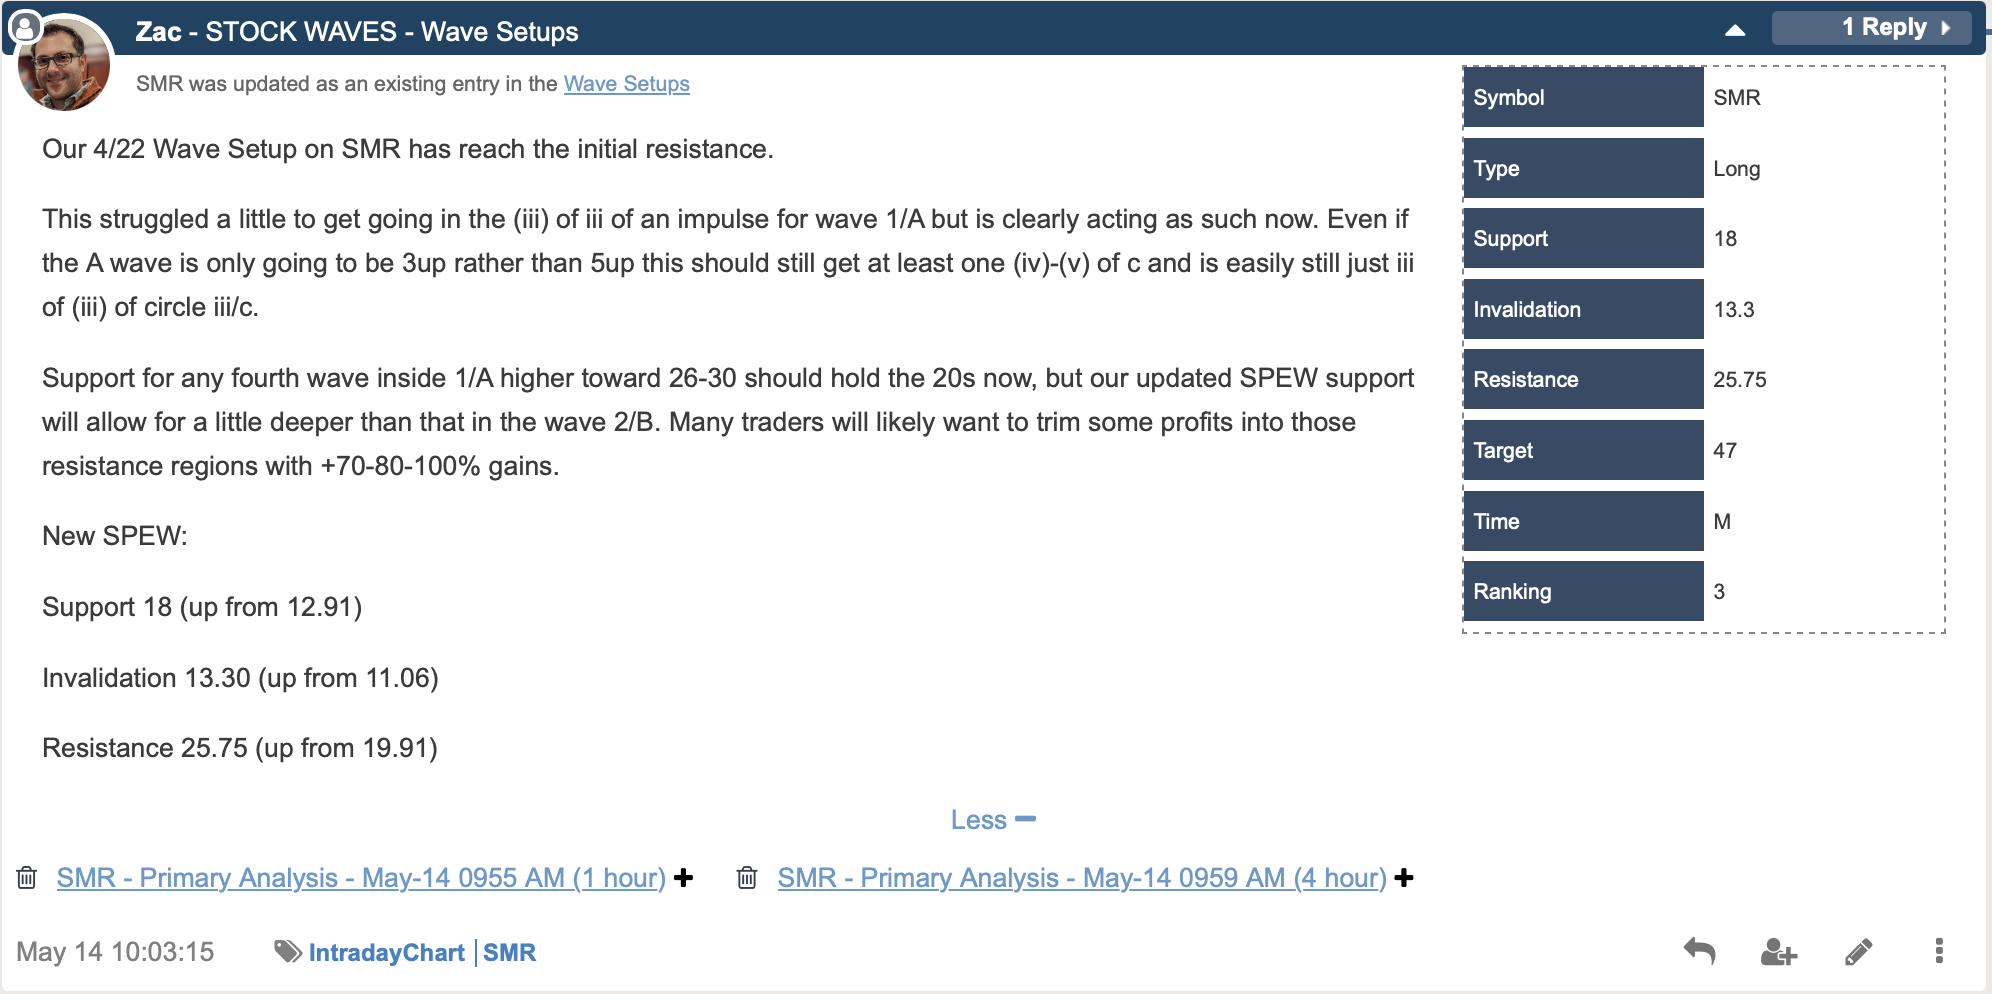
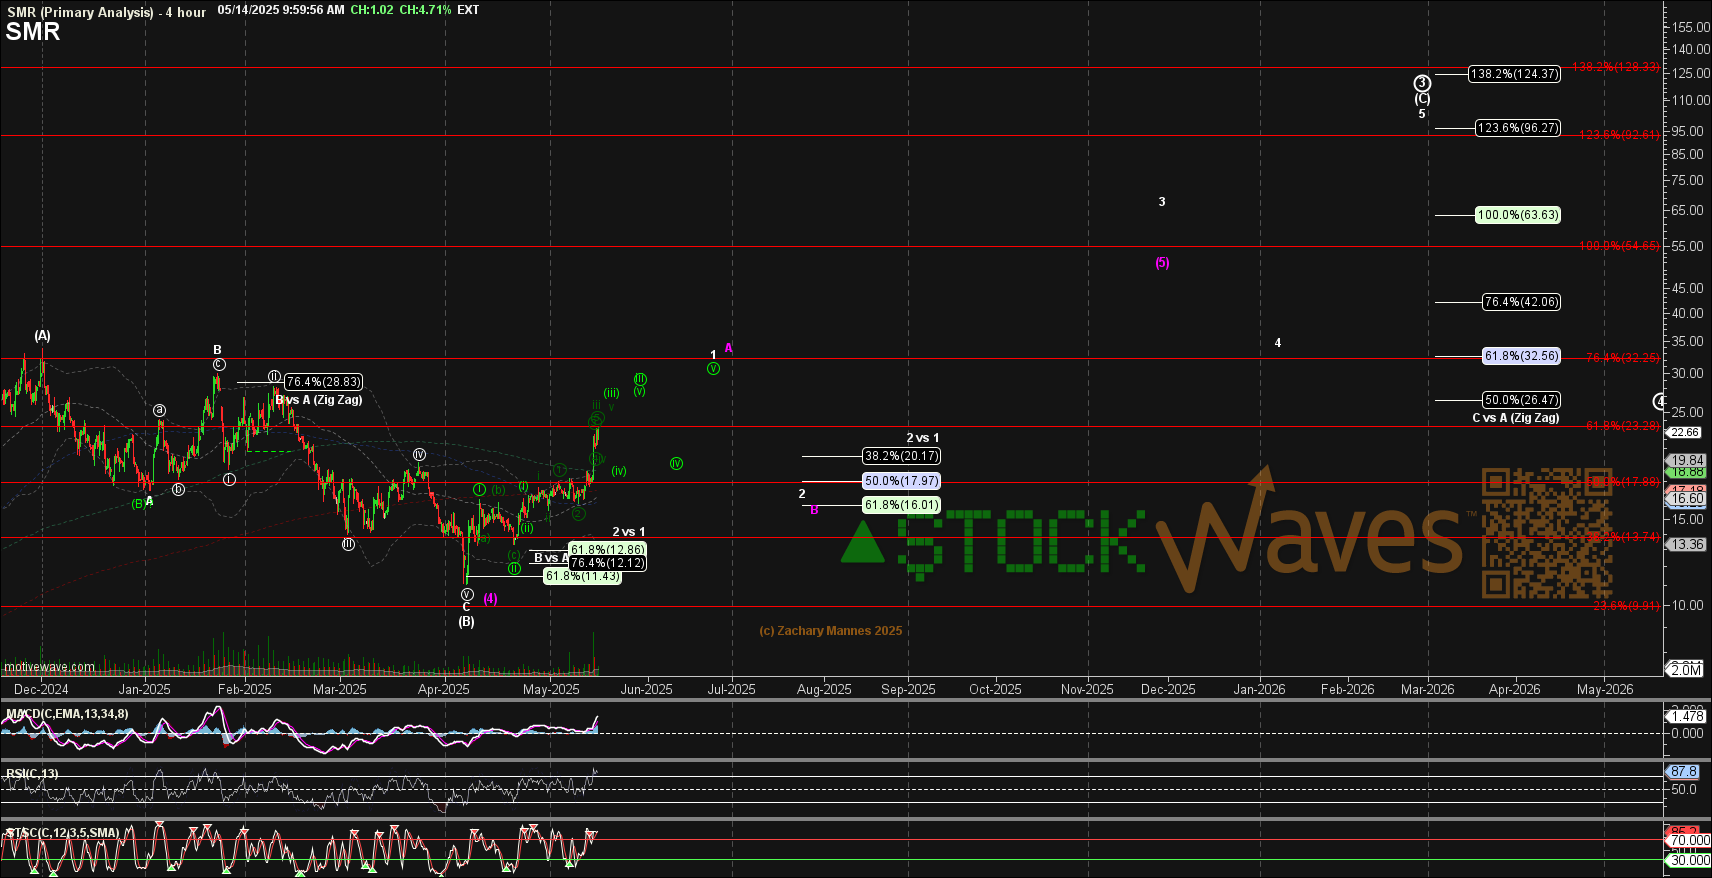
So from here we should now see the stock form the larger wave 1 of (C) of Primary Wave 3 shown by Zac in the chart above. Over time this one appears to have a favorable risk versus reward setup. And for as long as it remains within the parameters shared here we will have a bullish outlook on the stock.
But, how are we arriving at these targets and why do they work? Well, I’m glad you asked those questions - let’s get into a few more details of our methodology and see just how we can make these projections.
The Power Of Pinball In The Palm Of Your Hand
For those familiar with Fibonacci Pinball and have seen it at work on a regular basis, you will know that it is a leap forward in trading and investing. Avi Gilburt has commented on the beginnings of this methodology which we use as an overlay onto Elliott Wave Theory.
The following excerpt is from an introductory article entitled, “The Basics Of Fibonacci Pinball”. In it, Avi shares what triggered his initial thoughts and development of Pinball.
“While I was learning Elliott Wave on my own, I was trying to obtain a more ‘track-able’ and ‘tradable’ understanding of the fractal nature of the markets. This is probably what many struggle with the most. Specifically, it is when we say that within a 5 wave move, each impulsive wave breaks down further into 5 waves each, with some waves becoming extended.
Well, after much analysis and observation, I identified a standardized method to trade waves 3-5, once waves 1 and 2 were in place. Now, remember that this is a standardized method that is a most common phenomenon in the market, but markets can and do vary from this standardized presentation. In fact, when we deal with commodities or the VXX, often, we see extensions that far surpass the standardized extensions I present here. But, again, this scenario is seen very often in the markets and individual stocks, so I believe it is worthwhile to have a basic understanding of this structure to build upon.
This is something that I observed within the Elliott Wave structure, and have adapted it to a trading methodology, which I lovingly call Fibonacci Pinball.” - Avi Gilburt
With this foundation let’s build further and make specific application with our (SMR) chart.
The Power Applied To A Real-Life Example
Given that (SMR) is yet in its initial growth stages and proving the path forward, it is a prime example of crowd behavior, i.e. sentiment, in action. Companies like this are difficult to quantify via the stock price versus earnings since there really are none at the moment. So, how do we measure our risk versus reward?
One of the excelling qualities of our methodology is that it tracks and projects probabilities of human behavior. And that is precisely what is at work here on the (SMR) chart. Look back at Zac’s chart shared above. What can we glean from the structure? What is our potential reward here in the current setup? Where might the scenario need adjustment or even possibly invalidate?
All of these questions are answered with elegant simplicity via the Wave Setups table. As aforementioned, this table will be updated as the stock fills in data on the chart. This methodology is not just slapping random nomenclature onto some waves. It is deeply rooted in crowd sentiment that is ever present all around us.
Would You Like To Learn More About This Methodology?
Don’t be turned off by prior disappointments you may have suffered with the misapplication of Elliott Wave Theory. Now, this is not to imply that we will never miss a projection. These scenarios are not certainties. We are simple analysts and not prophets. However, this method of analysis continually produces successful setups across multiple time frames, and this is why we keep on using it. It works!
Approach this with an open mind. Open in the sense of being willing to accept that there are ways of viewing the markets that you have not yet considered. We certainly are not suggesting blind credulity. Take your time, review what we have shared here with the readership over the past several years. It is probable that you will come to realize the true nature of the markets. Your eyes will be opened to an entirely new viewpoint. Once you see it you may just question how it has been there all this time and you are just now coming into the light.
(Disclosure: I/we may initiate, [or already hold] long positions over the next 72 hours in SMR stock according to the parameters set forth in this article.)
