Now Comes the Big Test
Despite (and potentially even due to) the huge bearishness that pervaded the market at the end of last week, we now have the rally we wanted to see and called for in our weekend update. Now, we have to focus in on what the nature of the rally suggests.
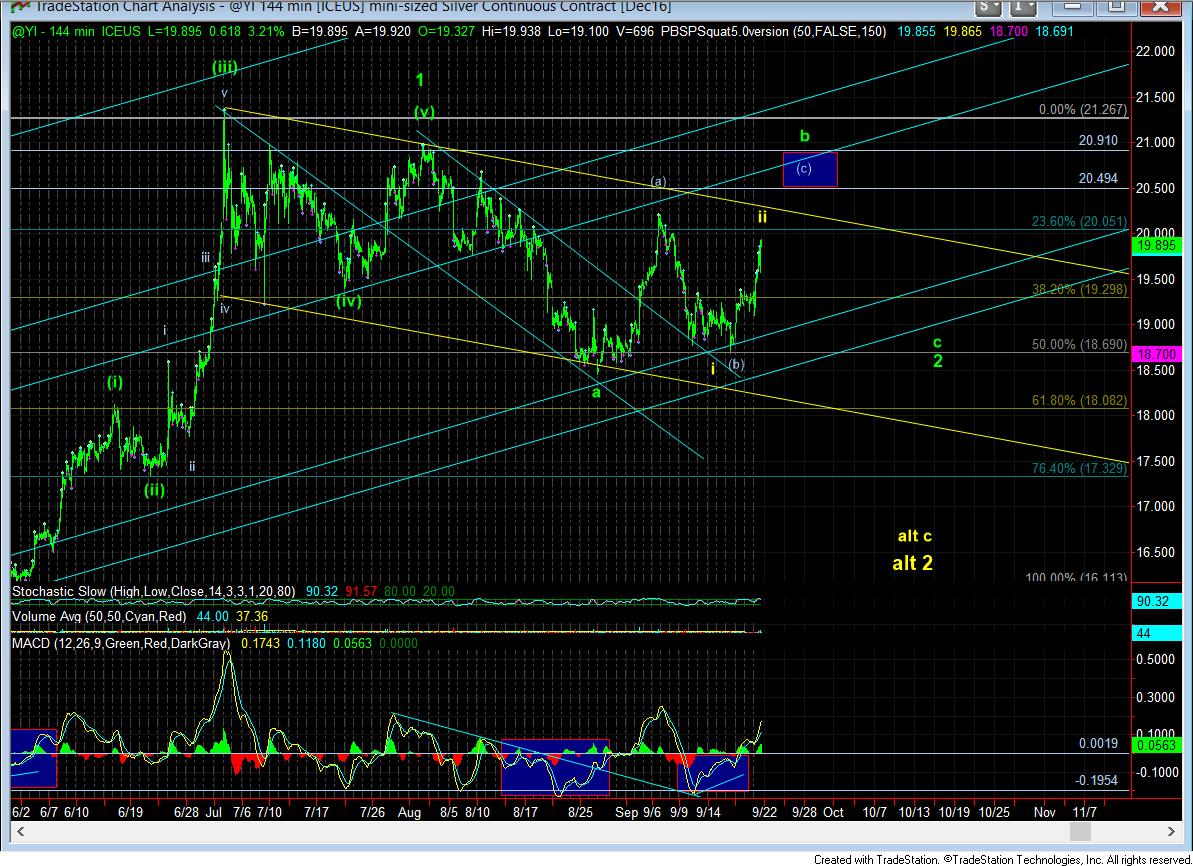
I am going to start with the silver chart, since that chart has led us to be able to call each and every bottom seen this year. Now, as you can see, we have no negative divergences on the 144 minute chart, which ordinarily suggests that the market has higher to go. That would suggest that we are on target to strike out (c) wave target higher.
However, if you take a closer look, the only rallies that provided negative divergent highs were those that consisted of 5 wave structures. The ones that were only 3 wave corrective rallies did not provide such negative divergent warning highs. And, therein lies the issue in the charts right now.
You see, this rally CAN count as a wave ii in the c-wave down for the larger 2nd wave. Until silver is able to exceed the 20.20 level, this can conceivably count as a wave ii of the c-wave of wave 2 down, which is now shown in yellow on the chart. A break of the 19.50 level would make this a much stronger likelihood.
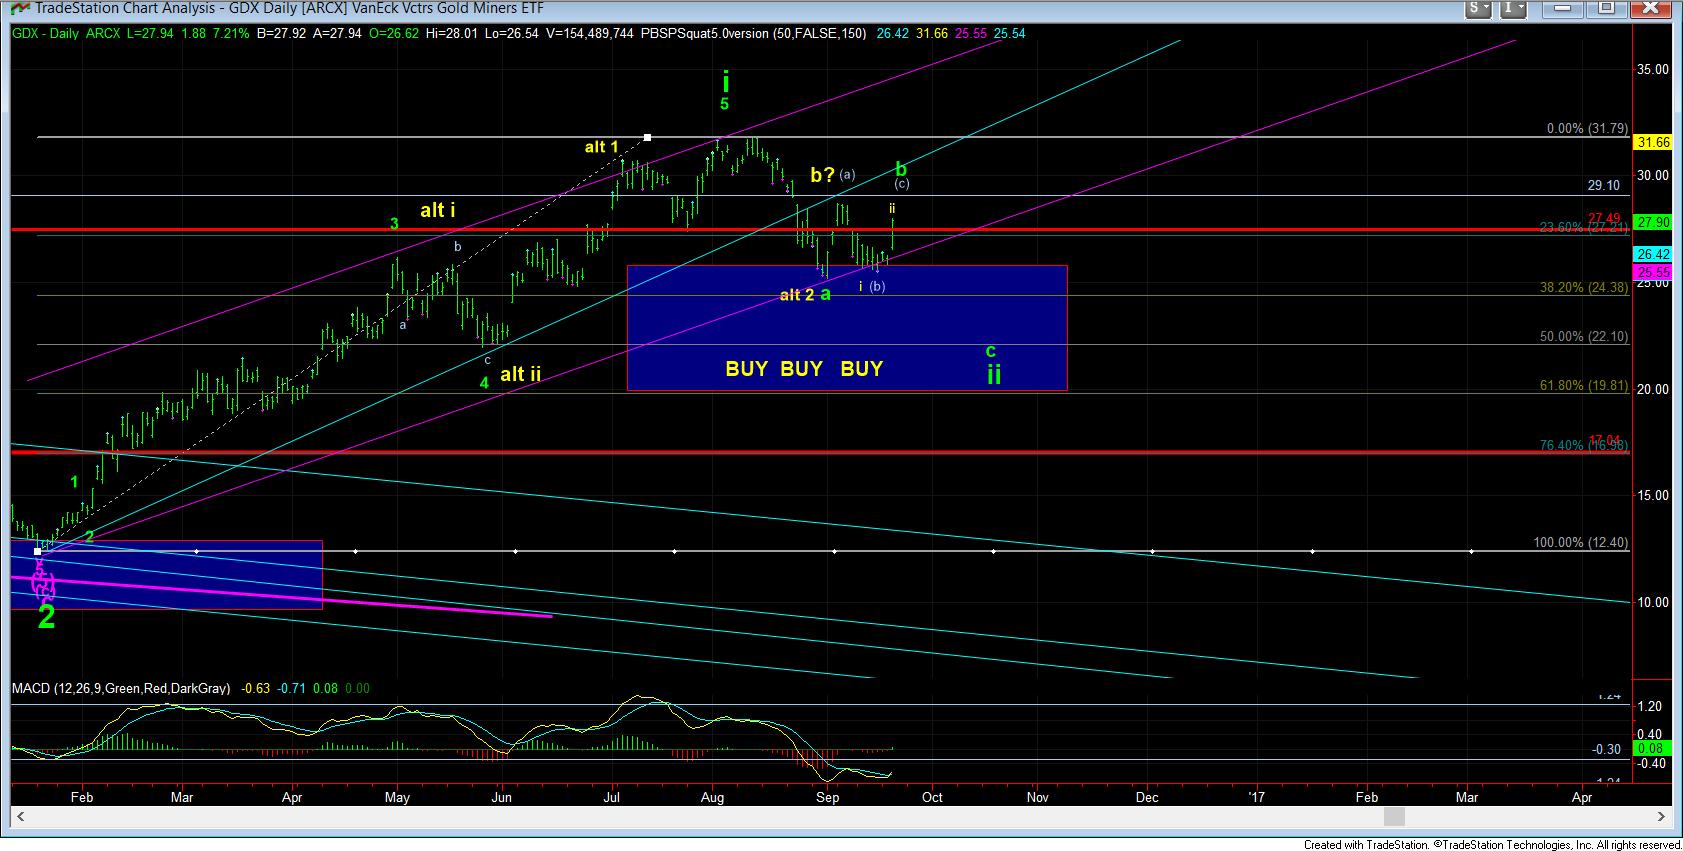
The same pattern can be seen in the GDX, and it also is represented in yellow. Moreover, I lowered the target for the (c) wave in the GDX to the point where (a)=(c), and that is 29.10.
So, I will be watching the 26.40-27 region support in GDX and the 19.50 region in silver. If we break those levels impulsively, it would strongly suggest we are dropping in the wave iii of the c-wave of wave 2.
The question has also been asked of me as to when I will stop out of my hedges. And, I think the best answer will depend on what happens IF we do complete 5 waves up off the lows. Allow me to explain. Our primary count is ideally looking for the completion of a 5 wave rally off the recent lows, which would be a (c) wave of a larger degree b-wave of wave 2. However, if we complete 5 waves up, and then drop correctively, and then take out the high of the initial 5 waves, that would suggest a 1-2 structure higher, and that would cause me to stop out of my hedges, which would likely be at a point lower than the prior August highs. Now, the market may surprise us and provide some massive extensions, which would take us to the prior highs, but that is not my expectation at this point in time.
So, for now, I am still looking to complete 5 waves up to complete the (c) wave of the b-wave, but am quite aware of the potential to break down sooner than that. It is now time to stay on your toes, as this is where the market can become much more complex.