Nothing Broken, But Adding Alternatives
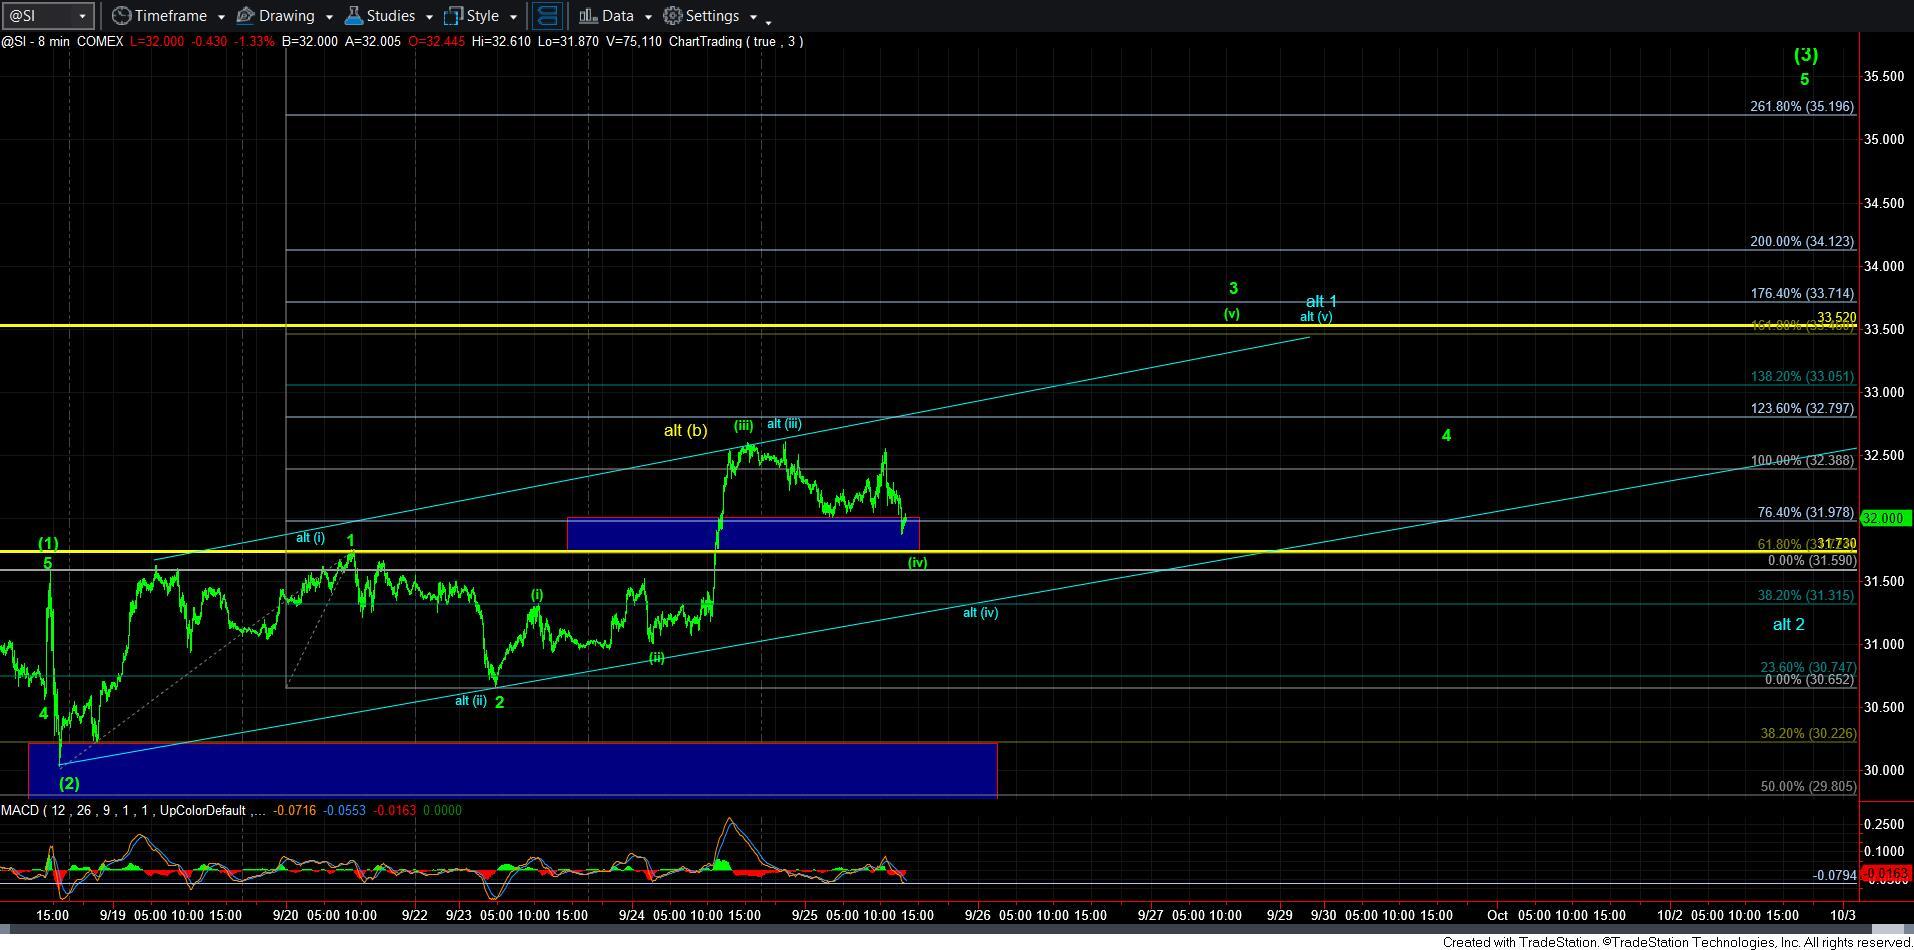
Thus far, silver has broken out through the pivot on the 8 minute chart, and is now coming back and testing that pivot from above. This is normal for most structures. However, since silver has lagged so badly, I did not want to see this much of a consolidation after the major move we had yesterday. Yet, I want to reiterate that nothing is broken right now.
That means that that the green path remains in control as long as we remain over 31.73. And, it would point us next to the 33.50 region for wave [v] of 3 in green.
However, due to the size of the consolidation, I have added two alternatives. While I have added the yellow alternative back on the 8-minute chart, I still see that as a lower probability, as I do not have any clear 5-wave decline structure in place to suggest a c-wave decline has begun. The alternative I would prefer if we do break 31.73 is a bigger wave 1 of [2], which is presented in blue on the 8-minute chart. This would suggest that wave 1 is taking shape as a leading diagonal. Should this break, then we may have to reconsider some form of the yellow count again.
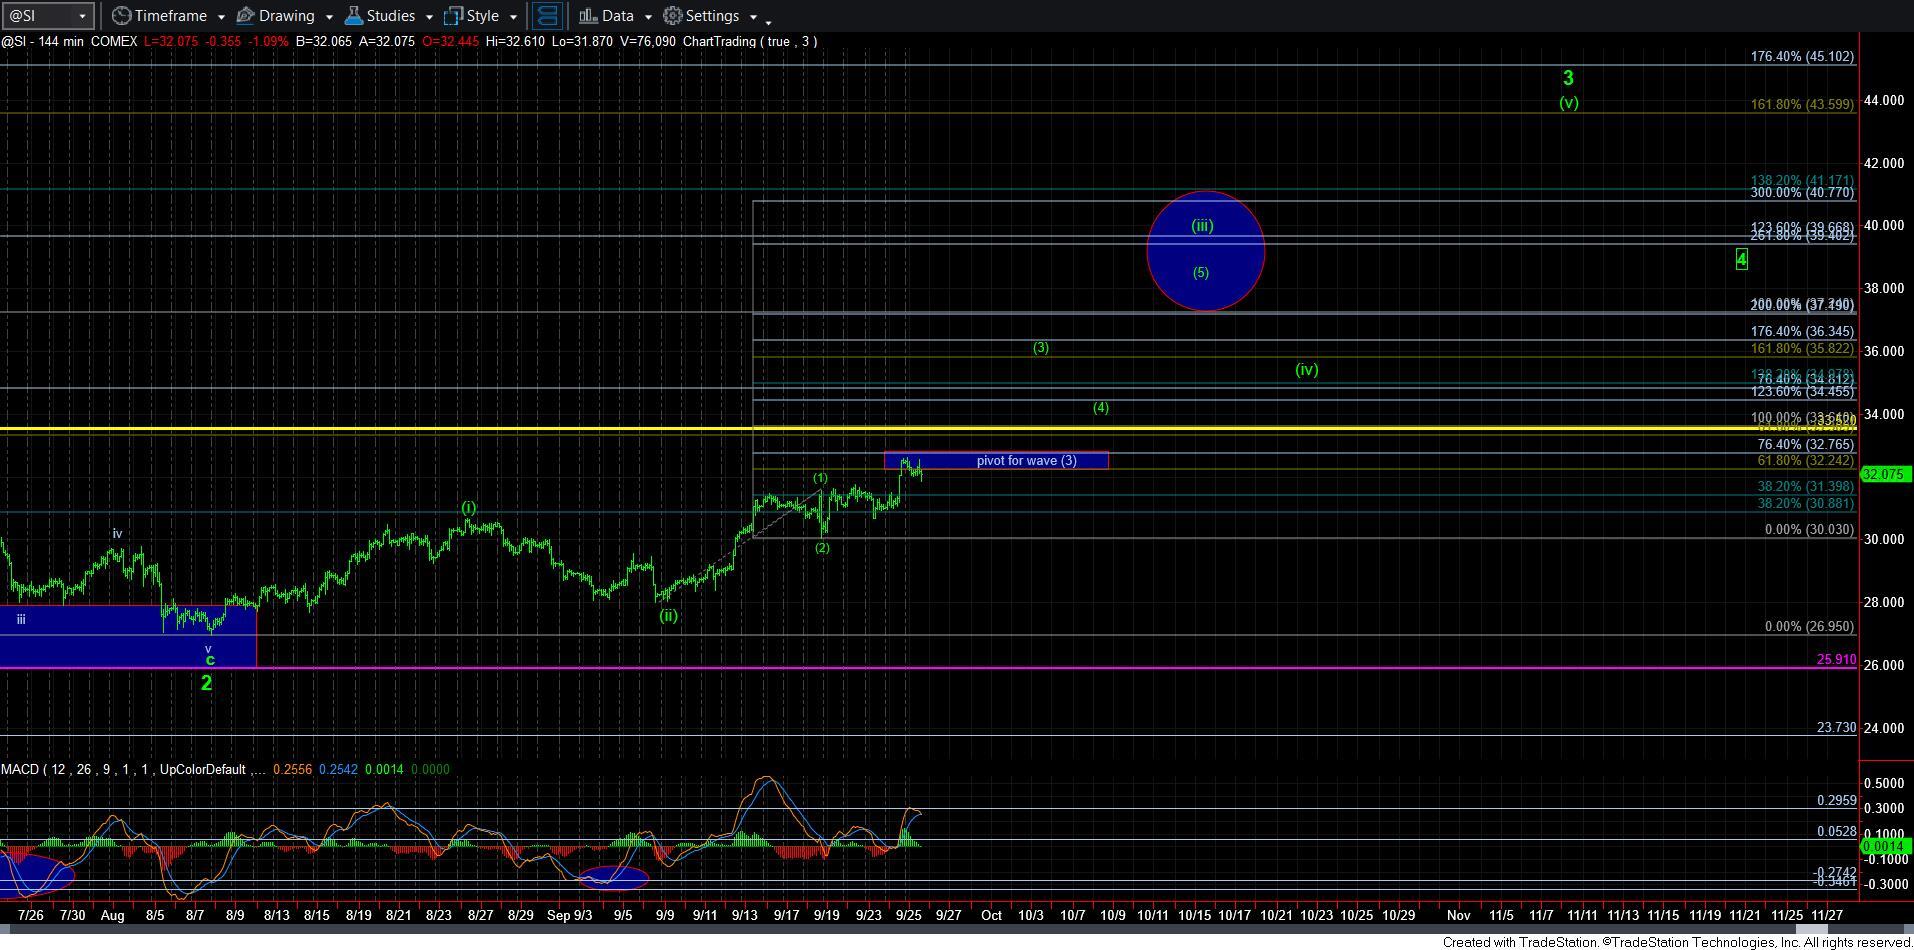
What I will want to see in silver to put away these alternatives is a break out through the 33.52 high struck in May. But, under both immediate bullish scenarios I am tracking right now (green and blue), it would seem that a pullback is going to be seen no matter which way we get there. That also means that once we see a sustained break out through 33.52, that would strongly suggest that we are going to be moving to the 40+ region rather quickly thereafter. In fact, if we continue to follow the green path, I would not be shocked to see a $2 daily move in silver within wave 5 of [3] once we break out over the 33.52.
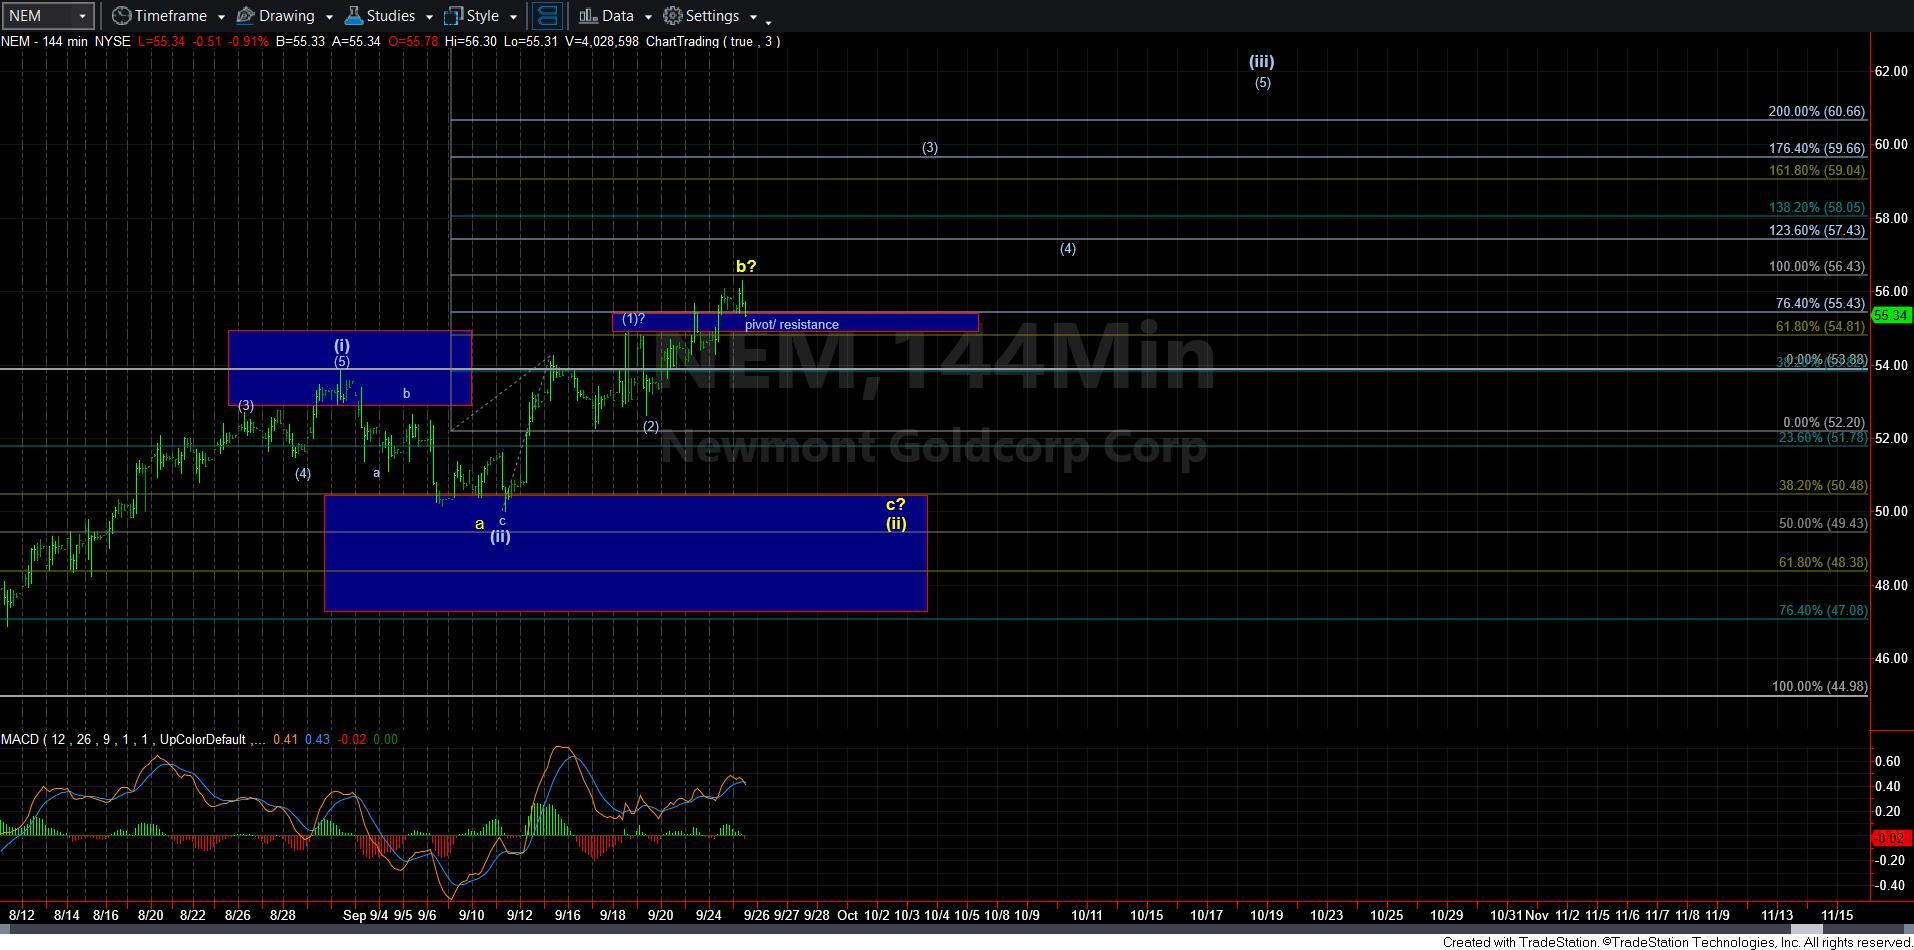
In NEM, I would also prefer that we hold the pivot noted on the chart. But, should that decisively break, again, I may have to reconsider this rally to be an expanded b-wave high, as we topped at the 1.00 extension, and a break back below the pivot opens this door, as presented in yellow. But, please do take note that an expanded b-wave structure like this is often a very bullish indication for the market rallying back over the b-wave high in the near term.
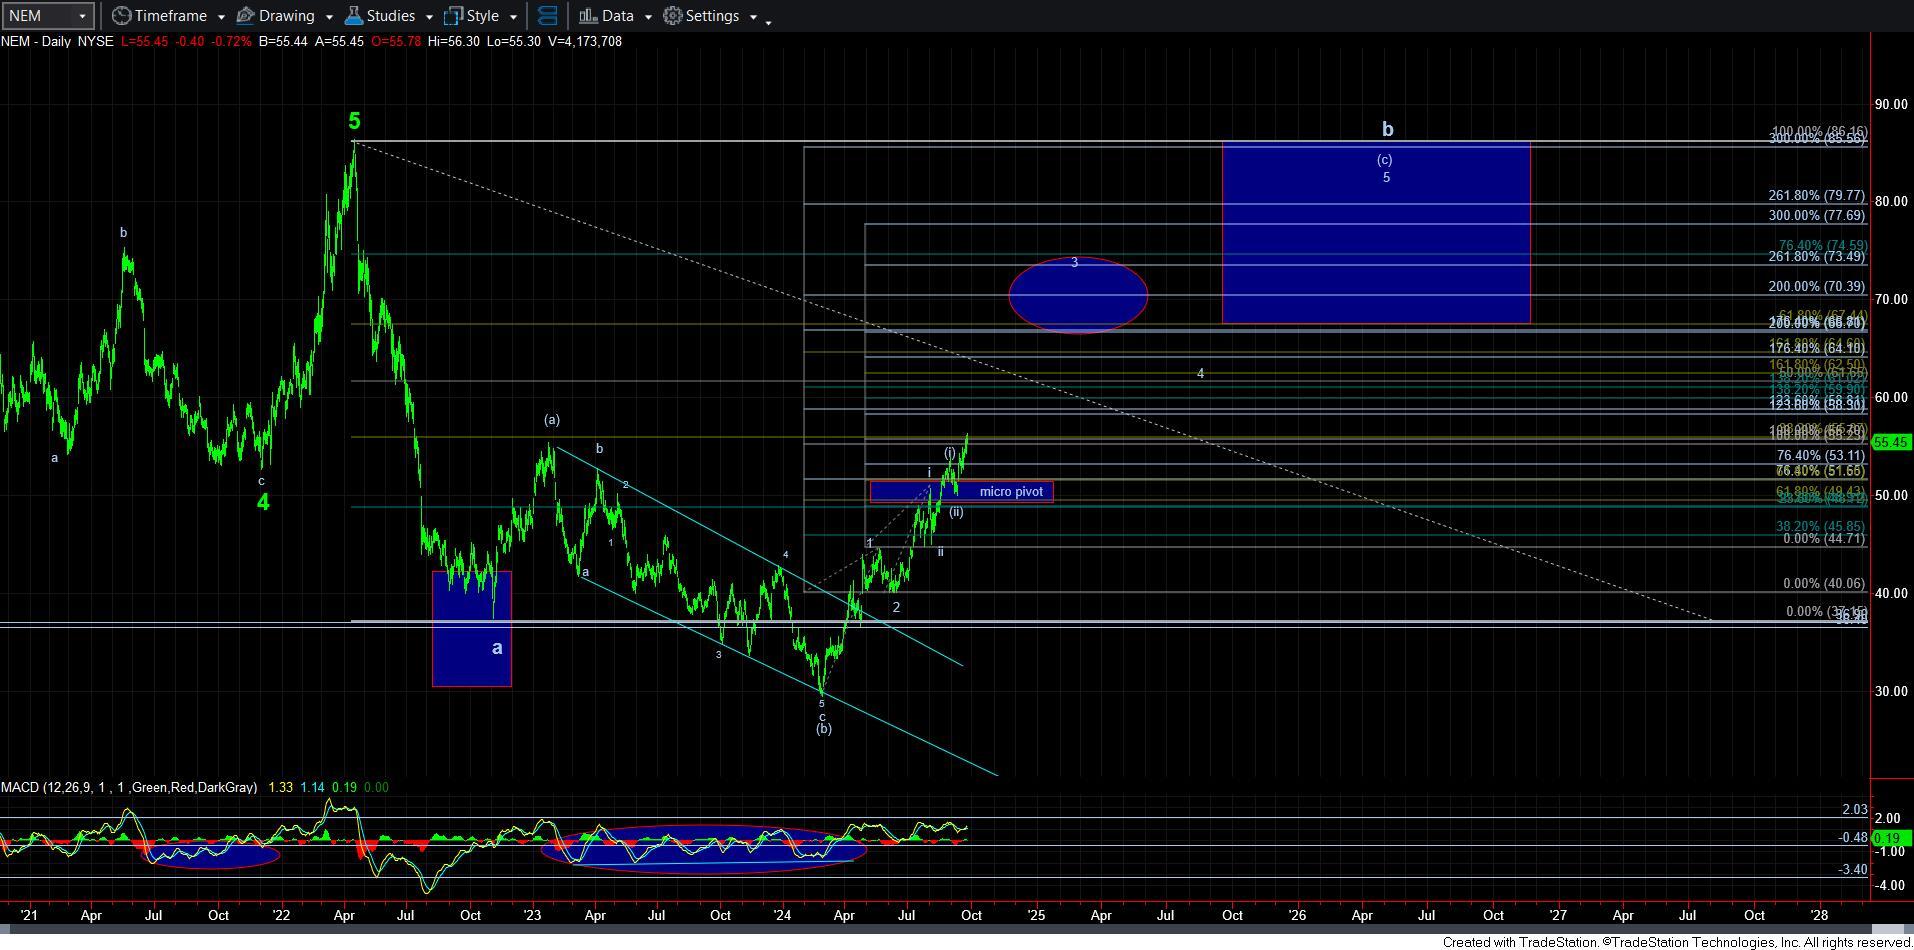
Also, take note on the daily chart that this region of resistance has 3 Fibonacci resistance levels on the daily chart, as well as representing the high region of the [a] wave to the left on the daily chart. So, this is clearly a region which we will need to take out to get the 3rd wave going in earnest.
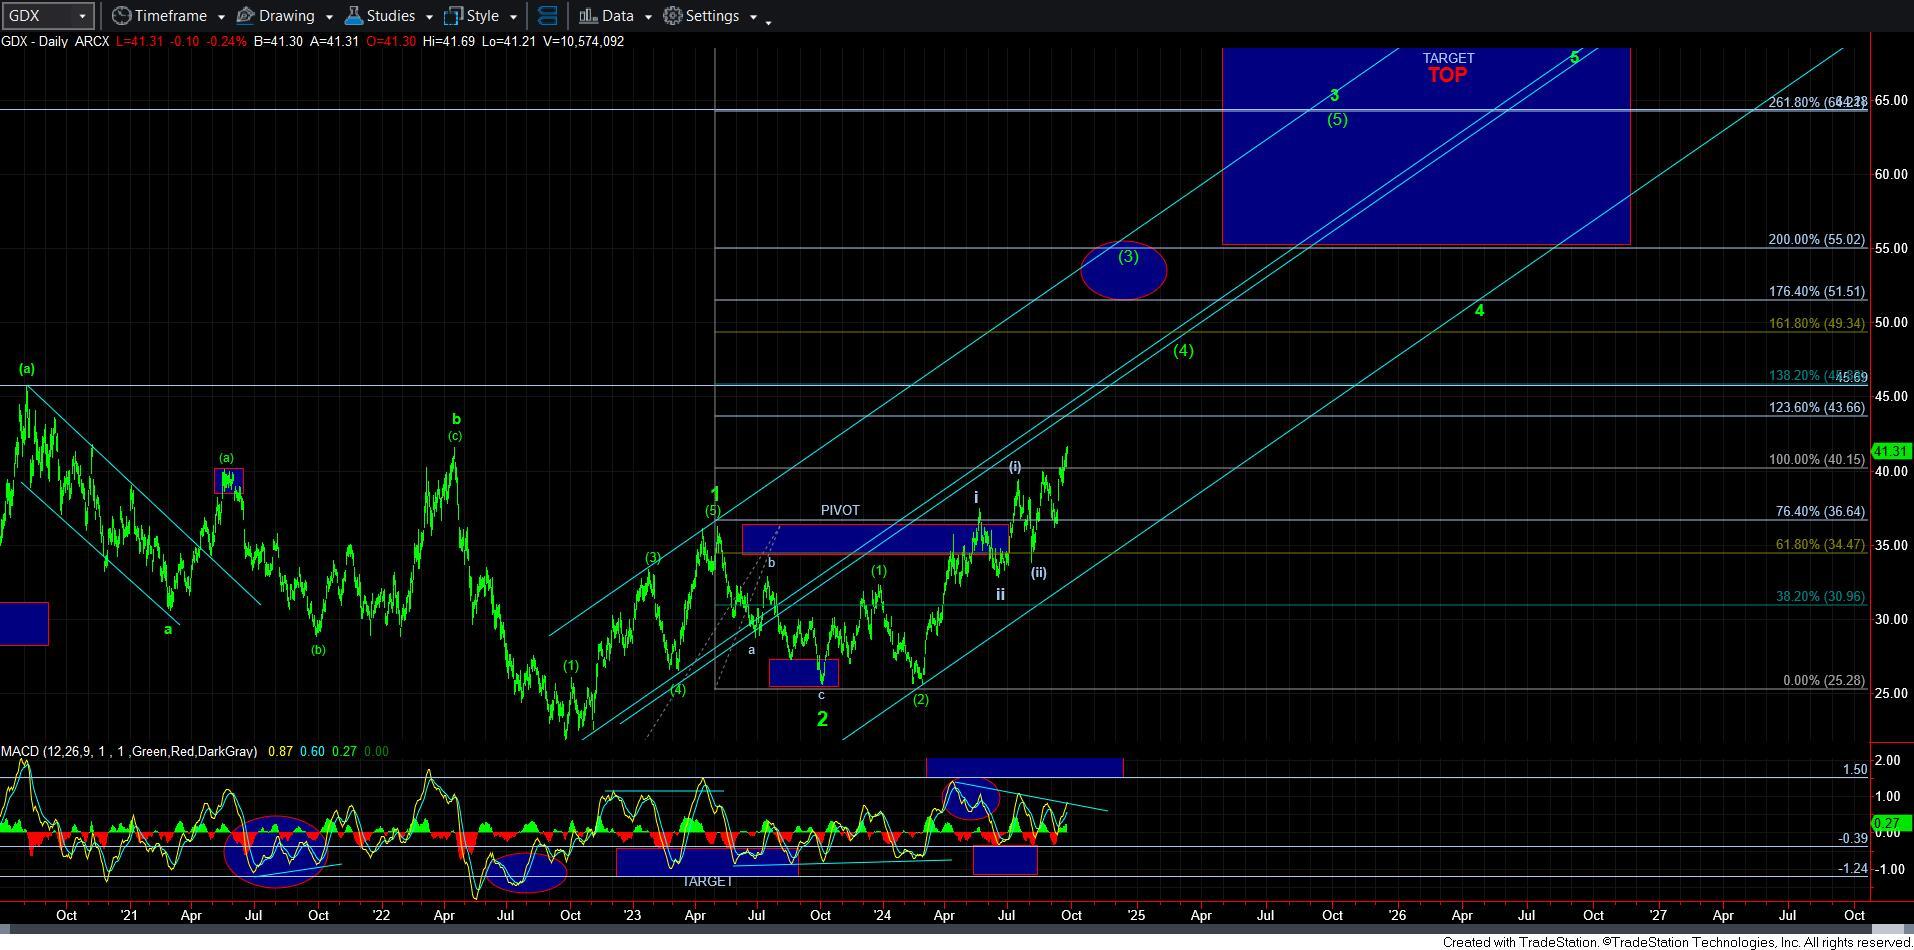
Meanwhile, GDX is still rallying nicely, but the MACD has not yet broken out. As I noted earlier, once we break out through that declining trend line, I am going to assume we are on our way into the accelerated trend channel overhead and pointing to the target for wave [3].
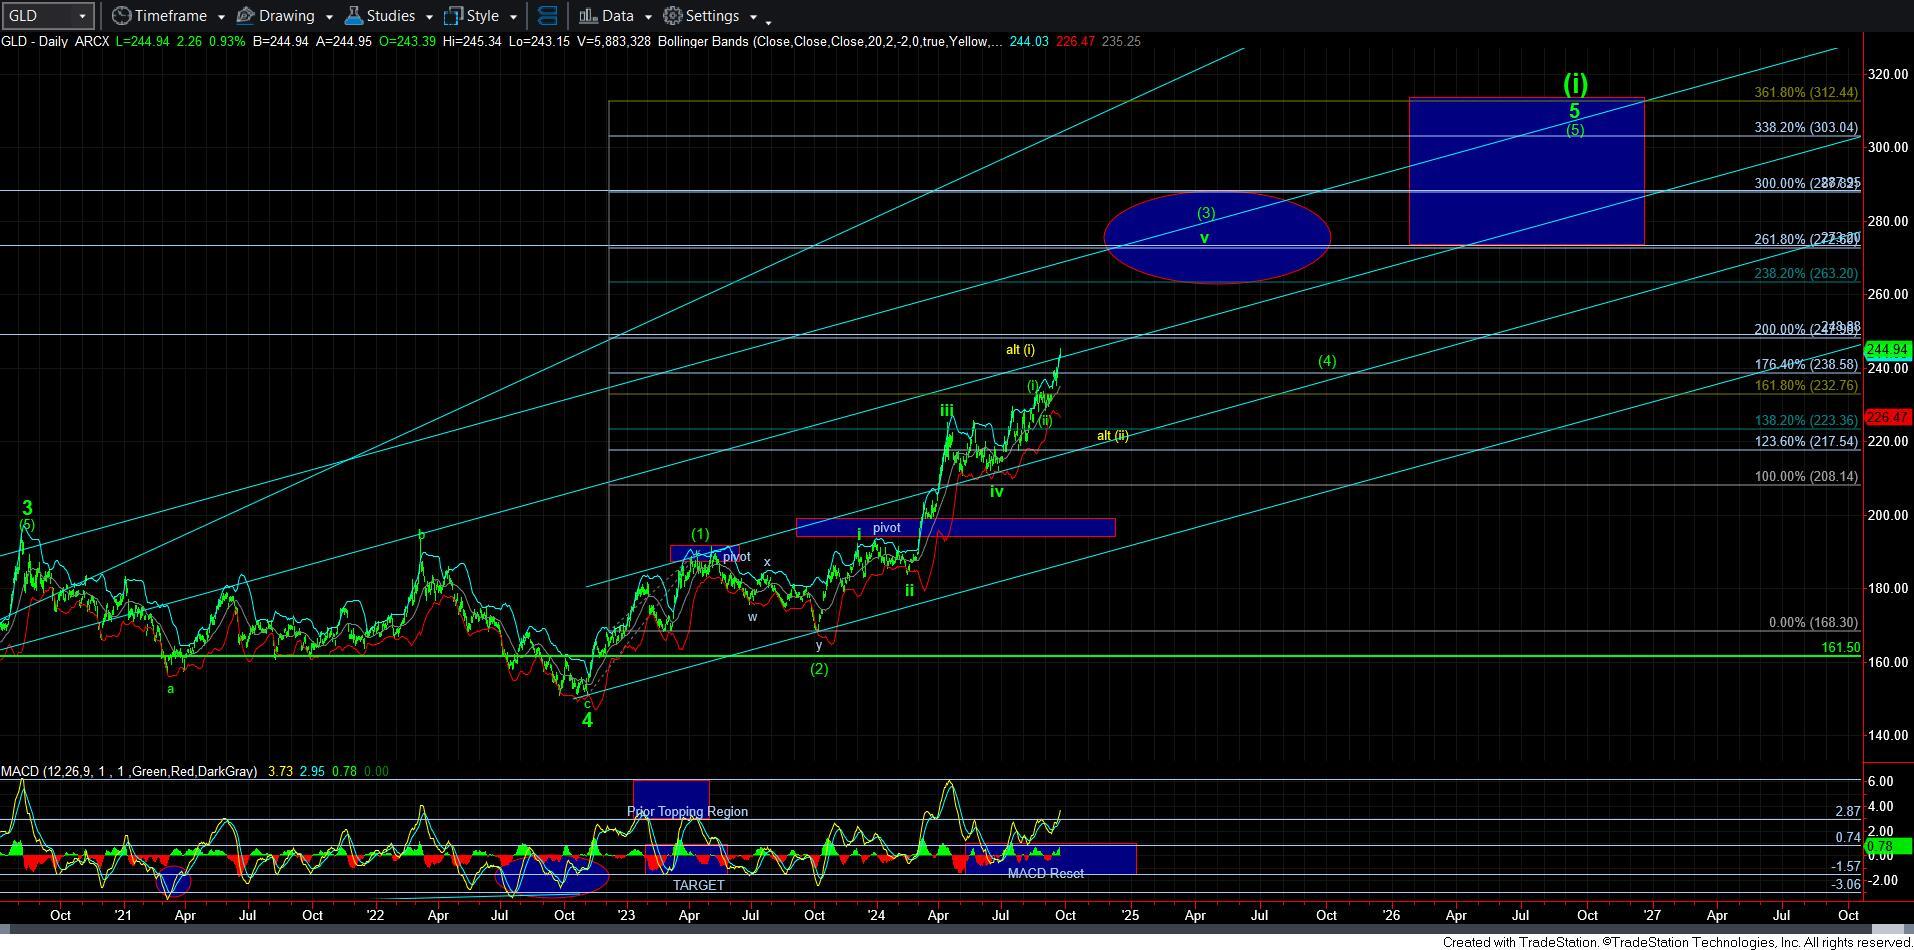
And, getting back to GLD, I am still struggling to identify a higher probability smaller degree wave count. While I believe this wave v of [3] is taking shape as an ending diagonal, I am trying to assume that we are actually in the 3rd wave of that ending diagonal, yet I will need to see us take out the next Fib resistance I the 250 region for me to be able to put that on a 60-minute chart. But, I will note that the break out in the daily MACD in GLD does begin to make this a bit more likely.
So, while GLD is doing what it has been doing for the better part of the last two years and leading this rally in the metals complex, we should still be approaching a point in time where both GDX and silver begin to catch up. While I would certainly prefer to see this break out continue along the more immediate bullish paths we are outlining, I still want to see a bit more evidence before I can be much more comfortable that we are on our way in the heart of the 3rd waves in GDX and silver.

