
Not All Airlines Are Built the Same — And the Charts Agree
 By
Levi
By
Levi
Delta, United, and American operate in the same industry. Their charts suggest they are not traveling the same path.
Airline stocks have a reputation — and not a flattering one.
The industry is capital-intensive, cyclically exposed, and perpetually at the mercy of variables no management team can fully control. Fuel prices. Geopolitics. Weather. Consumer confidence. Labor negotiations. The list of potential disruptions is long enough to fill a boarding pass.
And yet, within that difficult environment, not every airline tells the same story.
Some have rebuilt their balance sheets. Others are still carrying the weight of decisions made during less disciplined eras. Some have reclaimed all-time highs. Others remain trapped inside corrective patterns that began years ago.
The structure of price does not care about brand loyalty or frequent flyer programs. It reflects how the crowd collectively evaluates each company’s prospects — and how that evaluation shifts over time.
Among the three major U.S. legacy carriers — Delta Air Lines (DAL), United Airlines (UAL), and American Airlines (AAL) — that evaluation has produced three different patterns with specific nuances.
We will walk through all three charts momentarily. But first, the fundamental picture is worth framing, because it supports what the charts are already suggesting.
Lyn Alden provides a grounded perspective on Delta specifically:
“DAL has been one of the stronger operators among the large US airlines, but it remains a tough industry to succeed in. Along with Southwest, Delta has an investment-grade credit rating, while United and American do not. Delta’s stock has managed to reclaim new all-time highs, but still with poor 10-year total returns. War-related higher fuel costs are the latest headwind that Delta has to face, and summer months are likely to pressure jet fuel prices even more than the spring has if the Strait of Hormuz remains closed by then. Delta and other airlines might make for a decent ‘Strait Re-Opening’ trade if a trader has a view on that timeline, but one should do a lot of due diligence before staying too long in the name.”
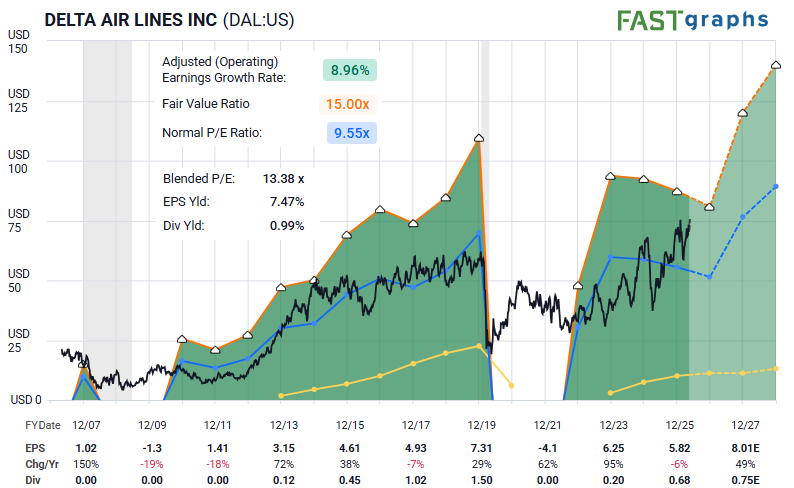
The FAST Graph reinforces the quality gap. Delta’s earnings growth rate sits near 9%, with a blended P/E of 13.38x and an EPS yield of 7.47%. The stock is not cheap by its own historical standards, but the operating foundation beneath it appears more durable than what American or United currently offer.
That fundamental differentiation is visible on the charts in a way that is difficult to ignore.
Let’s walk through all three.
Listening To Sentiment
Each structure is communicating a message. Some messages are clearer than others. First, what can we glean from American Airlines?
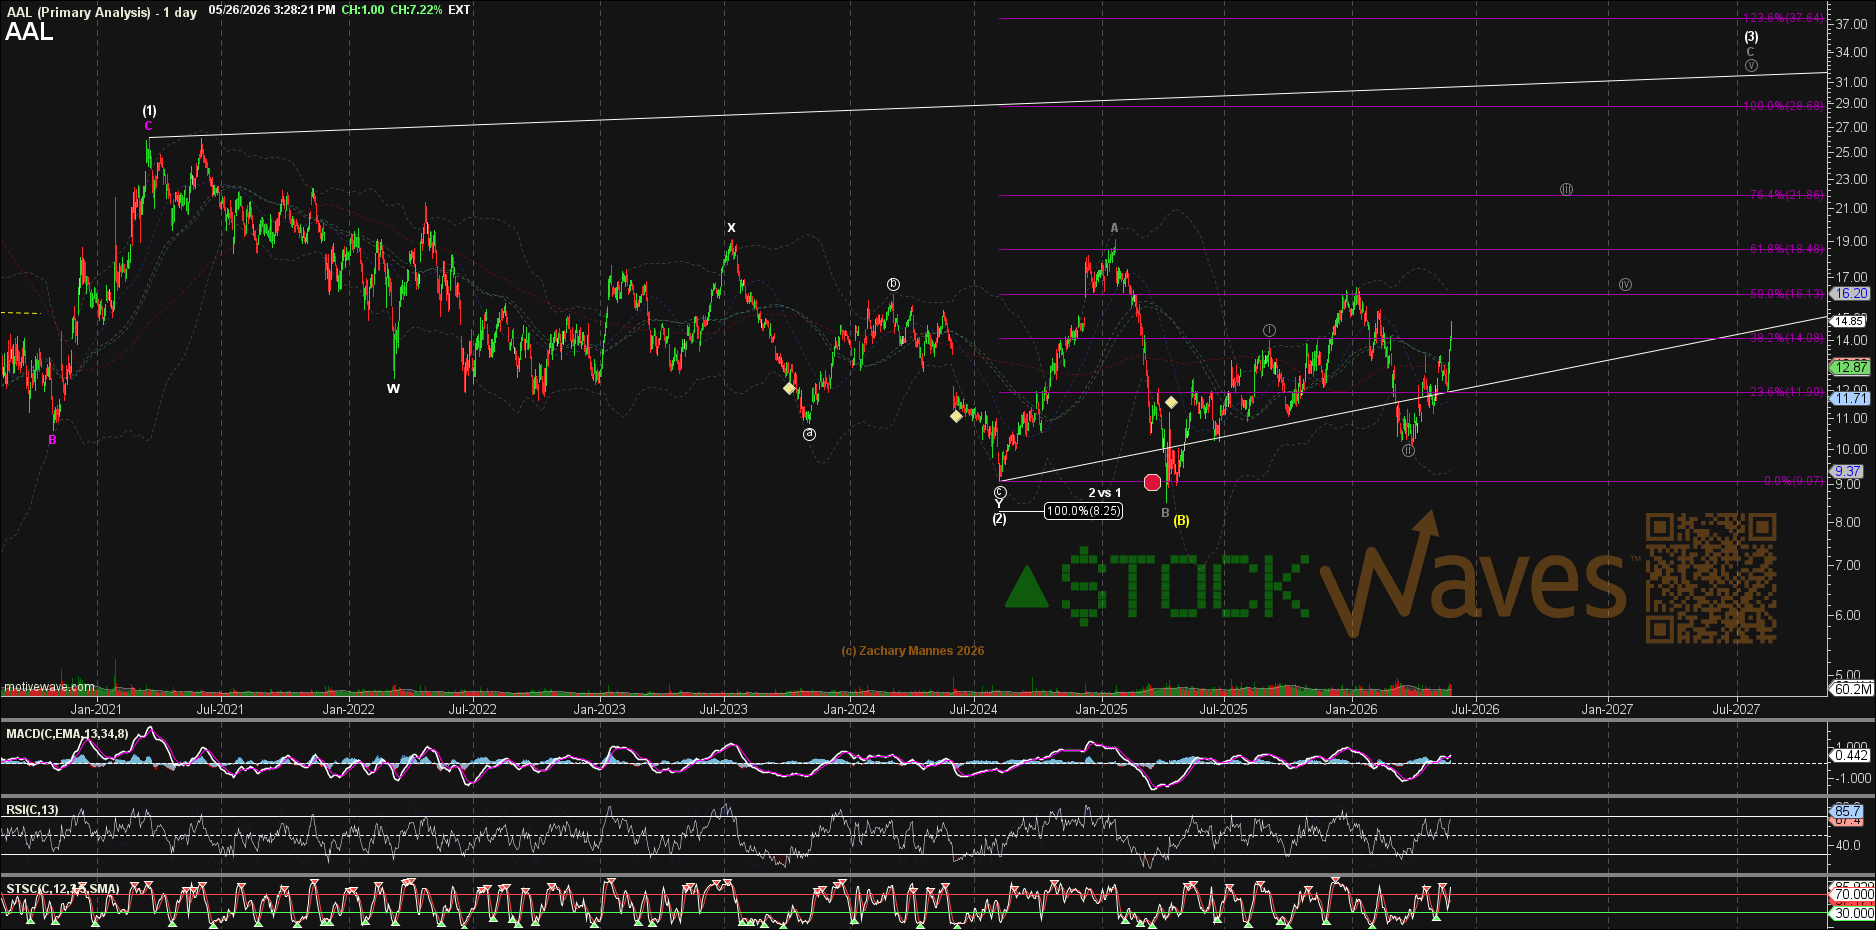
There are simply moments when the subwaves do not provide enough clarity to support strong conviction. That is the case with AAL for now.
The possible expanded corrective move between circle ‘i’ and circle ‘ii’ creates ambiguity, and the prior low is somewhat nebulous as well. That does not mean AAL lacks upside potential. It means the current structure is not offering the same degree of visibility we can find elsewhere.
For that reason, the next two charts offer more useful guidance.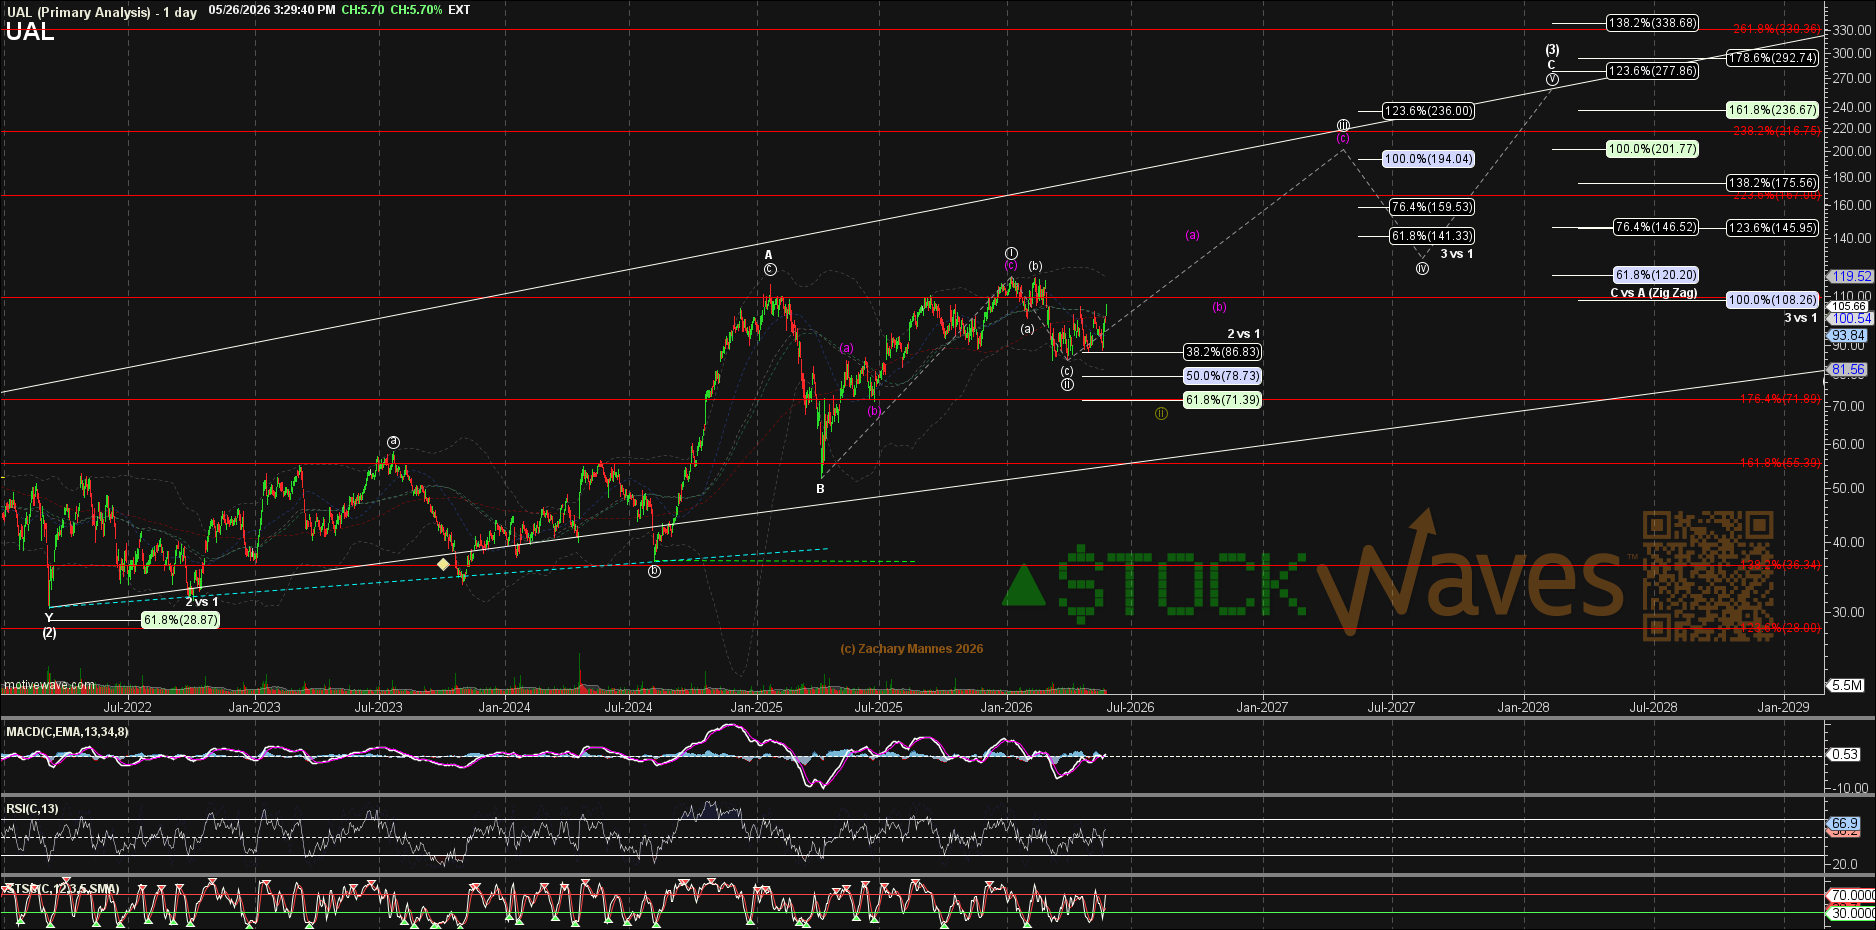
United presents a cleaner picture.
The white path shown here is Zac’s primary count. The alternate route for the lower circle ‘ii’ in gold remains possible, but it does not become the preferred path unless price takes out the $86 region.
With price developing in a diagonal and currently in the (a) wave of circle ‘iii’, the structure projects materially higher into 2027 if support continues to hold. The path may not be smooth — diagonals rarely are — but the roadmap is far more defined than what we currently see in AAL.
And then there is Delta.
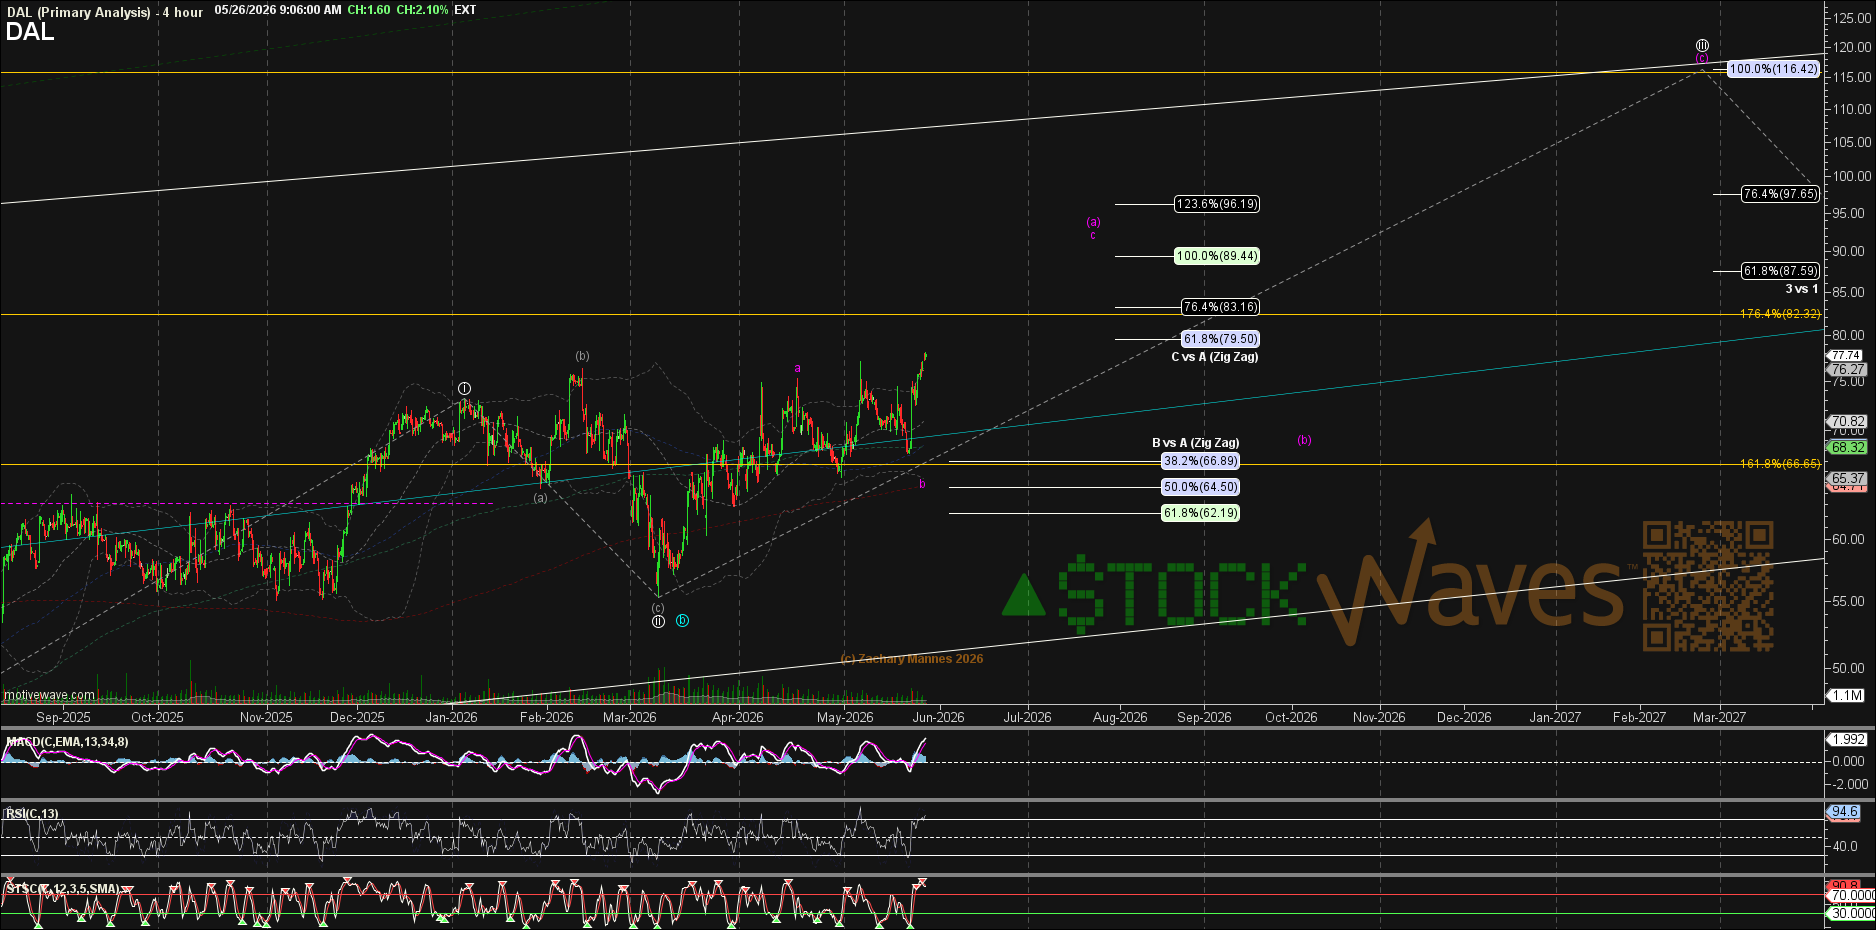
Delta appears to offer the greatest clarity of the three.
The structure of price suggests that, for as long as DAL remains above the $67 area, the next advance should target the $90–$96 region for wave (a) of ‘iii’.
That does not make Delta immune to airline-specific risk. Fuel costs, geopolitical disruptions, and broader consumer demand still matter. But when we compare the three major legacy carriers through both fundamental quality and price structure, Delta stands apart.
Conclusion
Three airlines. Three charts. Three very different conversations between the crowd and each stock.
AAL carries enough structural ambiguity to make conviction difficult. UAL offers a more defined path, but one that requires patience and tolerance for the inherently choppy character of a diagonal. Delta stands apart — not because the airline industry has suddenly become easy, but because both the fundamentals and the structure of price appear to be pointing in the same direction.
Investment-grade credit. Stronger operational execution. Earnings growth that outpaces its peers.
And a wave structure that, for as long as $67 holds, points toward the $90–$96 zone as the next major destination.
Airlines remain a difficult industry. Lyn’s caution is well placed. Due diligence is not optional in this space, and no chart removes the risks that come with fuel prices, geopolitics, labor pressure, or the broader economic cycle.
But when a stronger operator also presents the cleanest structure, that alignment deserves attention.
Not all airlines are built the same. The charts are saying the same thing.
