No High Probability Calls
 By
By
Thursday's mood pattern implied some turbulence for the stock market, and an attempt to calm things down. The turbulence was definitely there, as well as what appeared to be the initial phase of a calming down. Yet, the market ended sharply down. Our Market Mood Indicator (MMI) was looking for an up close, but it was cautioned not to expect an easy or straightforward trading day. On the plus side, the market gave us the "sharp drop by October 5" from the weekly forecast with this drop that began Wednesday. The question is: Is it over?
Friday's mood pattern usually points to risk aversion, yet MMI is calculating an up close in the market. Does that mean that the bears get scared and shorts get covered? Whatever it means, it's probably not a good idea to simply assume that the bottom is in and hope for the best. There are no high probability calls at the moment. It's treacherous trading territory.
Our MMI is based on analysis of search data, and current Internet search theme MMI inputs are men, sports, losers, hero.
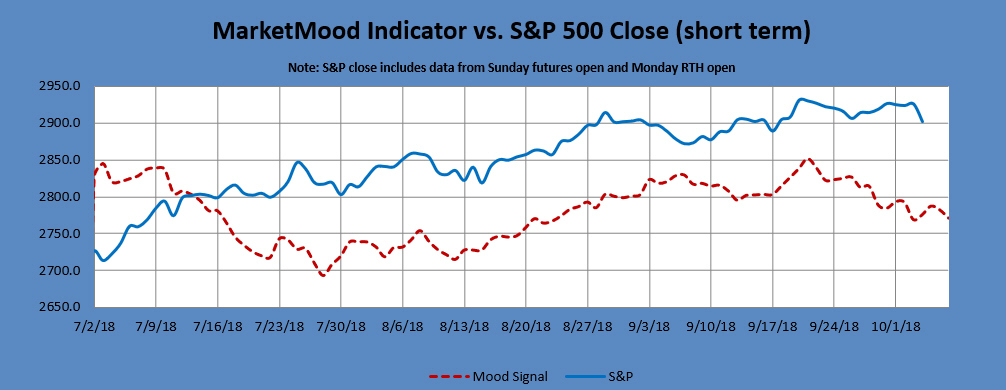
Here's how the mood signal has tracked with the actual S&P 500 moves short-term.
Next 3 Days:
| Date | Daily MMI |
|---|---|
| 10/5 | Close Up |
| 10/8 (open) | Down |
| 10/8 |
Note: Changes to next day MMI signals occur about 5% of the time, and will be announced in updates as well as the daily report should they occur. Same day signals will not change. Day 2 and 3 signals reflect the most current information, and are subject to change. The default trade per the daily signals is executed at market on close. except on Mondays, as there is a signal for Monday open (i.e. "weekend close") and Monday close. The daily MMI signals are correct as daily direction calls about 63% of the time. Please manage your trading risk accordingly.
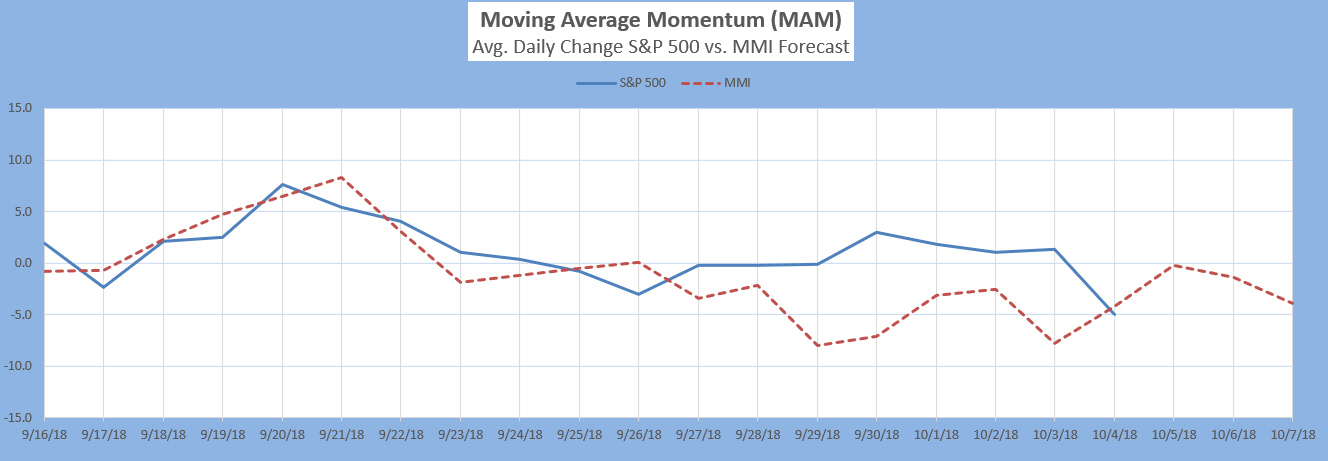
The Moving Average Momentum (MAM) Indicator last signaled a major trend change with a major LOW indication between April 18-25 (there was a closing low on the 25th which repeated slightly lower on May 3-- a major low).
The last few MAM signals (significant trend change, no direction specified) have only confirmed that the current move in the S&P is most likely an Elliott Wave diagonal.
Intermediate Term Forecast:
The primary outlook is that a corrective move is in progress. Weekly charts are nearly flat over the next several weeks. Monthly charts show (roughly) October as a low.
MM MACD signal is unconfirmed SELL and the intermediate trend is UP. There is no swing trade signal.
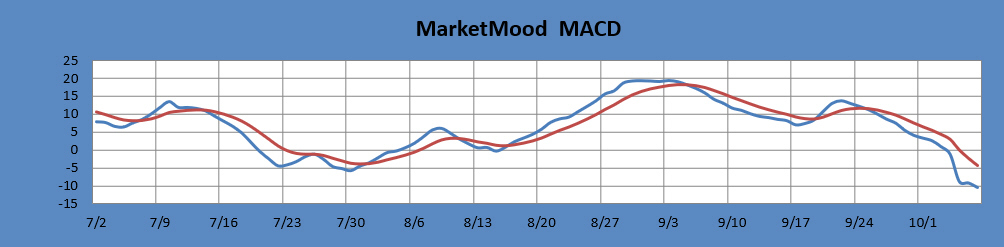
The MM MACD is similar to a standard MACD, except that it uses the MMI signal data to extend several days beyond today, while the standard MACD relies solely on historical market data.
Long Term Forecast:
Looking at the charts below, the long term forecast chart shows sentiment turning down from the same "ceiling" as it did the end of June. Yet, so far, the market is undaunted and just keeps climbing. Long term trend strength per the LTTI is back above 30, which is about as high as it has gone this year. The trend is strongly bullish, but may not be sustainable. Something has got to give, and it should be fairly soon.
The long term forecast remains strongly bullish. The bullish long term trend is indicated by the generally positive divergence between the stock market and the mood generated forecast (see long term chart below). The MM Long Term Trend Indicator (bottom chart) which is derived from this divergence, indicates: Bullish Trend, hold long positions. The MM LTTI has had this same bullish indication since 12 Sept., 2016.
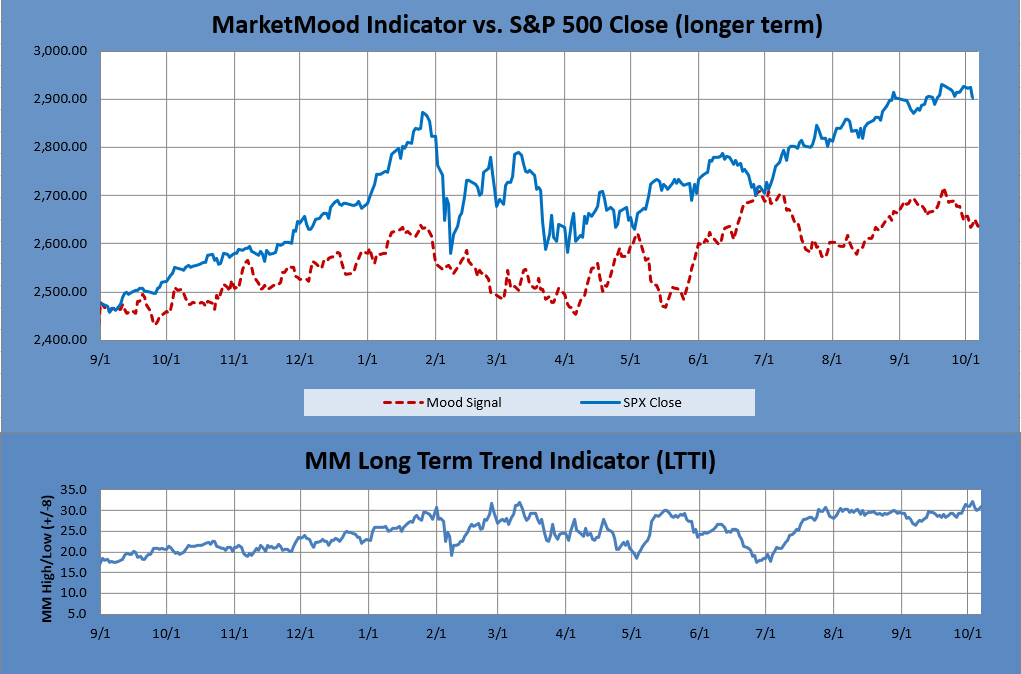
The MM LTTI measures trend strength using the divergence between the market trend and the forecast trend. A move above +8 or below -8 is bullish or bearish respectively. A value over 10 or under -10 followed by a move back through +/-8 signals a high or low is likely in. A subsequent move below +5 (or above-5) signals a trend change to bearish (or bullish).
