No Changes, Pavlov’s Dog Heading into Holidays
 By
Ricky Wen
By
Ricky Wen
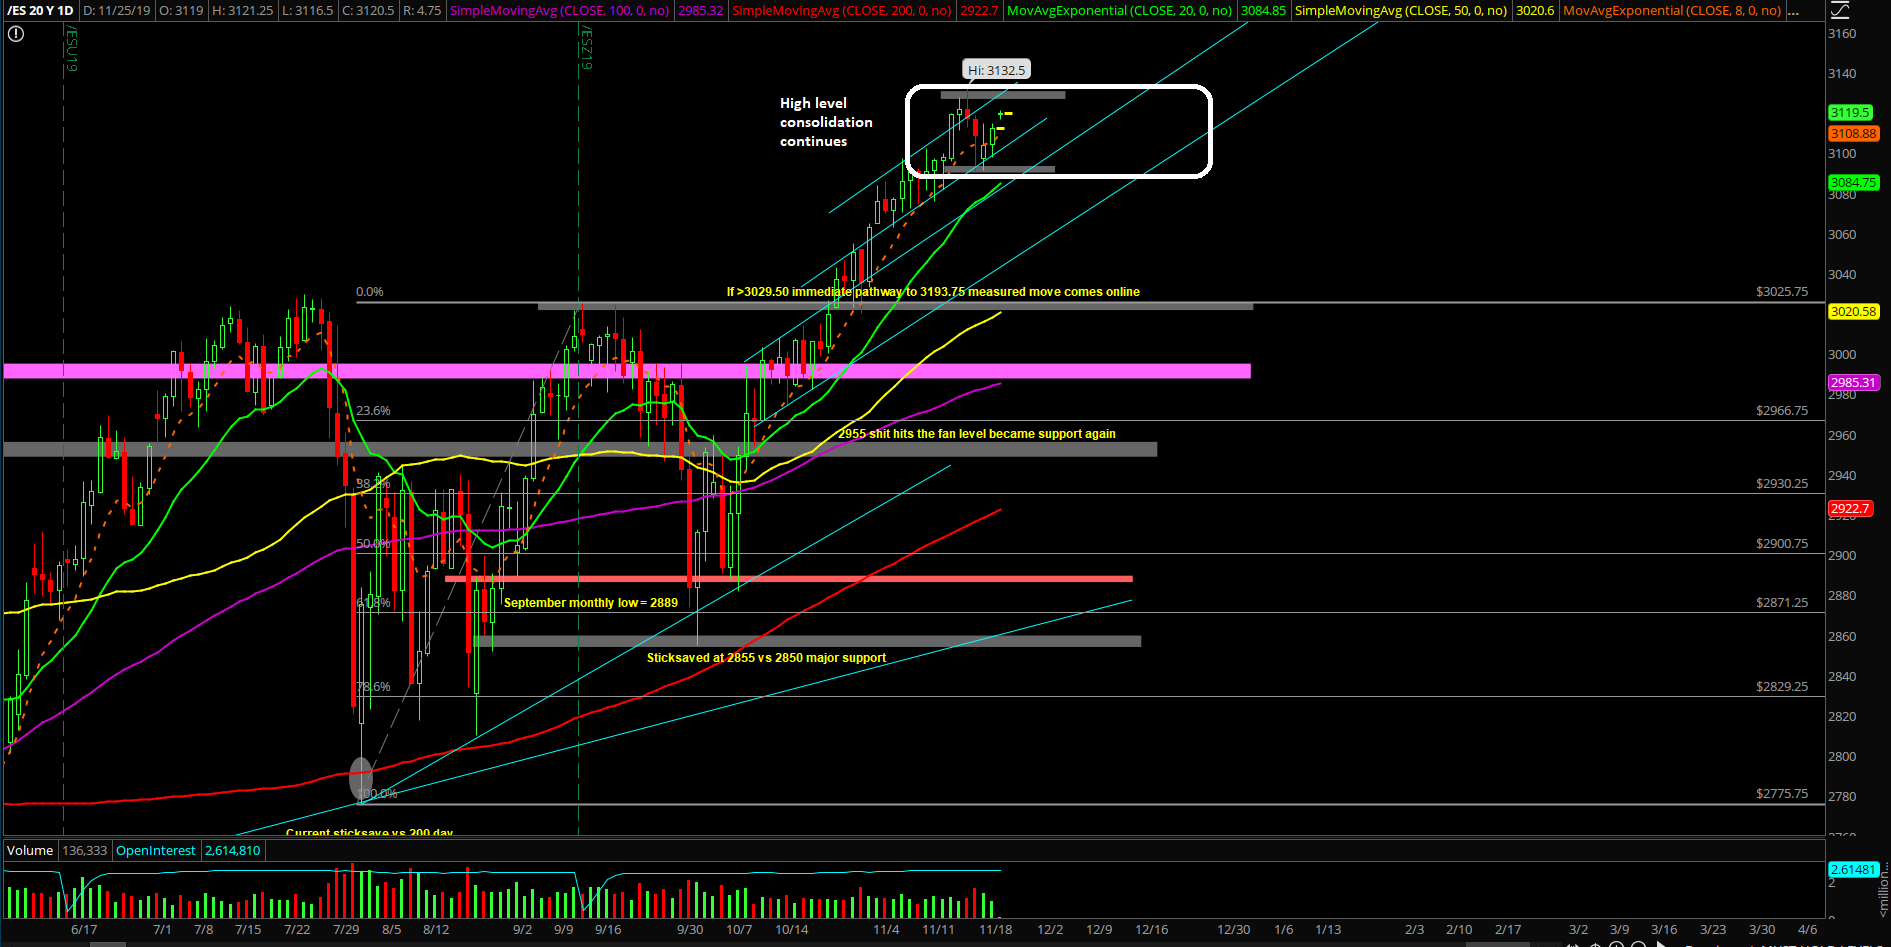
The third week of November played out as another round of high-level consolidation as the price action resets its internals and rotations across the sectors with the horizontal grind.
The same old pattern that has been occurring for the past 7 weeks after the market makes a significant higher all-time highs relative to a key level. The bulls remain so impressive and resilient that even a touch of the daily 20EMA was not allowed last week when it got so close. This showcases that market participants are still buying at key immediate trending support levels rather than just waiting until the more significant daily 8/20EMA to stick-save each day’s low.
The main takeaway from the third week of November is that nothing has changed with the BTFD thesis when the market remains in a trending mode and especially when above daily 8EMA/20EMA. For reference, the Emini S&P 500 (ES) is still trending above the daily 8EMA for 31 sessions (disregard the one session on Thursday last week that closed 2 ticks below it). Overall, it feels like we’re all Pavlov’s dog as we head into one of the most important holiday weeks before year end.
What’s next?
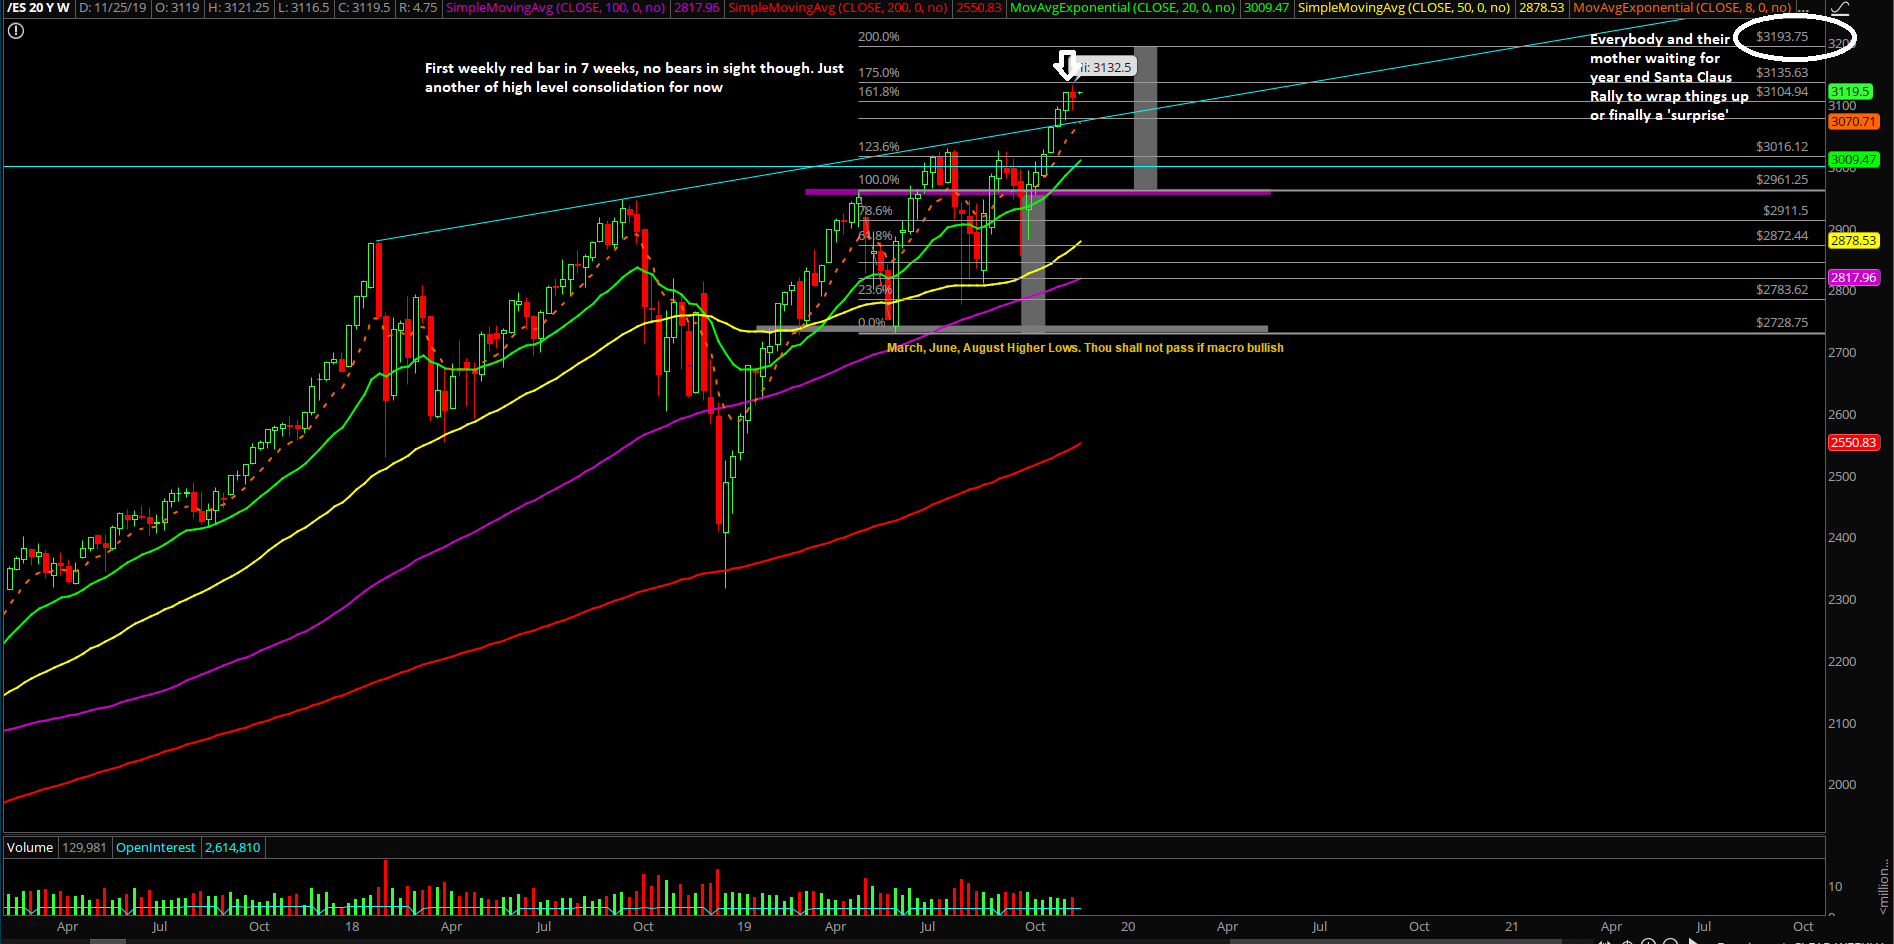
Friday closed at 3112 on the ES, and it was the first red weekly candle closing in 7 weeks after the 6 weeks of grind up continuation. Essentially, the market lost a total of 7 points last week with the high-level consolidation pattern as Friday to Friday’s closing print was 3119->3112.
Summation of our game plan:
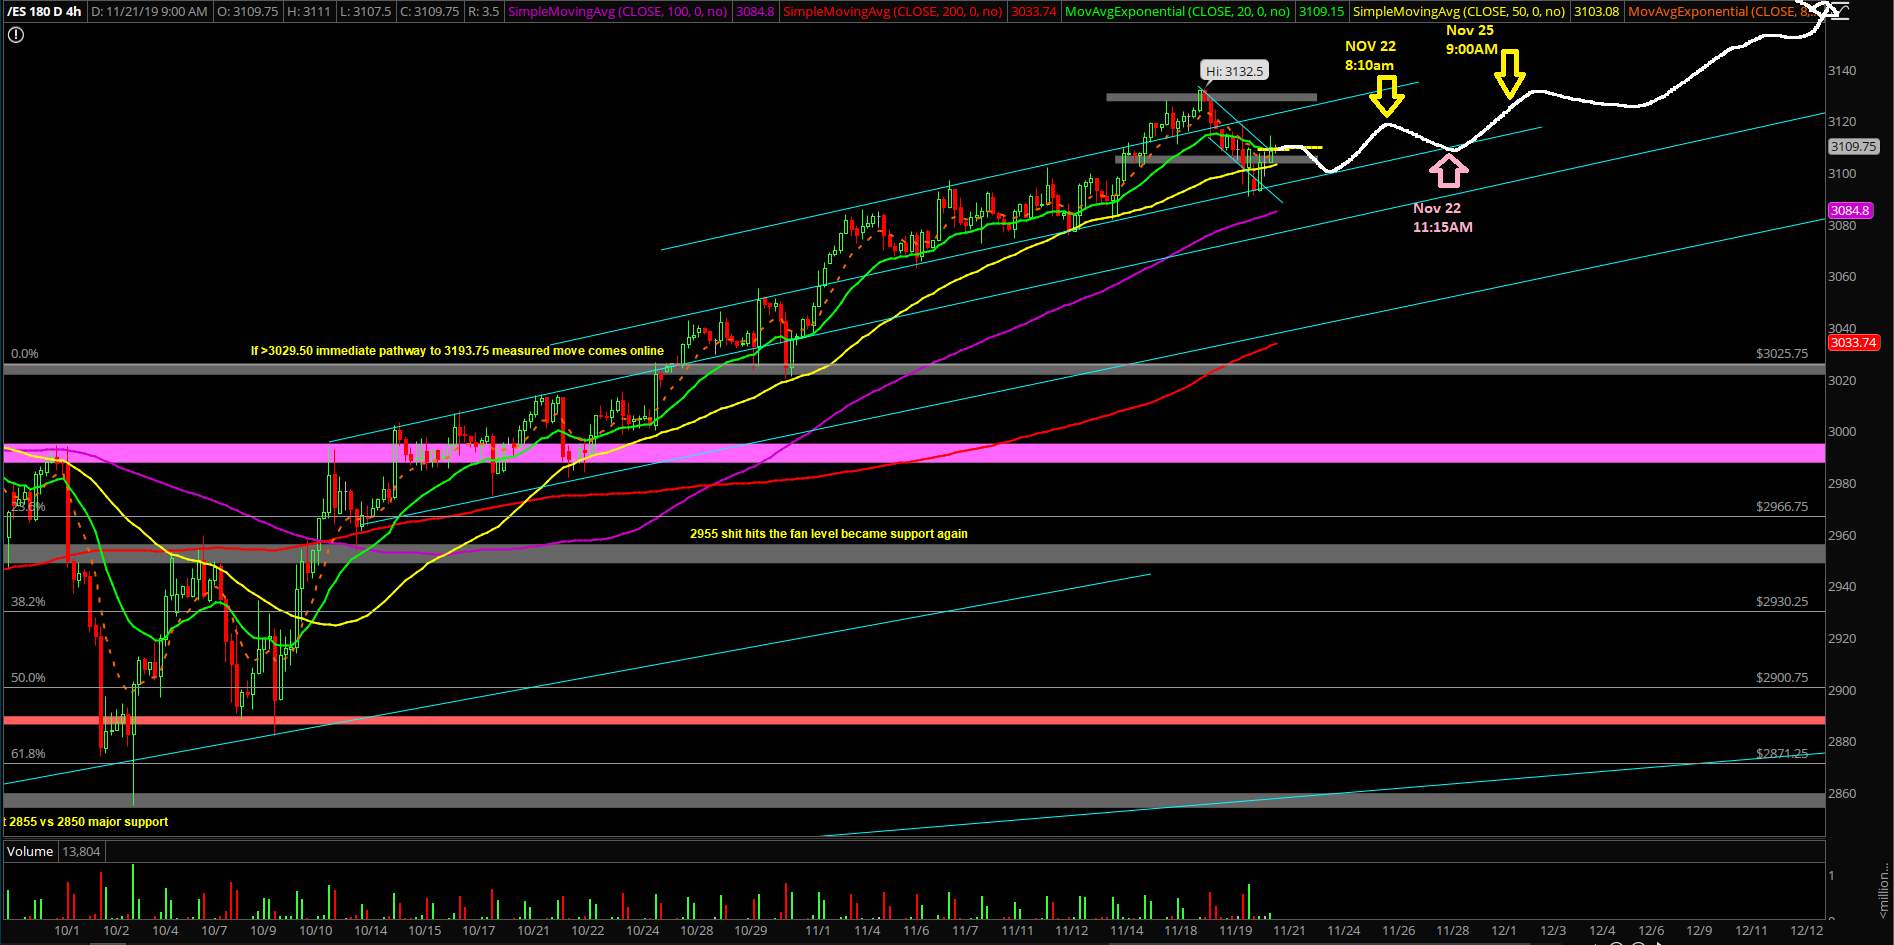
- 4hr white line projection remains king for now when above 3098 going towards 3150 first as Friday bottomed perfectly vs. our 3100 higher lows setup. Keep trailing longs or buy more longs
- Market action showcasing some sort of grind/trend day setup for now given the gap up and go potential for today
- The train will accelerate if/when breaks above last week’s 3132.50 range high later this week
- The key immediate trending supports for this week are located at 3098 and 3090 where the latter represents the prior week’s low
- Price action is electing to just keep grinding up towards our macro 3193.75 as it has also aligned on the short-term with the Friday Nov 15th’s decisive close above 3100
- Failing to hold this immediate upside pressure by remaining above 3090 would indicate either a) another horizontal high level consolidation phase in a bigger range or b) going to mean revert into the daily 20EMA after 1 month [BB and Keltner ranges being pushed to limits for reference, they only matter if price reverts]
- For reference, the ongoing consolidation has allowed last week’s low of 3090~ to coincide with the trending daily 20EMA as it remains a powerful trend for the past 30~ sessions at mid 3080s~
*There’s something to consider as a ‘surprise’ would be a quick steep drop/mean reversion before year end that backtests close to the 2955-2984 region to stopout/shakeout more of the weak hands before more ramp into year 2020 and beyond. In that scenario, we would think that could act as another significant buying opportunity similar to Dec 2018 given the risk/reward due to a backtest of the most significant levels/region. This is just something to ponder about for now because there are zero concrete indications of any significant pullback for now.
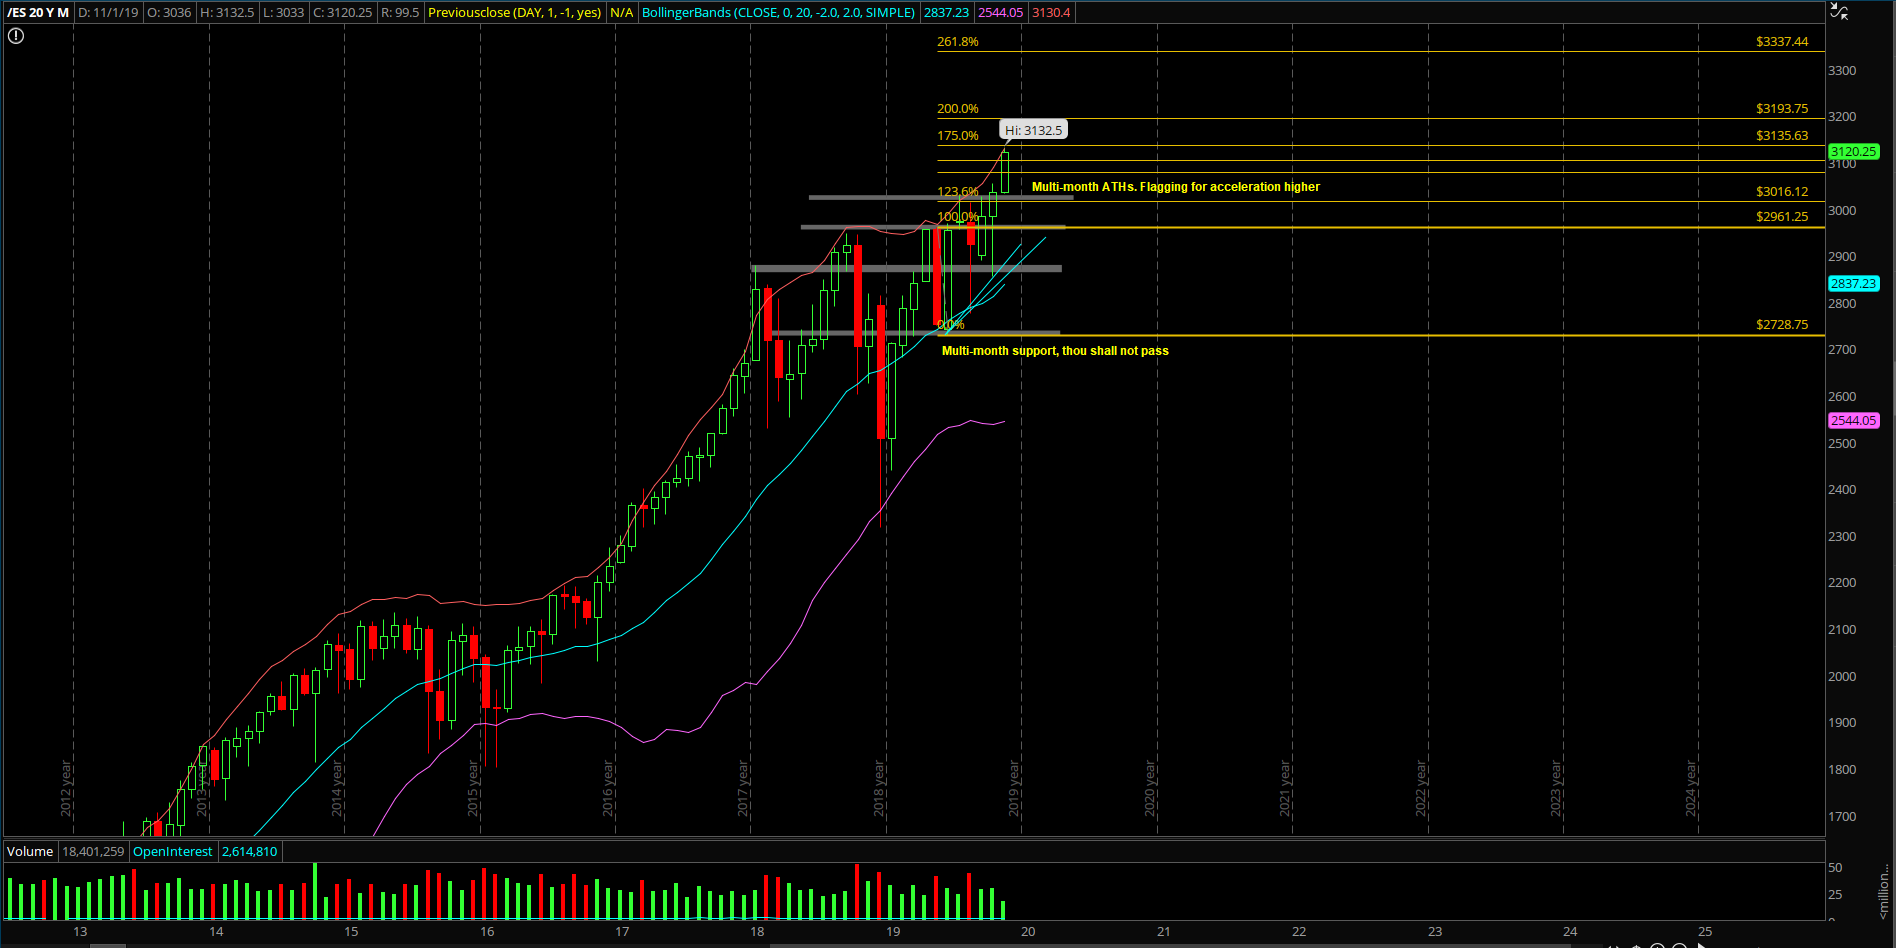
Macro Weekly/monthly chart timeframe:
For these timeframes, when above 2955 and 2984, all dips are considered buyable going towards 3193.75 into year end closing print or year 2020. This is especially true when price remains immediately above 3000 for the short-term trend. Also, the trend remains strong this year given the +20% YTD performance thus far and it’s likely has more left in the tank given the multi-month bullish consolidation that has been established since the Dec 2018 lows and then subsequent range of 3029.5-2726 since March 2019. For immediate/aggressive trend followers, whenever price action is trending above or below the daily 8/20EMA with an established macro trend on the weekly/monthly charts, then you have the golden goose setup of aligning the micro with the macro.