Nightly Cryptocurrency Report: Calm Before the Storm
 By
Ryan Wilday
By
Ryan Wilday
Summary:
We are back to moving slowly. The good news is we have broken out of the triangle structures that began to form way back in June, so the blood should be flowing a little faster now and based on the minor degree we are in now, the consolidations should be minor as well. Every once in a while you can see a minor correction elongate in time, but I have no reason to expect that. There is very little change to my micro counts, from yesterday. However, I want to remind that over $6200 Bitcoin (bitstamp), and $212 Ether (Bitmex) I personally will not hold on for lower targets. But until those are breached, I have every reason to expect we'll at least see $4600-4800 Bitcoin, and $120 to $160 Ether.
Bitcoin:
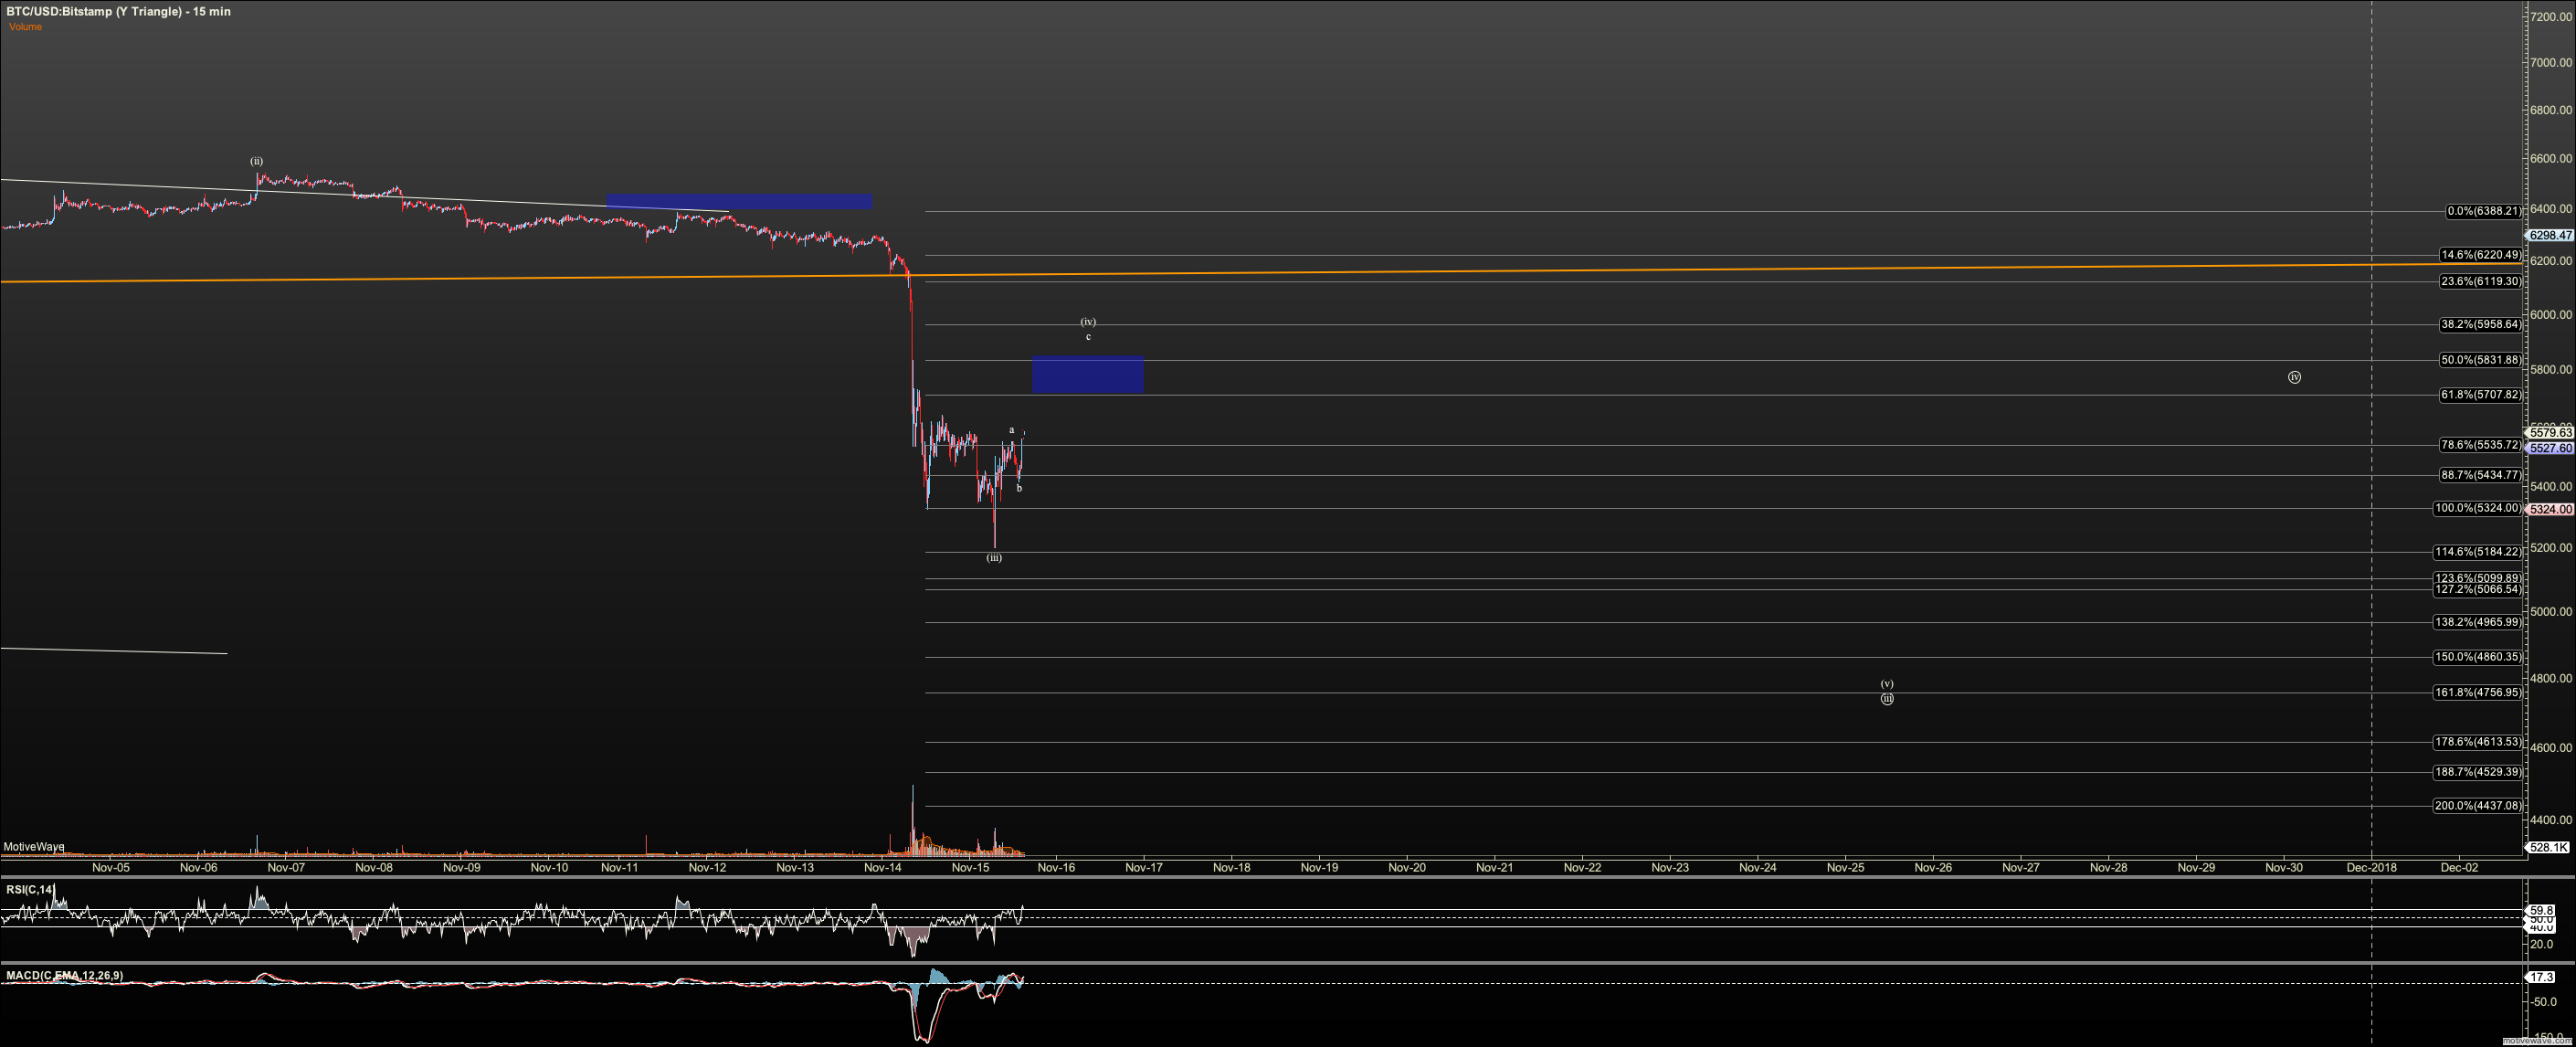
Nano resistance for Bitcoin is $5830 Bitstamp. Over that level first opens up the potential of a diagonal with a high 4.
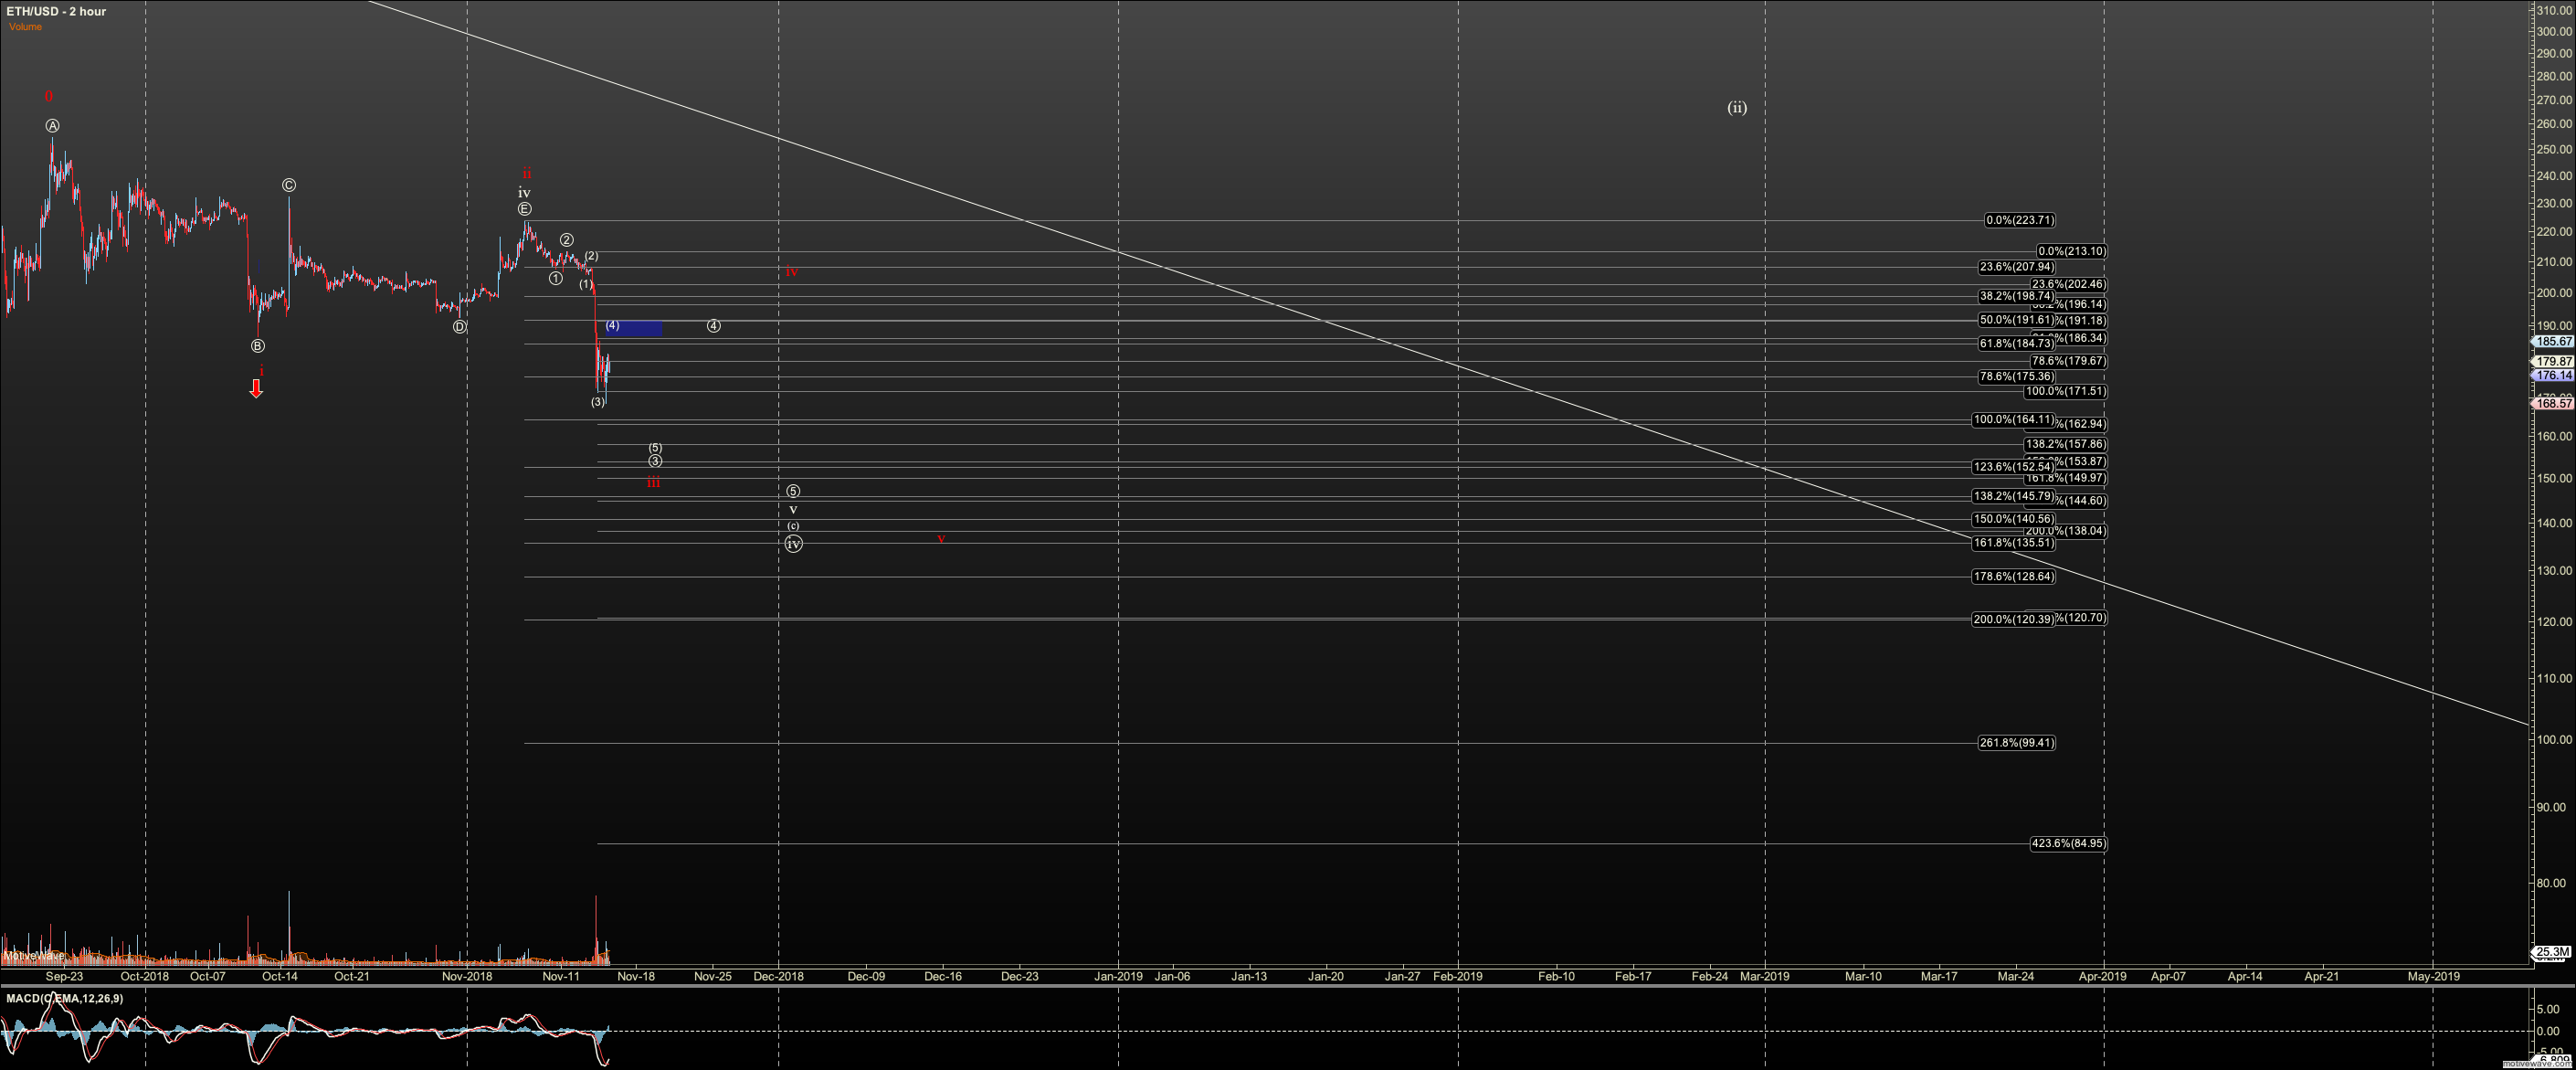
Ethereum:
Nano resistance on Ether is $191 on my global chart, which is roughly $185 bitmex. Over that level, and I see us in my red count, an ending diagonal.
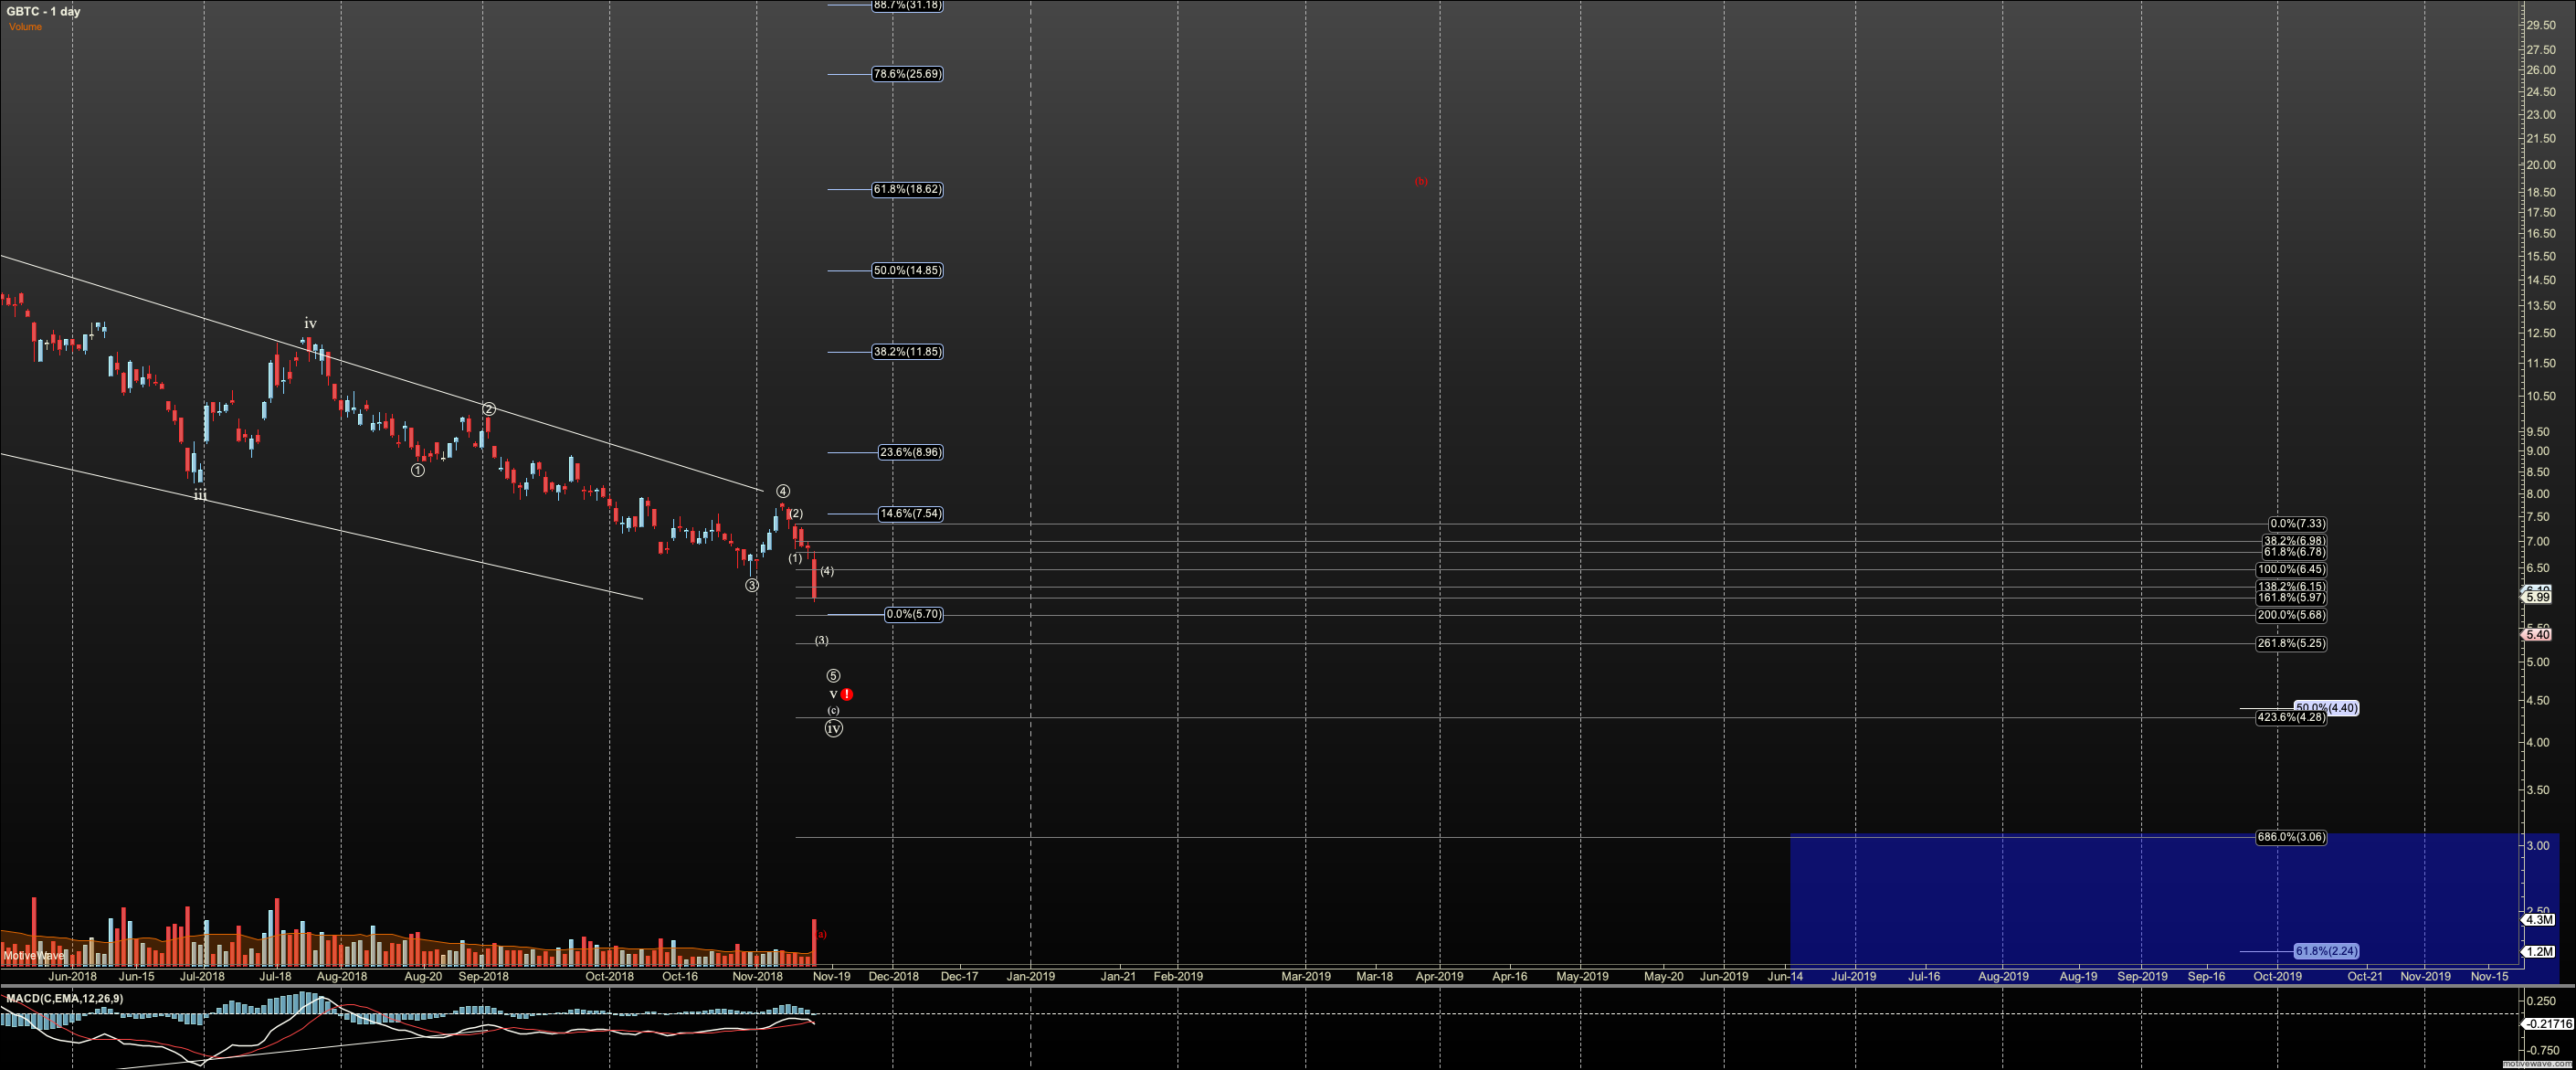
The GBTC chart is a tough one and so I'm focused on BTC, until it shows 5 waves up. But my best take on a target is in the $5 to $5.25 region
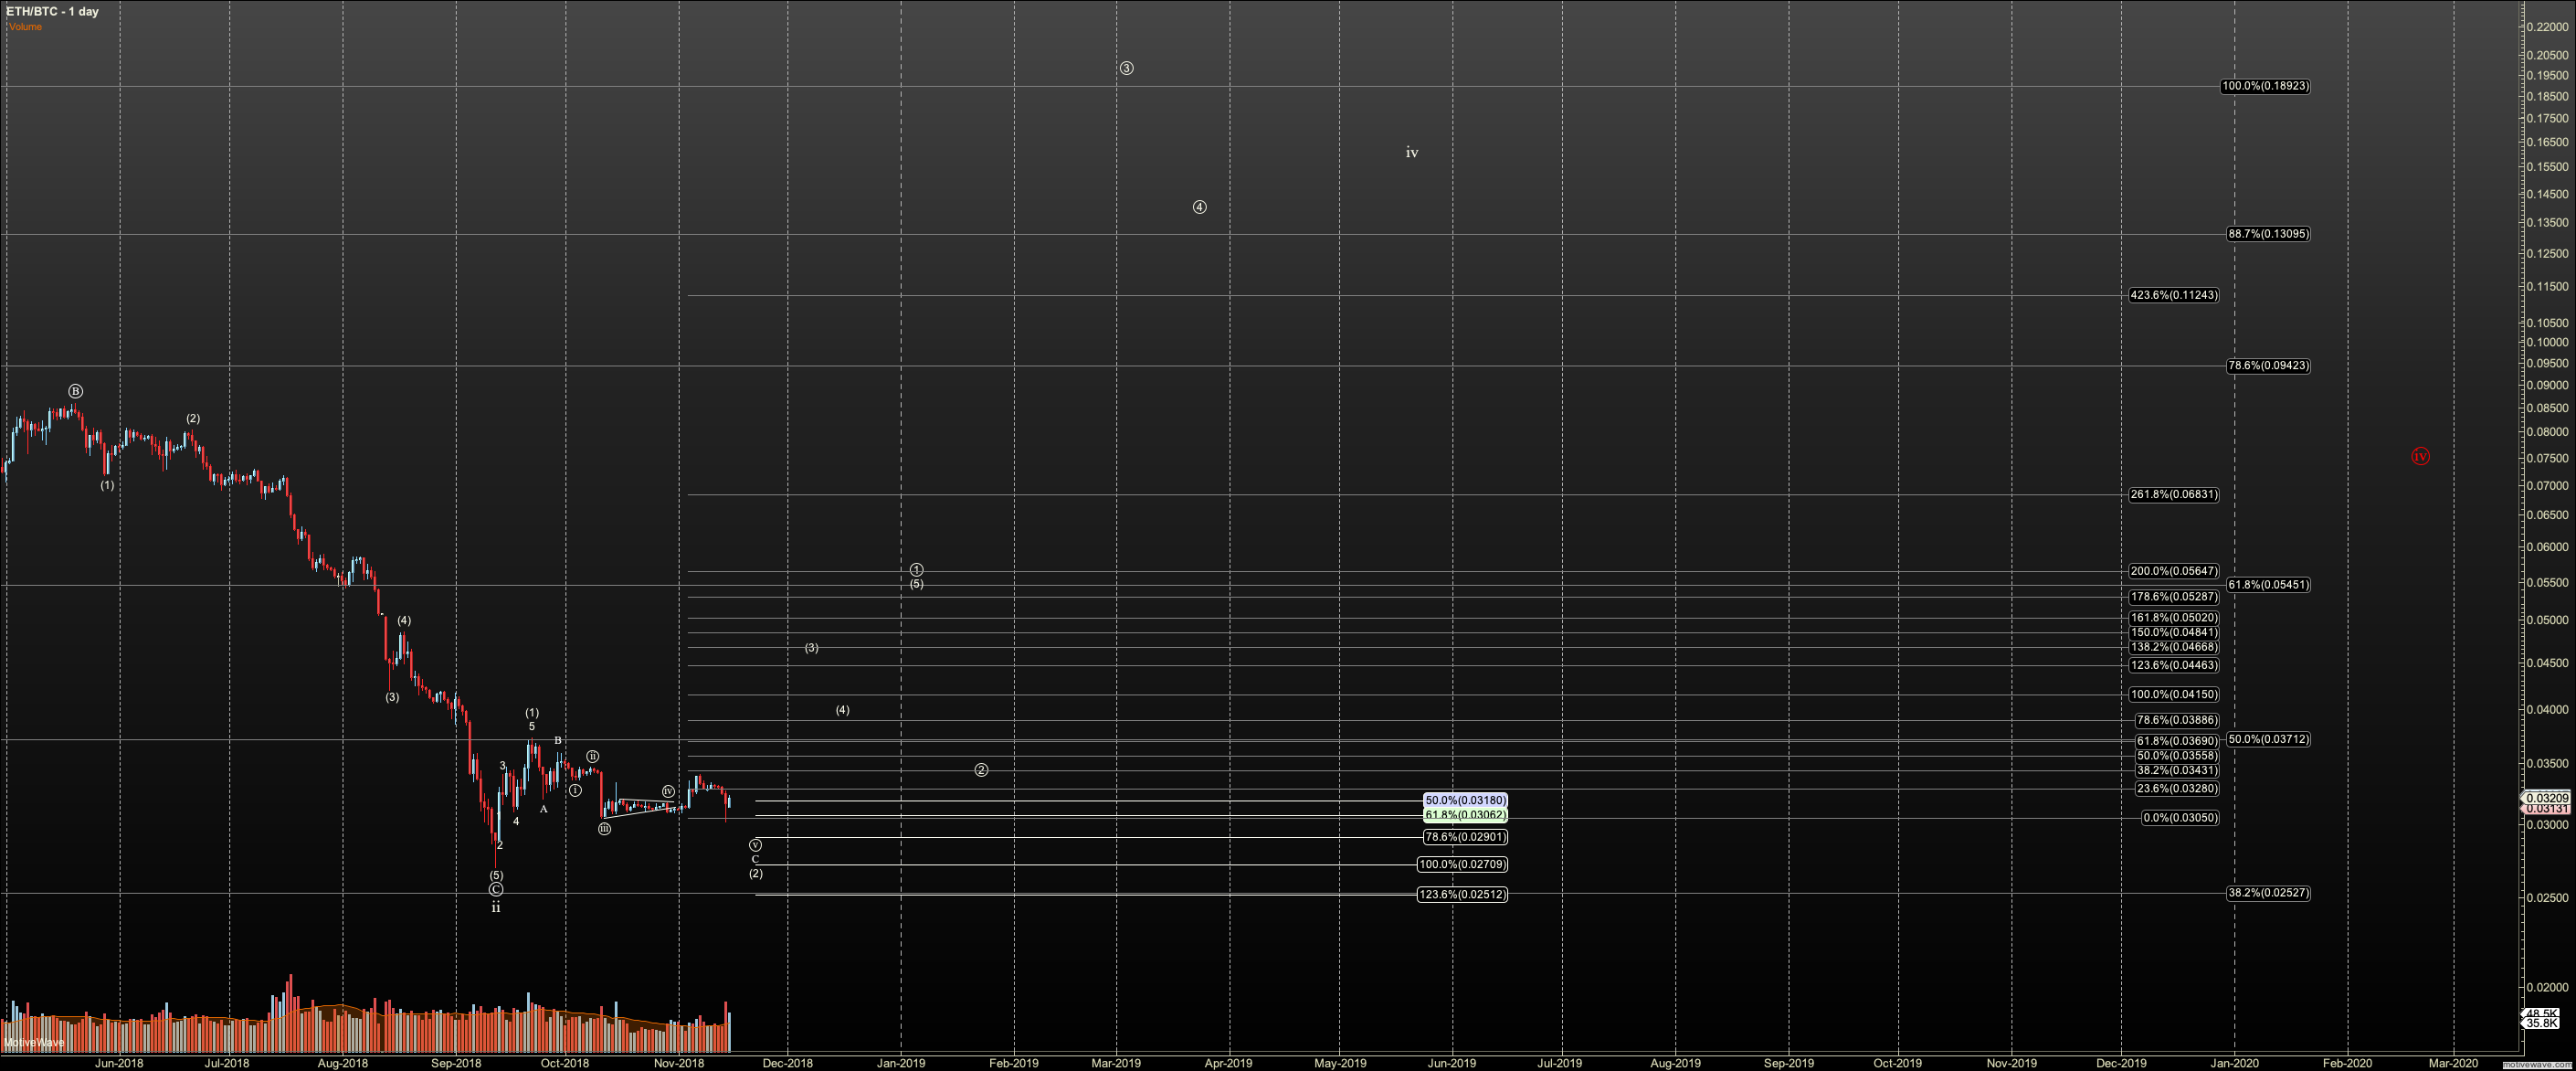
ETHBTC pulled a strange move in that it put in a triangle, dropped below it, rallied than broke it again. This opens the door to .029. But this pair is bullish until it breaks that level strong and lasting.
The Long View (Monday only Reminder)
Bitcoin:
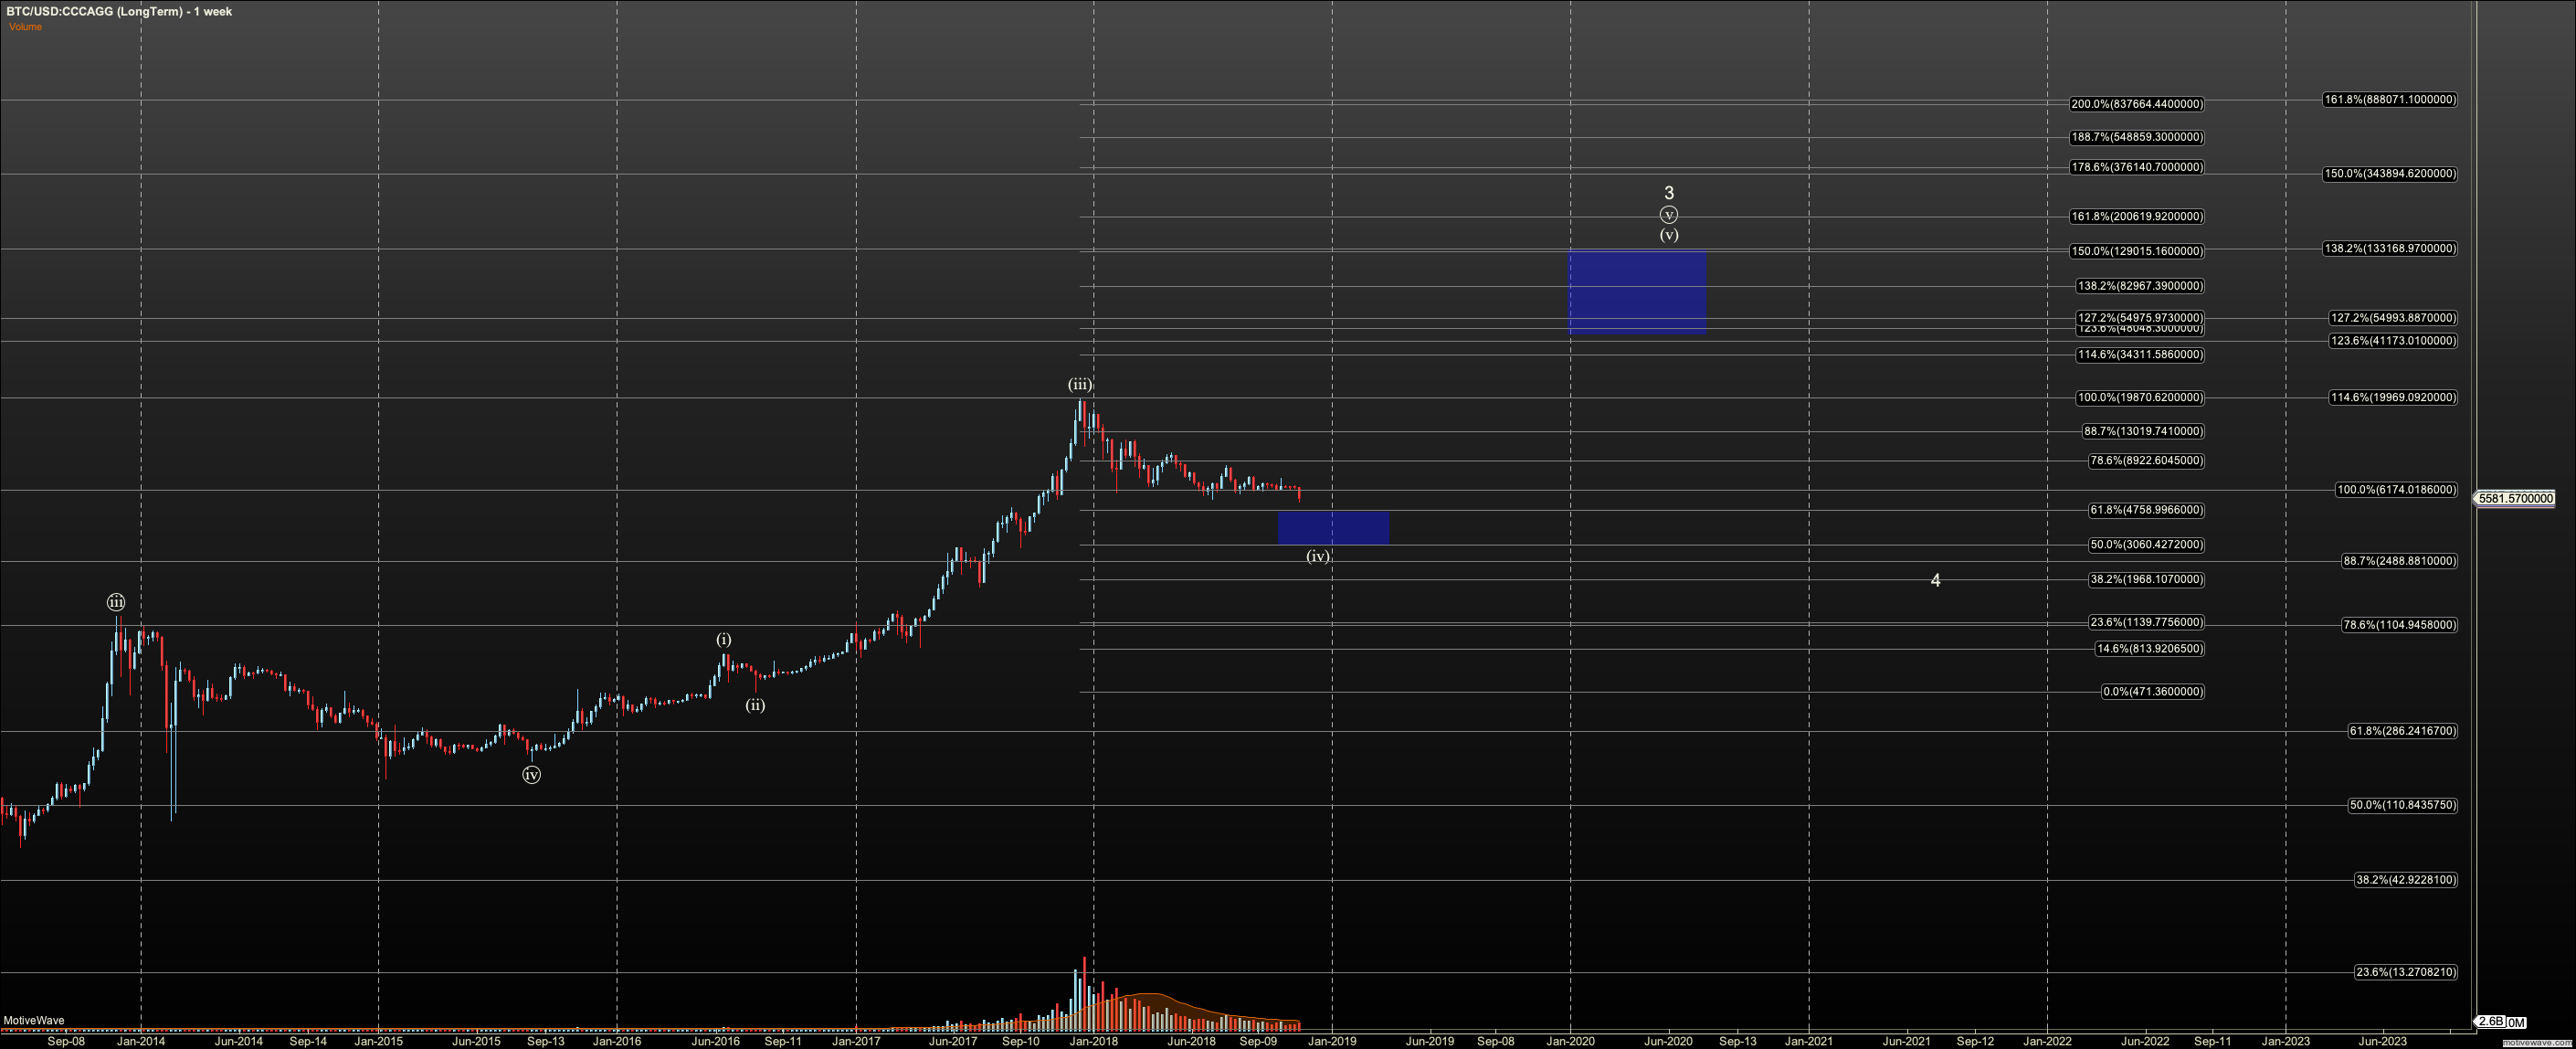
Understanding and following the Bitcoin chart is to a degree like the S&P500 to the stock market. While each coin follows a different degree in its daily count, the long term bullish charts usually hit fibs key to their respective counts near or at the same time as Bitcoin with some wandering.
There are three ways I view the long term Bitcoin Chart and my primary count which is posted.
1. I count us as in in the 4th, of the third of the fifth, of primary third. (mouthful) Counting from the 2010-2011 wave 1-2, the ‘Mt. Gox high’ in 2013 marks wave (iii) of primary third, and wave (iv) of the primary third bottomed in 2014. By that measure we are very extended in wave (v), however, the normal fib for topping such a fifth based on those previous points at $30K (1.382) However, I can’t count an obvious wave iv in that fifth until we had the correction we are in now so I count that fifth extending. This count is invalid below $3000 in this correction as the .382 of of the retrace of the minor third wave that started in 2015. If we breach $3000 we are likely in primary fourth already and the best place for that to land when you almost hit the 1.382 is the .764 at $475. But there is also a support level at $2200. We can call that we are in primary iv as ‘Alt 1b’.
Note also that Bitcoin is an ‘extended 5’ asset on all time frames so it is important to measure the subways of 5’s to refine targets for 5ths. In my study of 5ths in Bitcoin they vary widely in fib length. So, any targets I have above will get adjusted once that ‘leg’ has started.
Note that there are visual issues with this count above as some of the waves in this count are proportioned questionably which someone pushes me to the alt, at least as a consideration.
2. The alt view is based on the lowest published price of .003 on the now defunct bitcoinmarkets.com. This price is not included in my data which raises questions, but is published. This count resolves all the visual issues with the primary count and lines up key points better with more normal fibs. In this count we are still in the third of the third. The ‘Mt. Gox High’ was only wave one of primary third with a hit just above the .618. I find it compelling that we have projection confluence in that zone with the possibility the next rally reaches $82-150K depending on extensions. So, this view shows more predictable confluence with current action. Support levels for the current correction are likewise $3000. I find it compelling that we have projection confluence in that zone of $134K. But the ‘phantom published’ price is a bit intellectually dishonest to use when it is not on my chart. It’s just something to watch and this still leaves $3000 as key support. Below that level I cannot consider this count valid.
3. Lastly, the third long term view is that we are not impulsive at all and have a long term top already in, but this is not a concern until $478 is breached. Some of the interactions with key fibs on the long term, if we don’t use the ‘phantom price’ per the alt above, raise concern that we are moving in an ABC pattern. We’ve seen the long term charts of many small caps breach wave 4 supports. Perhaps Bitcoin can too?
Ethereum
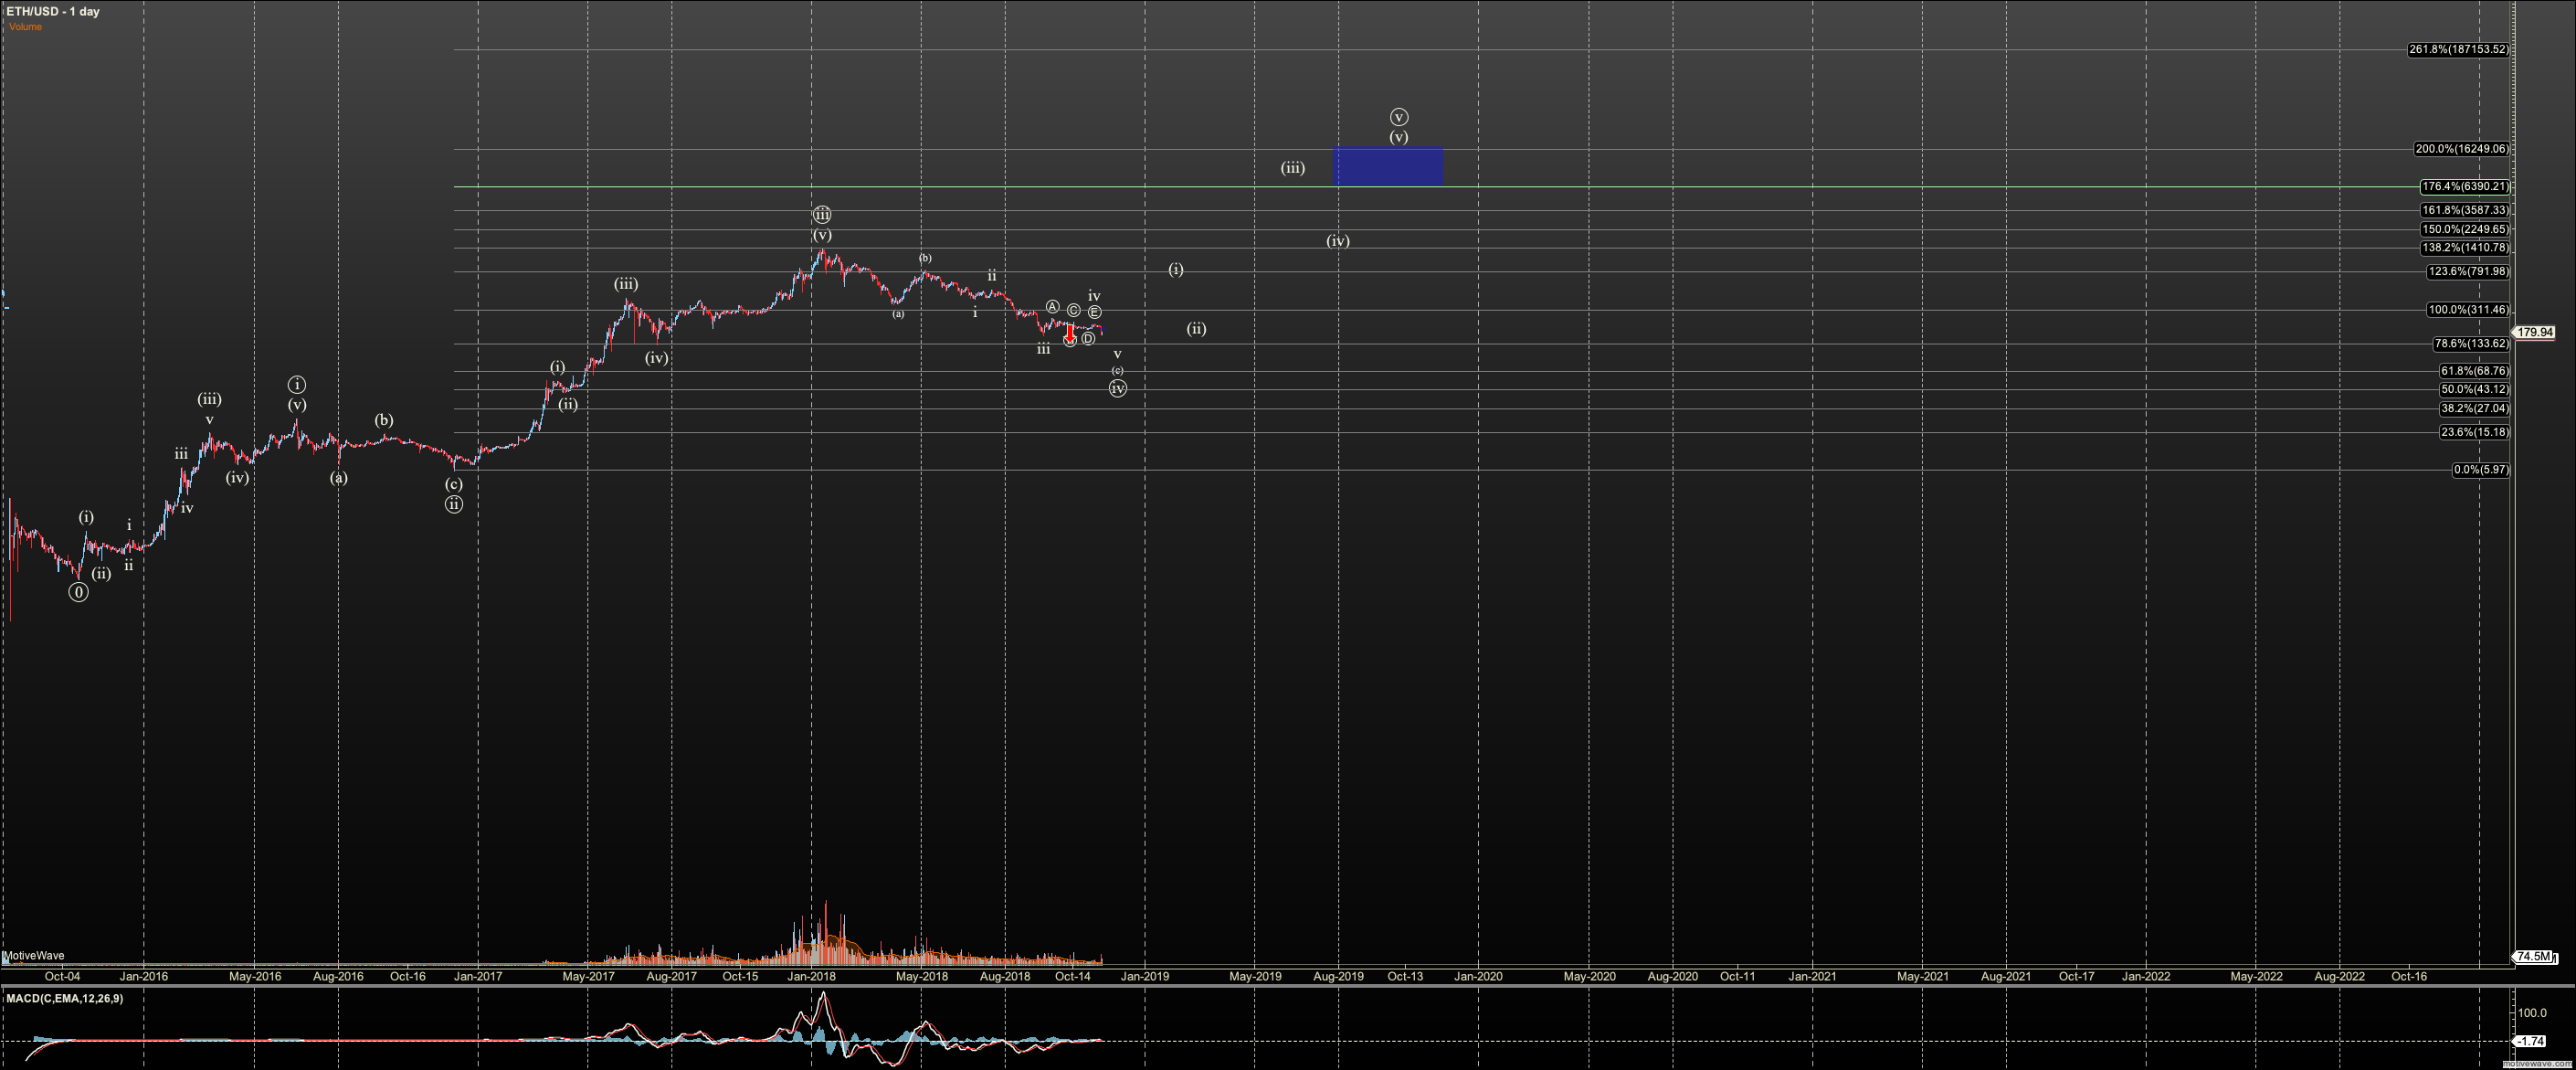
Ether staged a very clean 5 wave move off its post genesis low at 41 cents and topping at $21.50 before the Dao hack which is often called the catalyst for wave 2 which bottomed in 5.92. This gave us a projection to $16,500 for the larger degree 5th wave. However, since then we’ve seen very clear indication from the top at $1420 which was only $10 off the 1.382 and the current depth of the correction, along with the prior peak hitting the 1.0 extension directly
as well, that we are following ‘low pinball’ and should ultimately top in the 5th at $6900. This view is valid as long as this correction holds $133. There are no obvious alts to me at this time, however, if $133 is breached strongly, I will have to consider Ether topped in a three wave ABC, albeit the A wave was a very clean and impulsive five waves, which is not typical in many markets.
Ether at this point is far more 'gentle on the fibs' with numerous direct hits in its three year history. Confusion about early pricing in Bitcoin before the crypto market had good data is likely a source of the questions in the long term Bitcoin projection.