Nightly Crypto Report: Expected Breakdown in Process
 By
Ryan Wilday
By
Ryan Wilday
I love it when the market simplifies things. I had given some chance to higher or more complex B waves in ETHUSD, ETHBTC, and GBTC last night, but the breakdown today makes them improbable. We have follow-through on my primary expectations, though Bitcoin has not yet breached recent lows. Note the red line I want to see breached ASAP.
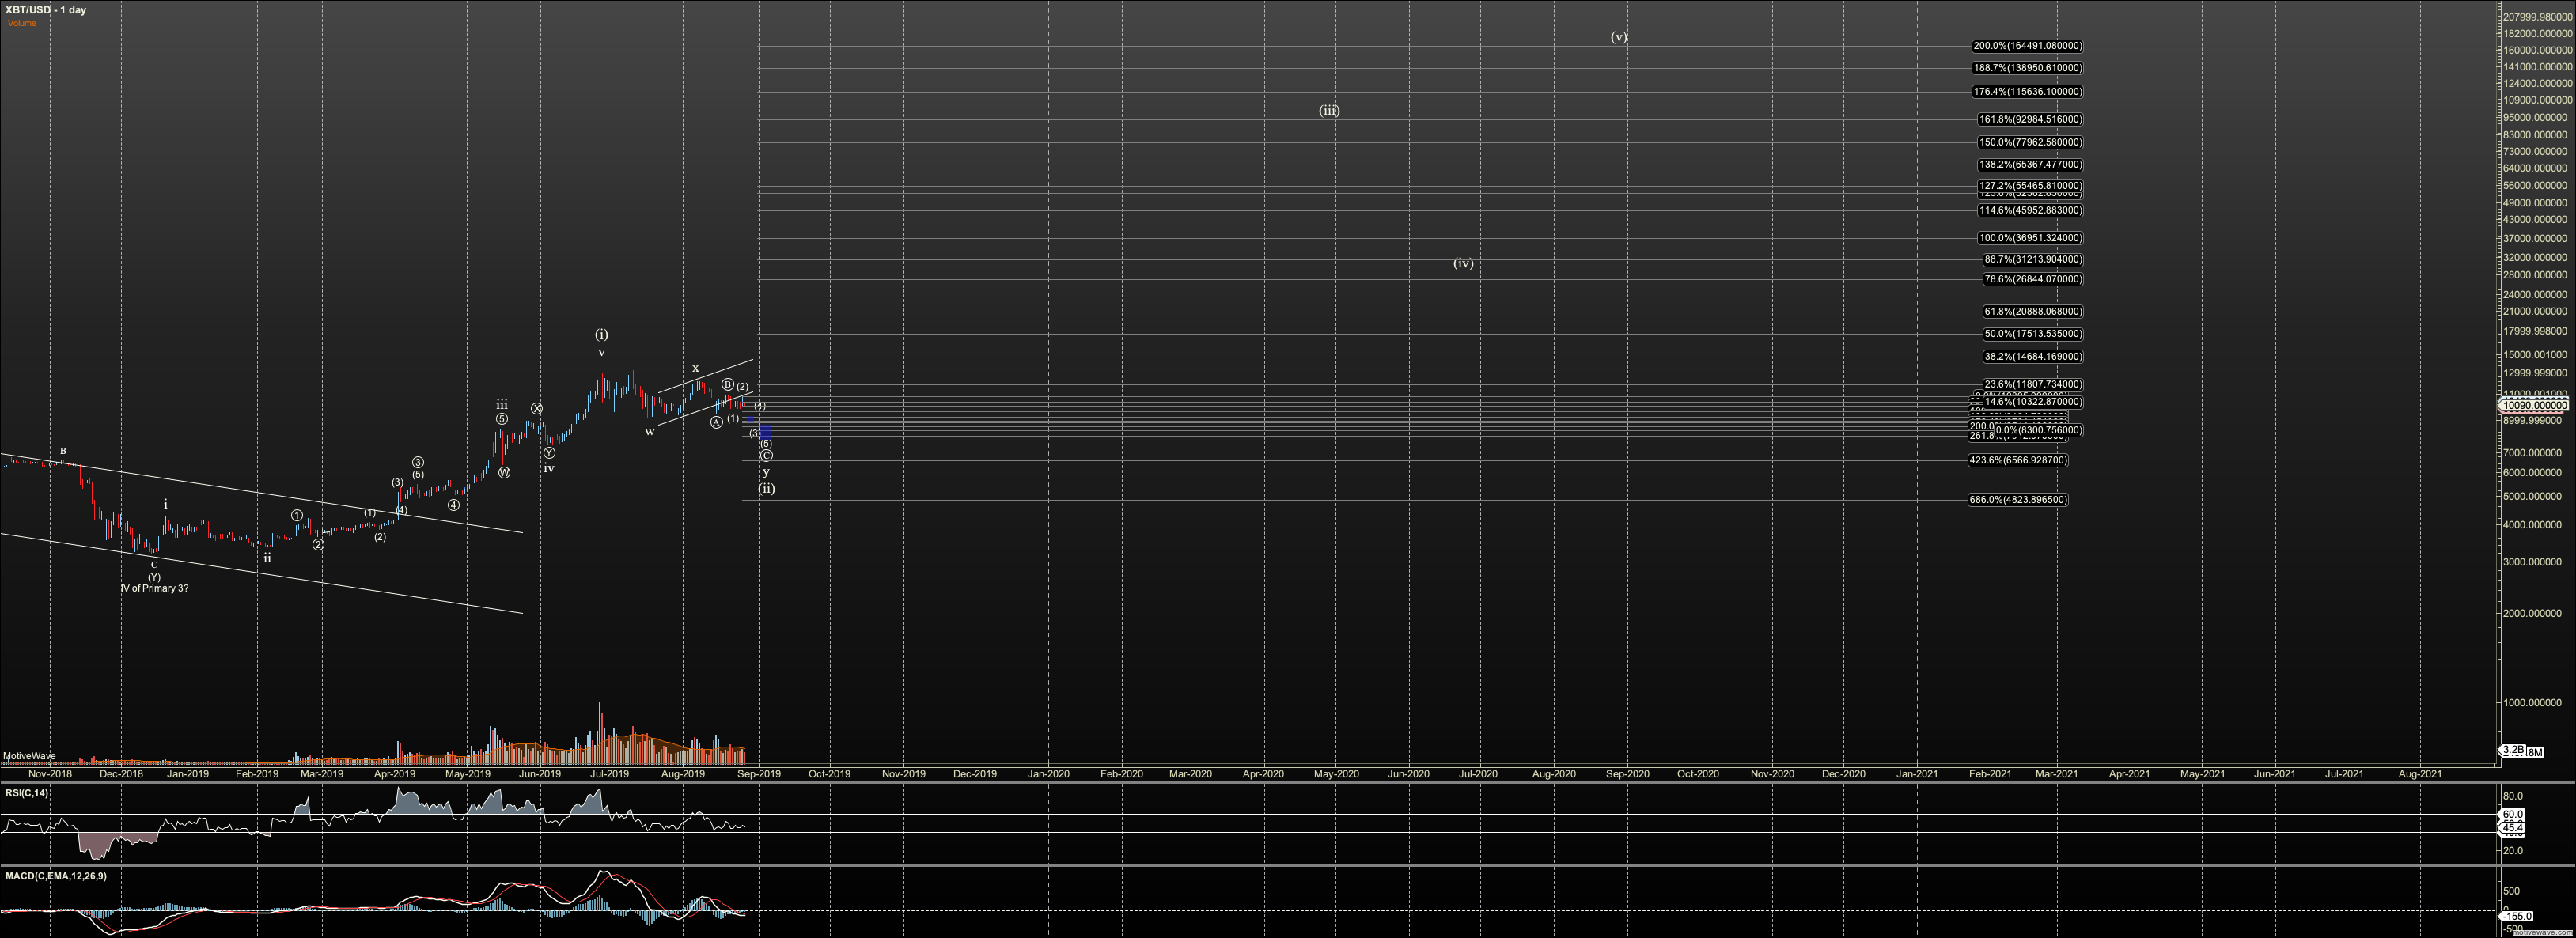
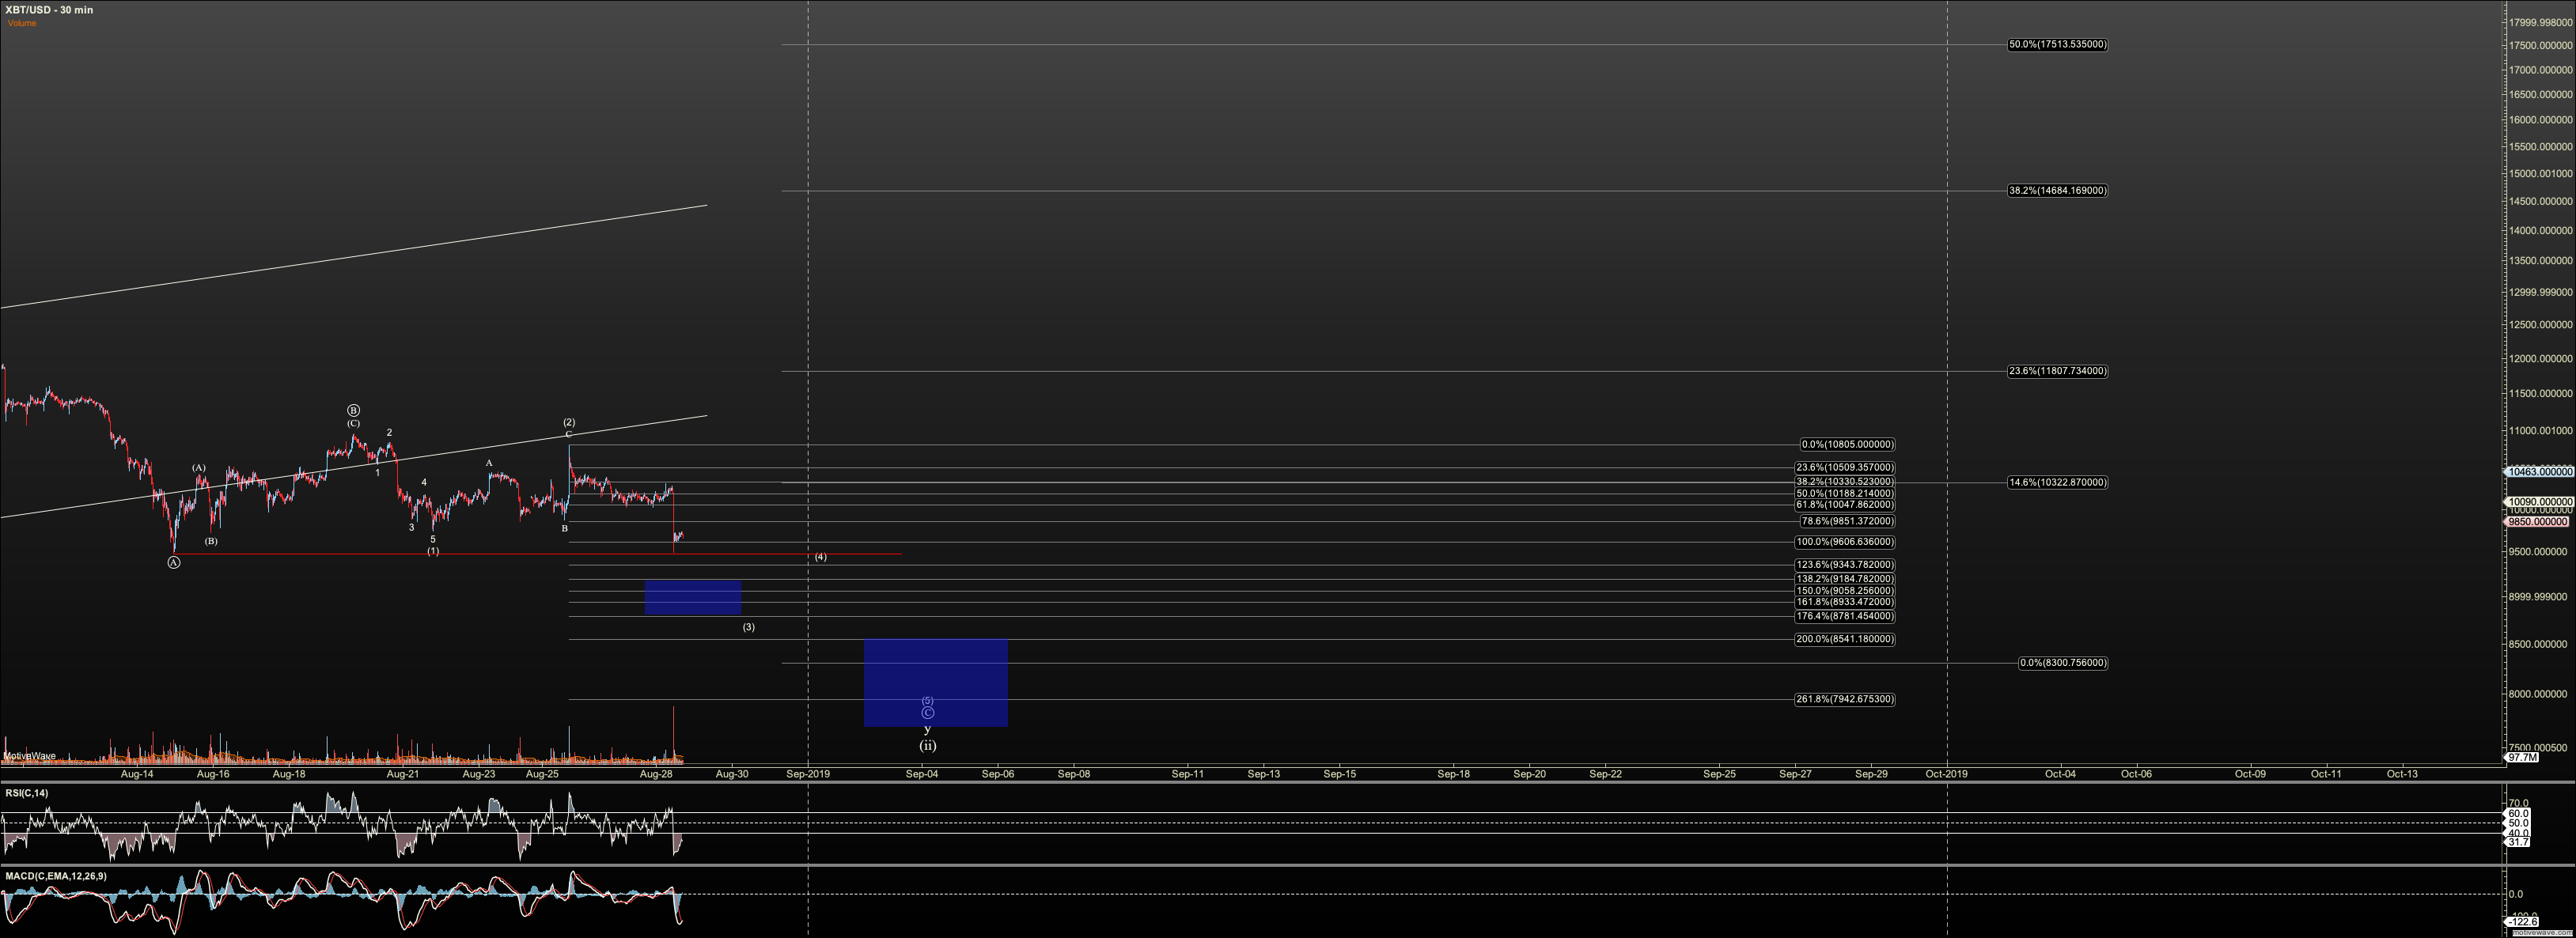
The local resistance level I have in Bitcoin through which the downward pattern should change is $9900 now. As long as not breached strong, I am looking down towards $8400-7800, as posted for so long. This, again, has confluence with the .382 retrace of the entire 2019 rally. This is a beautiful place for a very shallow wave 2 correction to bottom. However, again, if we do rally correctively only, it opens the door to a deeper correction. But we are going to have to deal with that as we get there. Also, remember that bottoming above $6800 will force me to keep my alt wave 4 on the table with the rally being a wave 5. But as stated, I am confident I can navigate us through key levels.
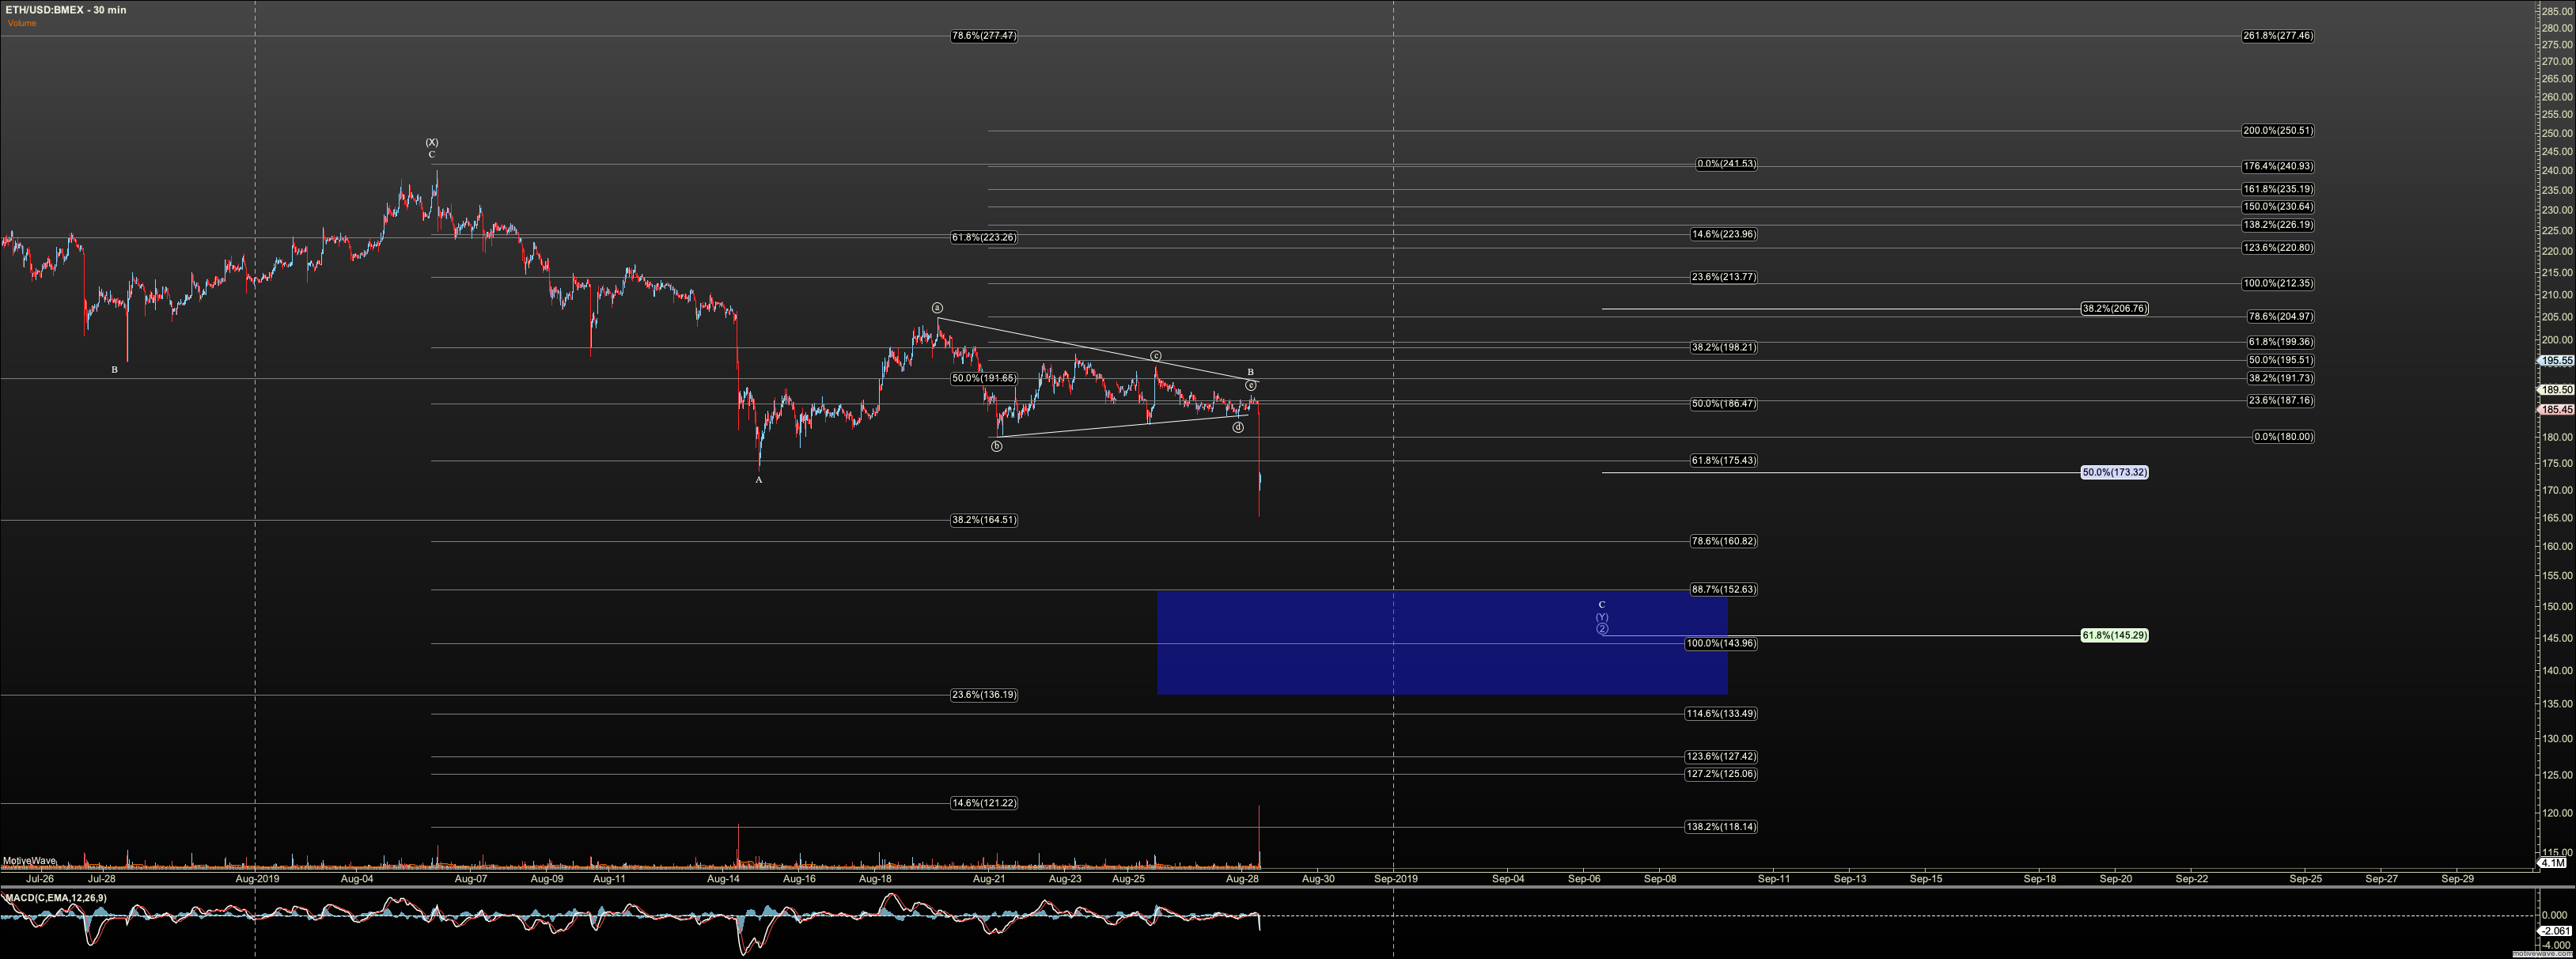
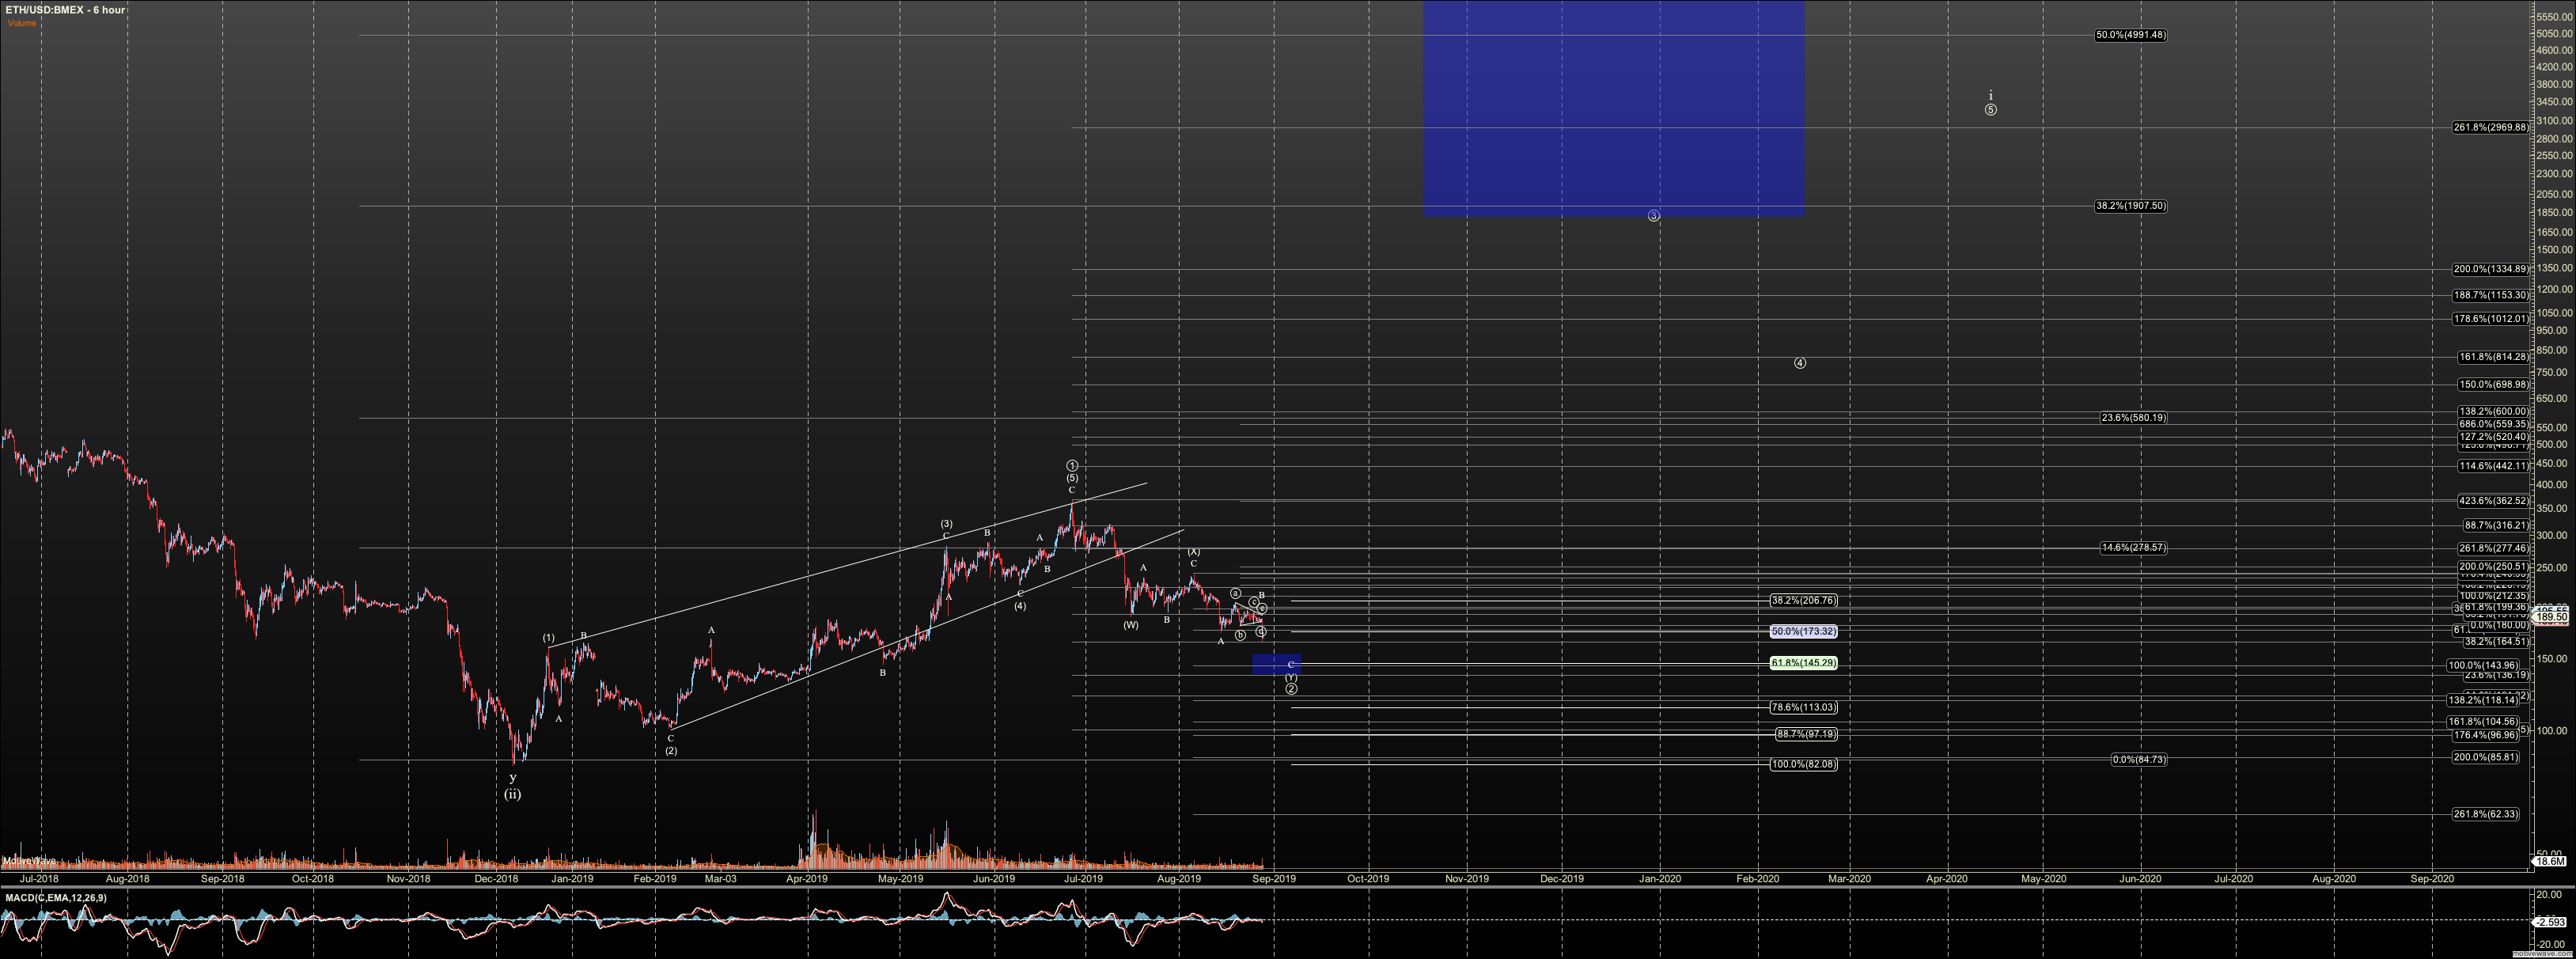
Now, while the breakdown in Ethereum is clear, structure is going to have to watched closely. I like the triangle count. However the move down looks like we 'hyperspaced' into a wave three without a wave one and two after the triangle. So, it is possible that 'pieces of the triangle' are in fact nested twos. I need to observe a bit more. That said, I have $177 as local resistance, $145 still an ideal target.
Note that regarding local resistance above, that they have different meanings between the two charts. In Ethereum, since it is clearly broken down, a break over $177 simply clarifies structure, and until the triangle is 'swallowed' again by price, I see downside follow through. In Bitcoin, since it has not broken through lows, I have to look higher at least potentially, if $9900 is breached.
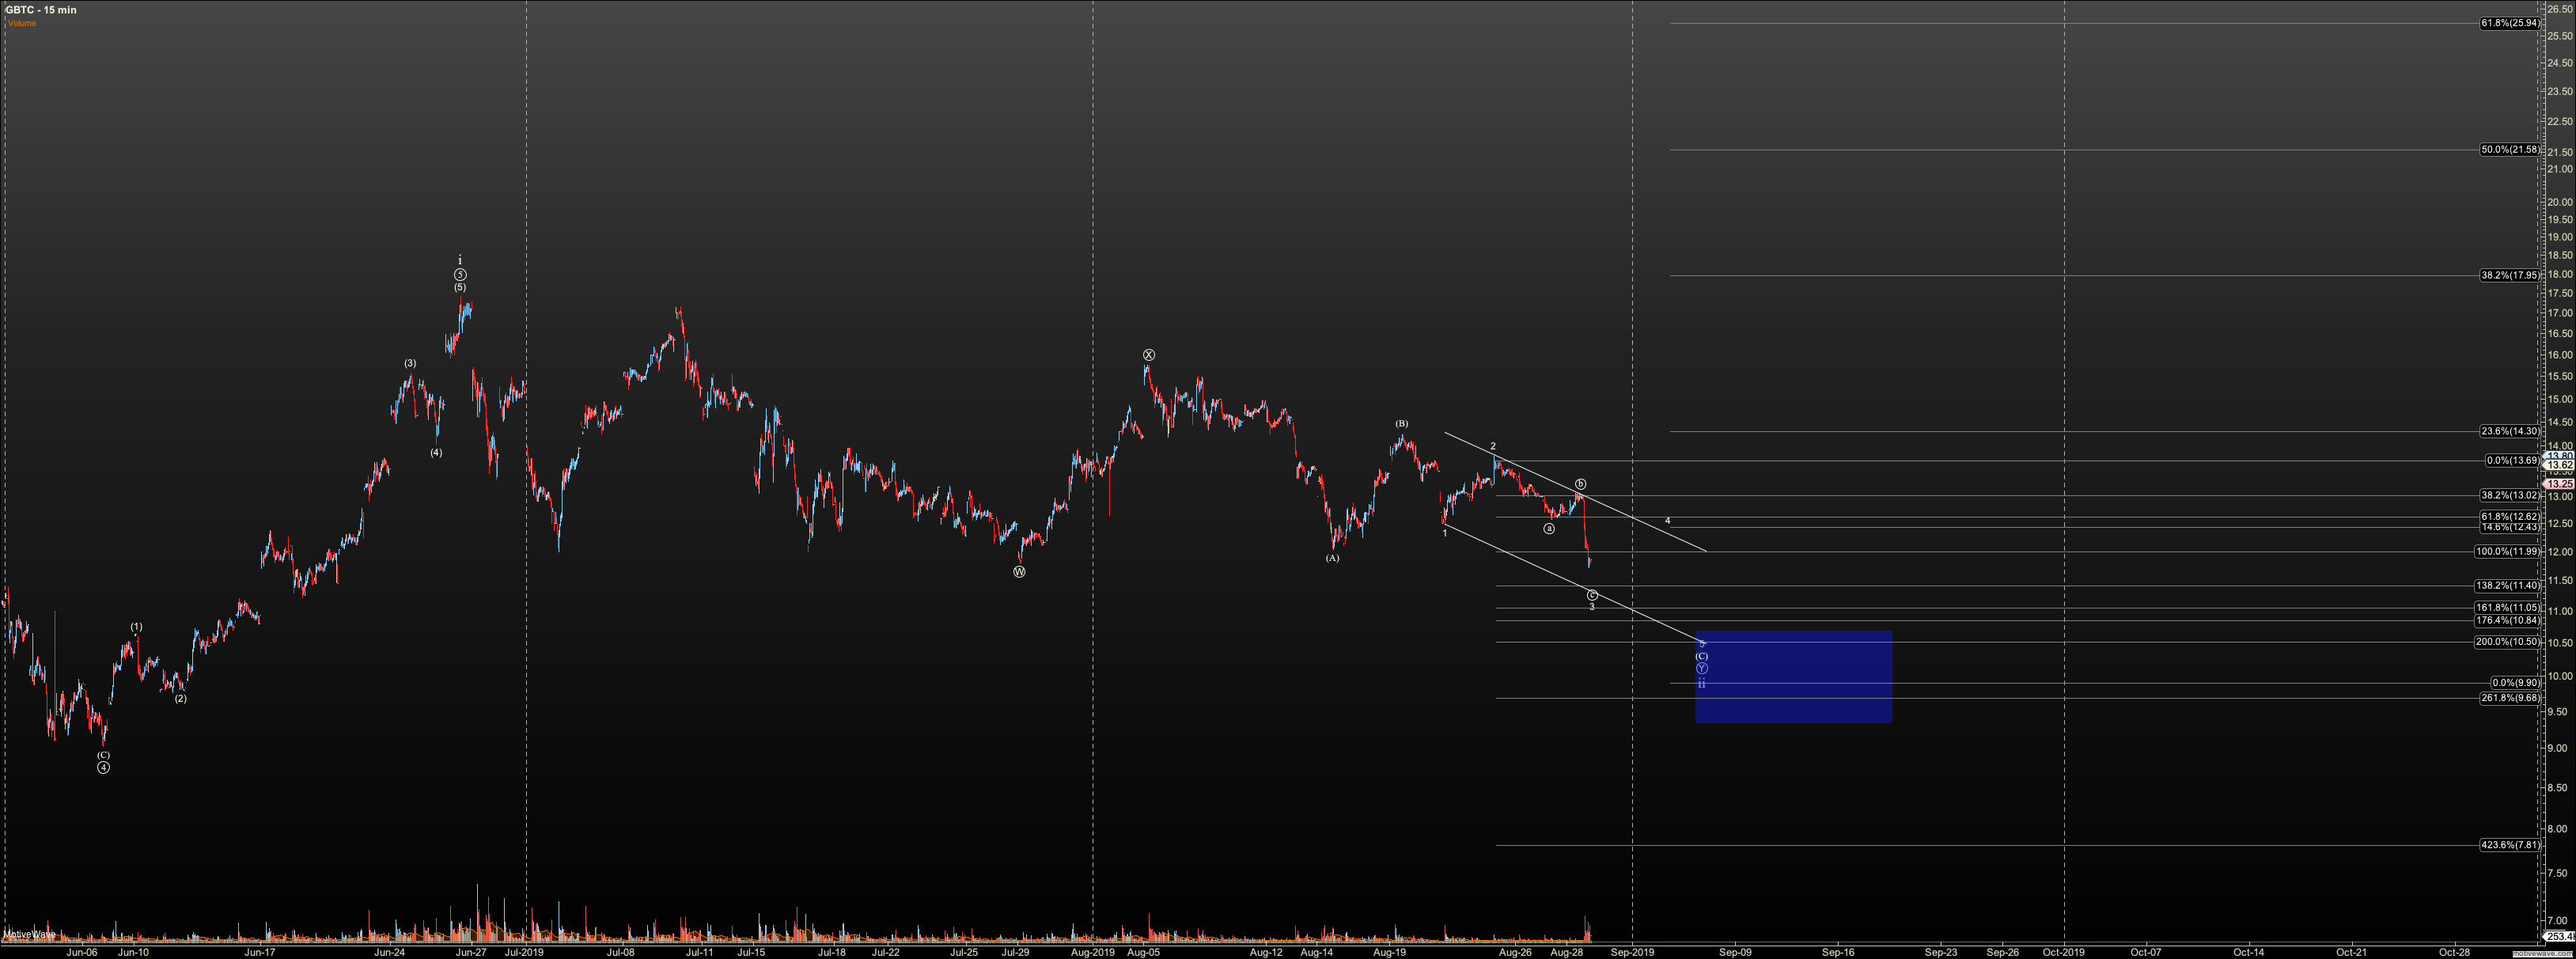
Great follow through in GBTC. Until 2 is breached, I am looking down. I put in a small tranche, but it looks like $11.05-ish is the nearest zone for a bounce. Again, sub $11 will give us a great buying opportunity, though I'll be careful how large my position is until a clear impulse shows. I'll only nibble until then.
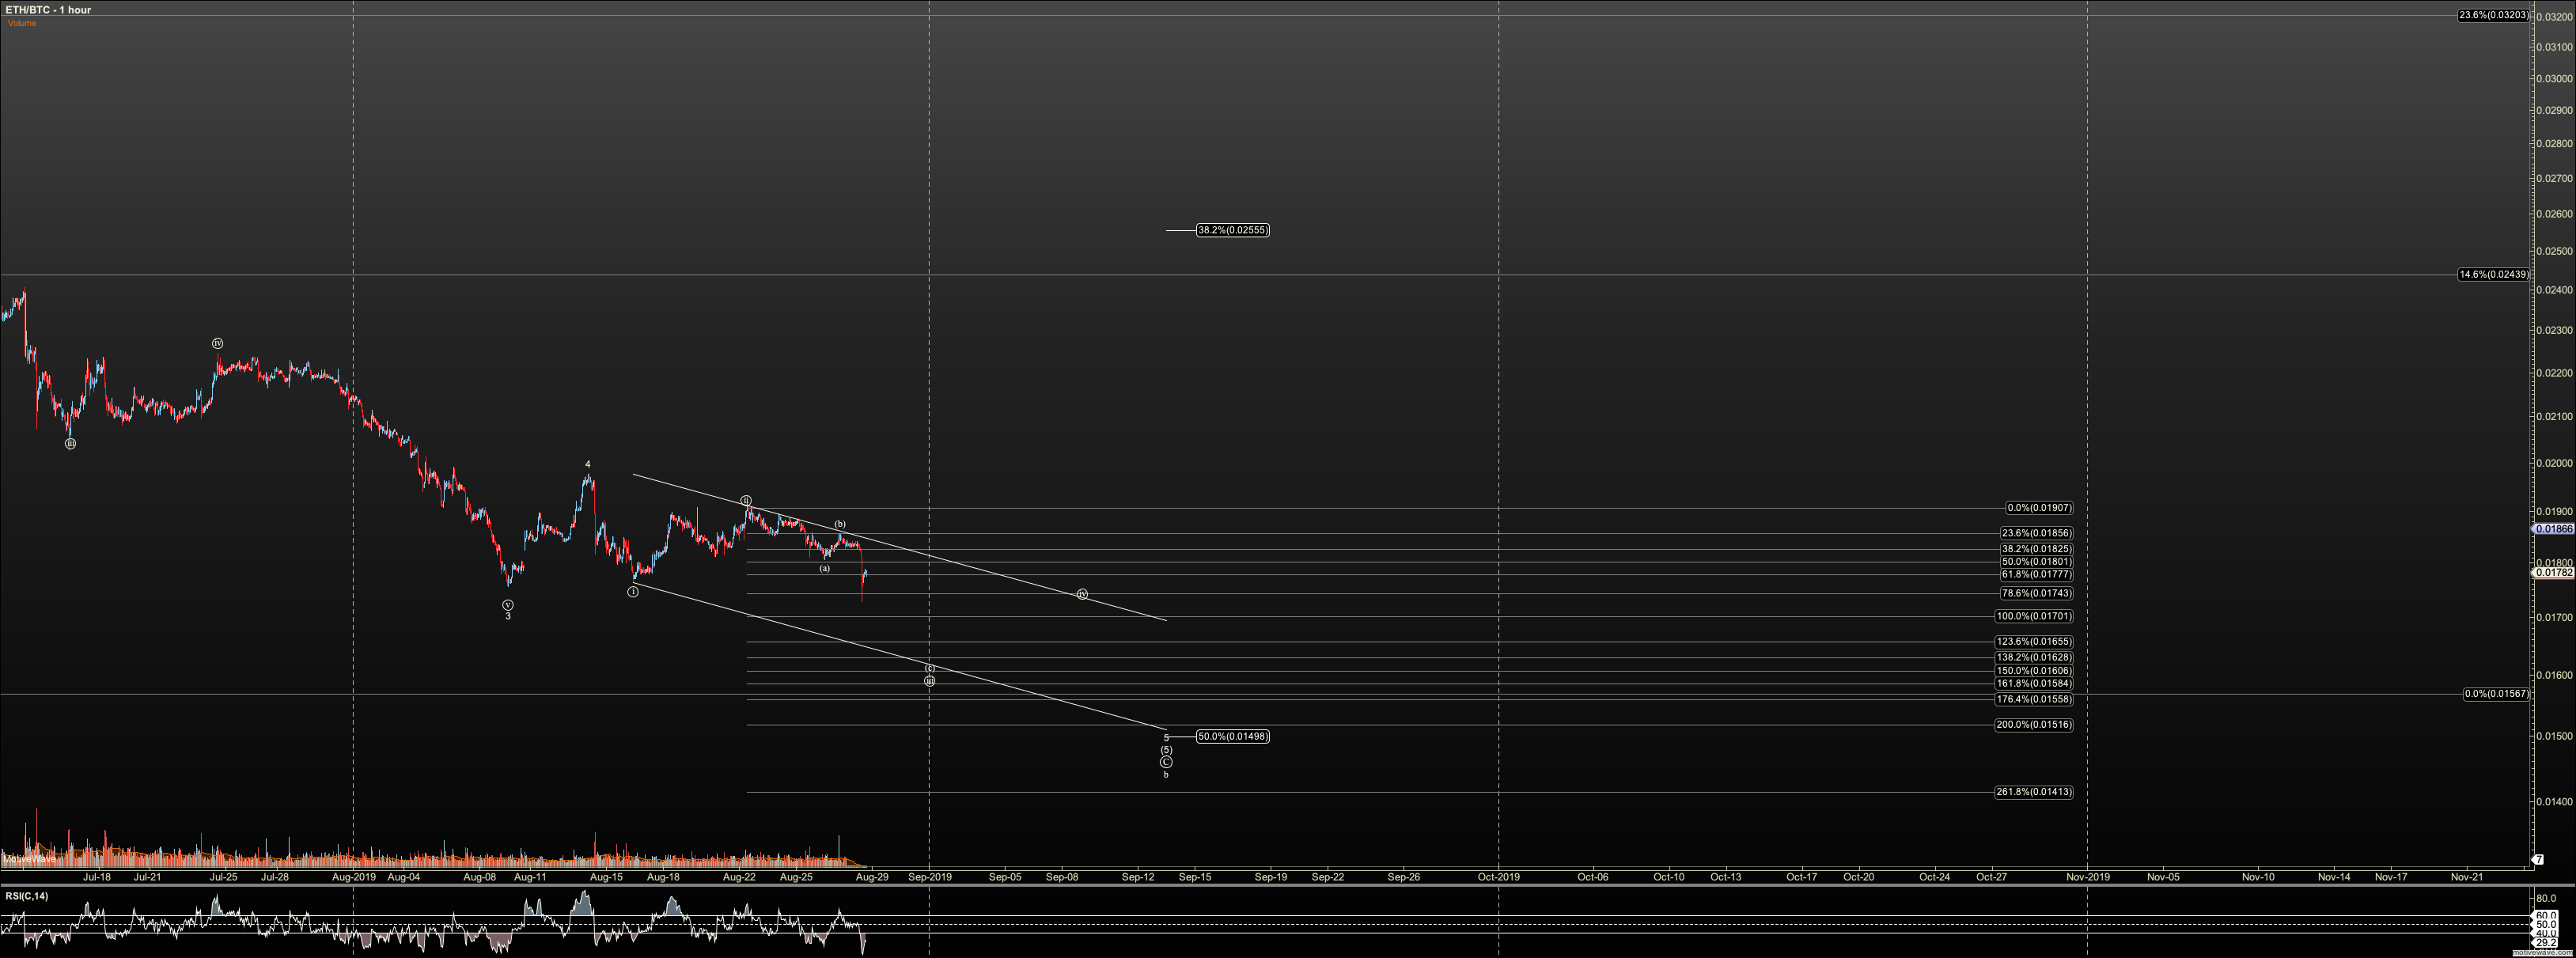
ETHBTC looks to have not completed the triangle, so I am now tracking a diagonal lower as shown but in the end, I expect no bounce above .015, as has been the case for some time.