Nightly Crypto Report: Are We Frustrated Yet?
 By
Ryan Wilday
By
Ryan Wilday
I thought I'd take a step back in this report and take us out to view the forest. We haven't seen much movement in Bitcoin over a month. This is one of the least volatile months in my 4 year career trading cryptos. There was some action in select alt coins, but with the exception of LINK, we appear to have pump and dumps. This action can be frustrating. Probably, if I didn't day trade the SPX, I would go insane.
By my observation, emotions tend to run two different ways. Some itching for a trade get frustrated and force trades. I tend to fall into this category and it would be worse if I didn't see so much opportunity in other markets. For some they lose interest, check out, and stop looking. Both emotions express a belief in permanency as if this lack of volatility is here to stay. Nothing is further from the truth.
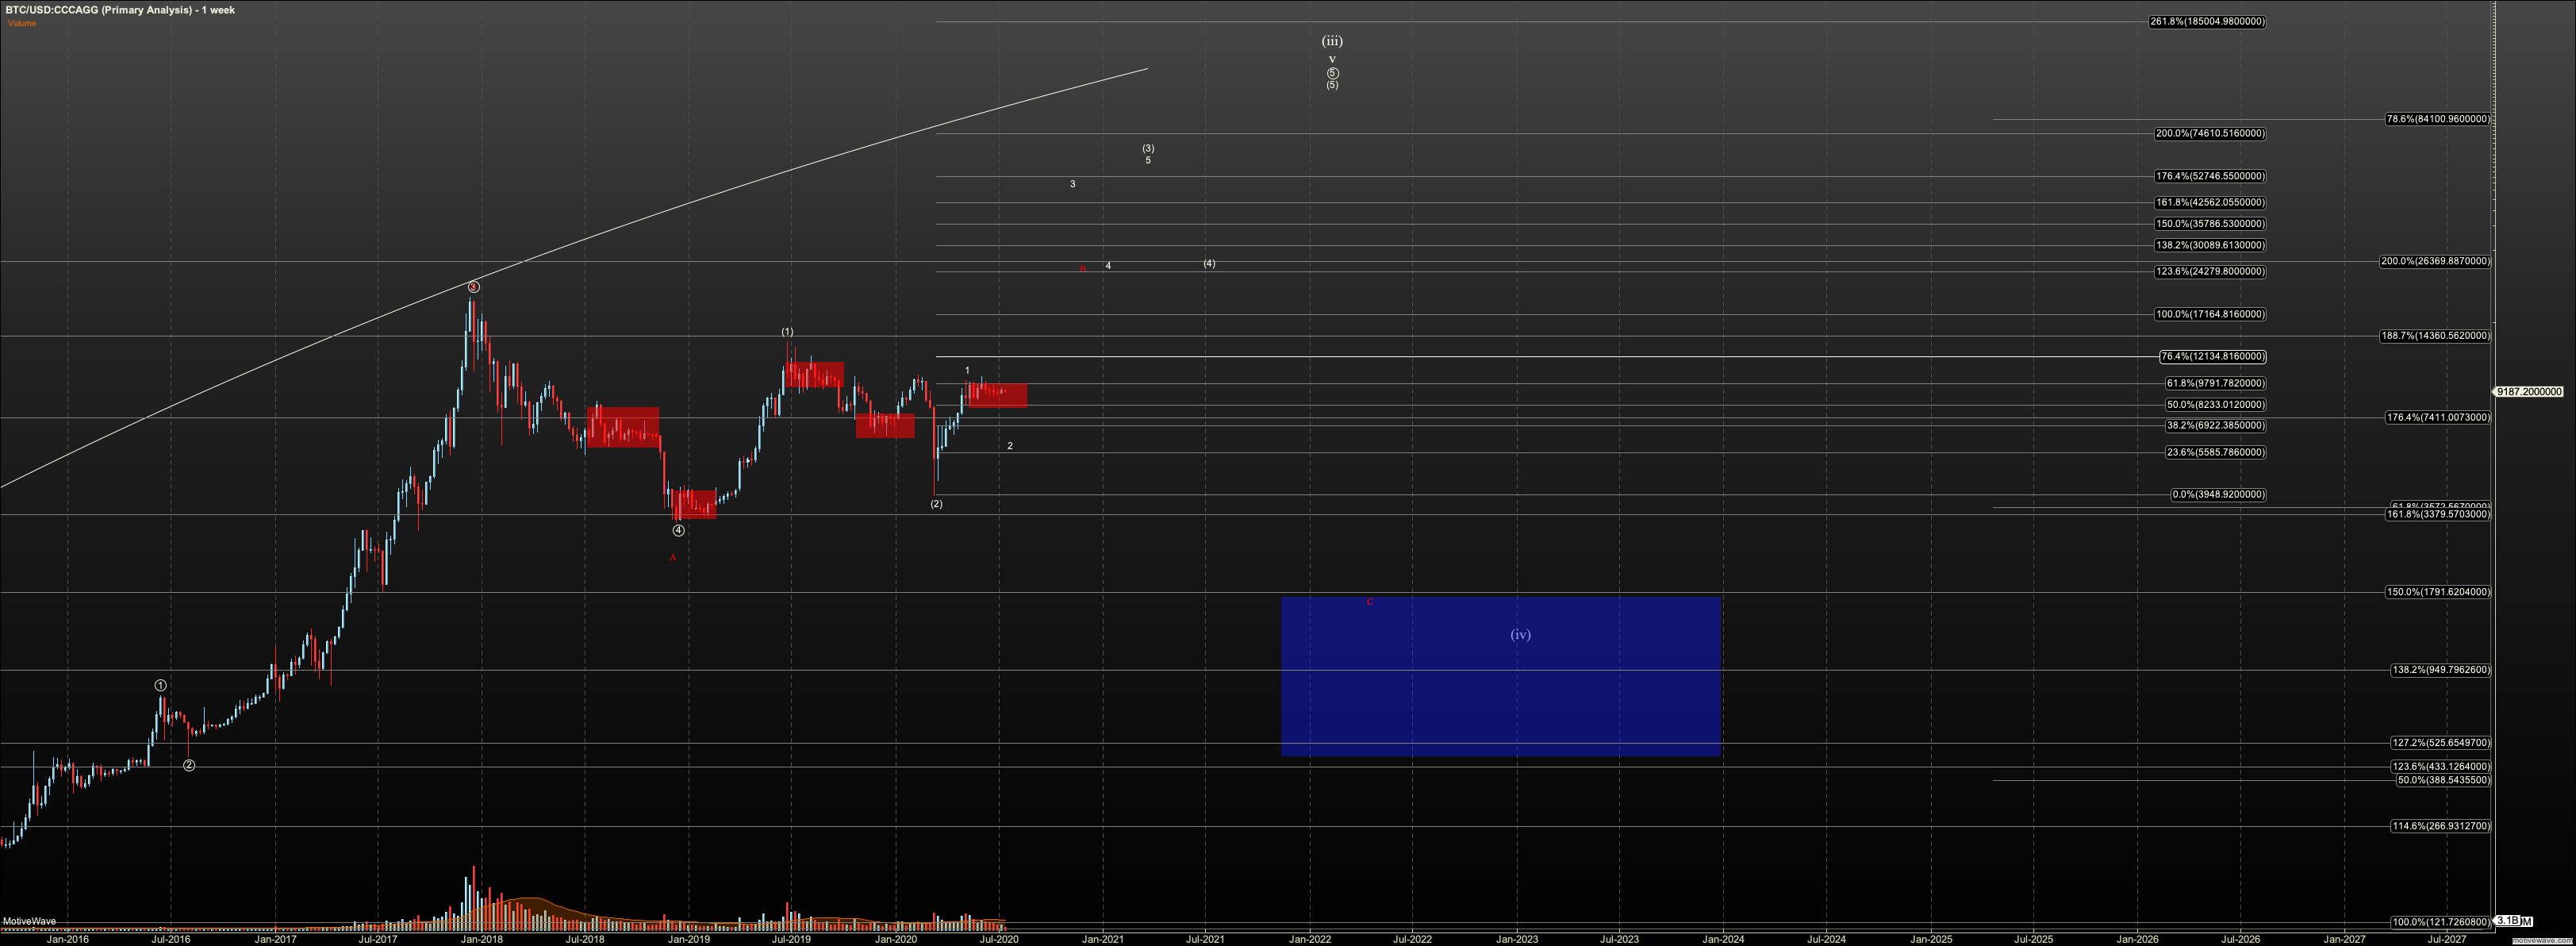
I'm presenting two 1W charts. On the slightly zoomed in version, I show a couple area where volatility reached near our current, anemic levels. In fact the first red rectangle points to a triangle that necked down Bitcoin from a $3000 trading range to a $500 range over a mind-numbing six months before it experienced a 50% crash to our $3000 bottom in December 2018. That triangle makes this month look fun. What isn’t pictured is the large leading diagonal where Bitcoin traded in a $100 range for most of 2015, before it launched to $20K high two years later. My point is this shrinking volatility in Bitcoin is normal and just shows a market in equilibrium , for the time being. But it won't last.
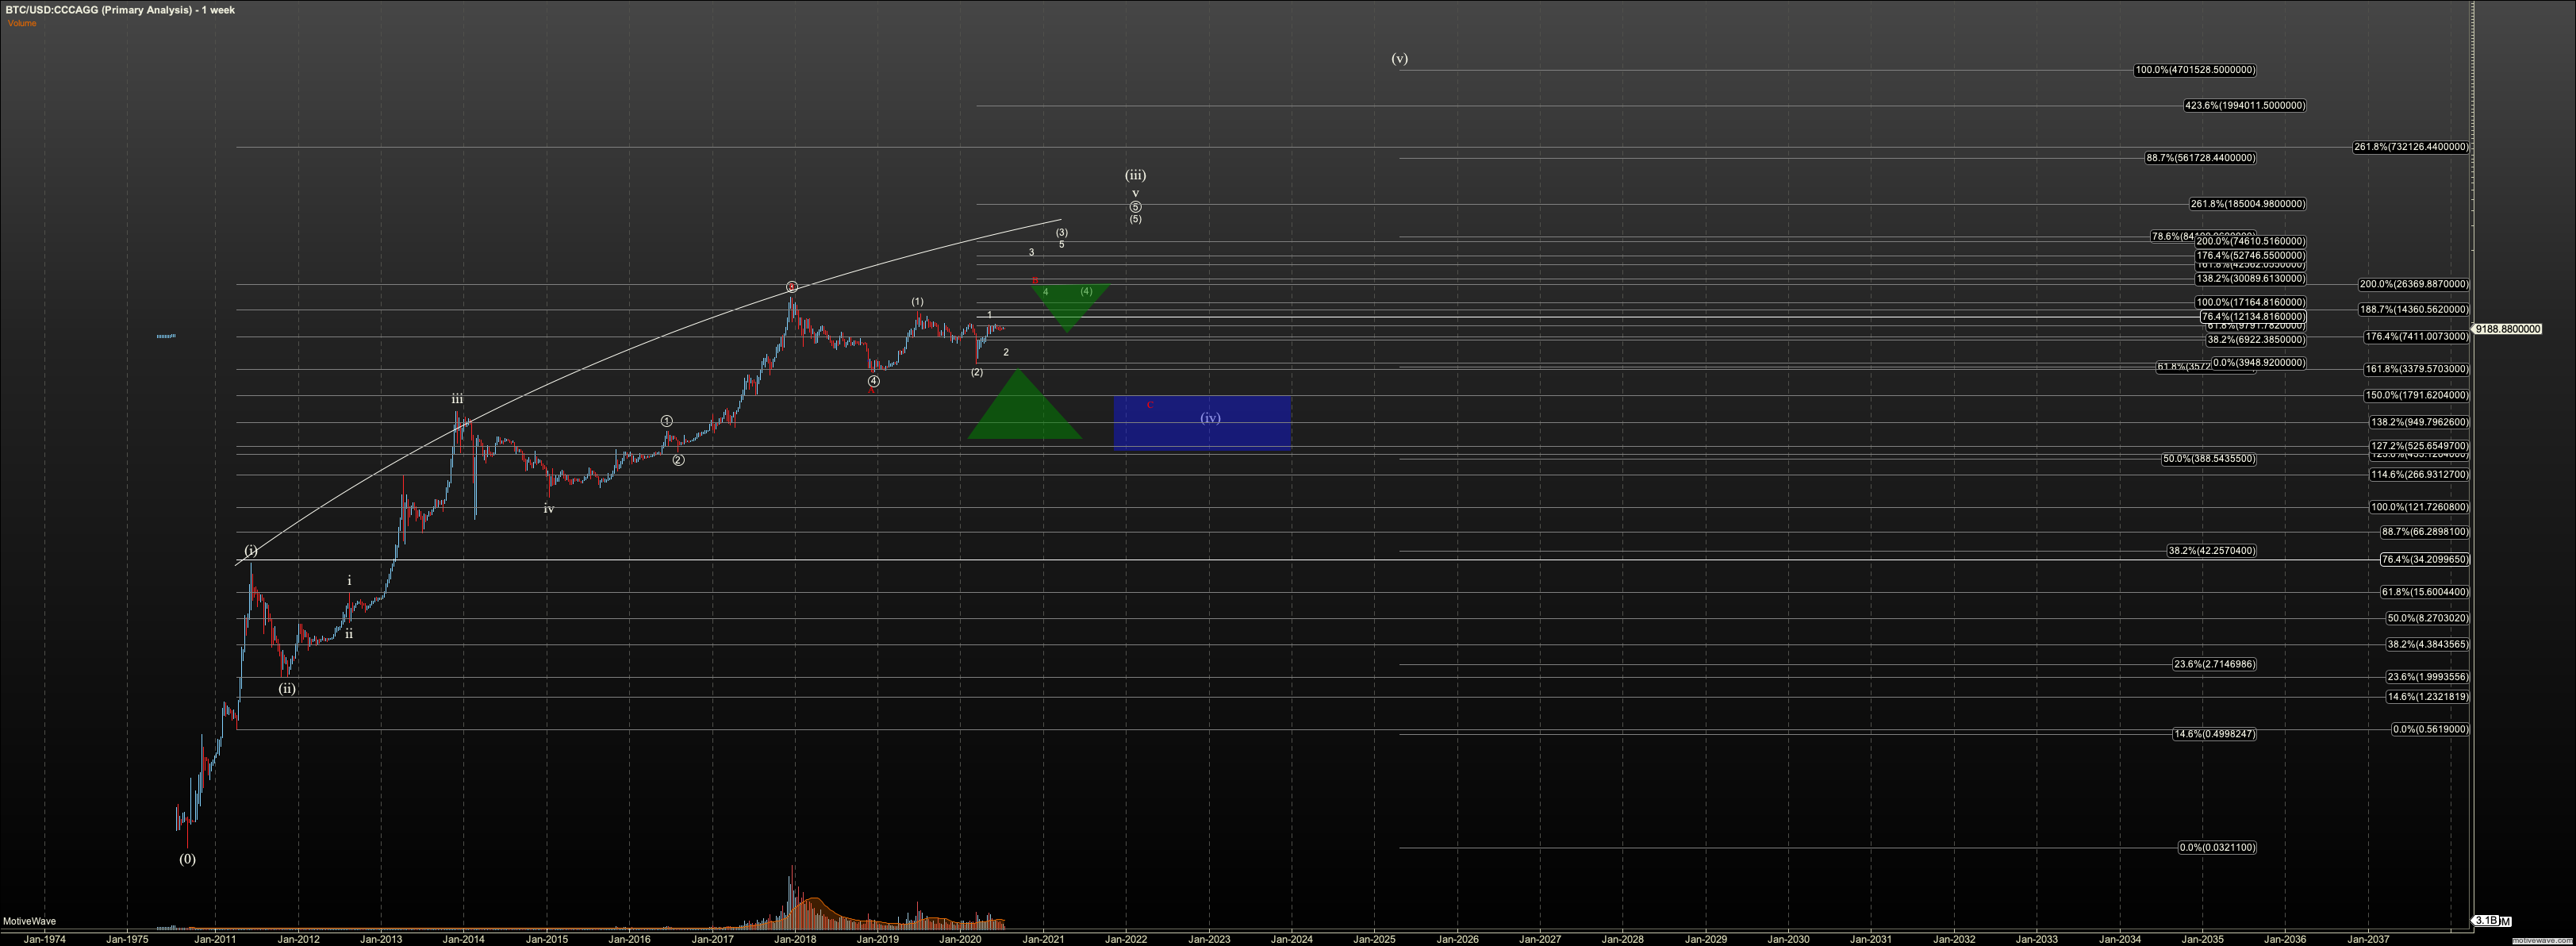
Now, as you know, the March 12th routing lead me to see the Bitcoin structure as potentially following a few scenarios. It opened the next few months to a certain level ambiguity. However, if we zoom out on the weekly chart we can reduce the chart to simple elements.
Bitcoin has formed a strong uptrend over the nine year period from 2009 to 2018. Since the 2018 peak, we've been in a bear market or, more appropriately, a consolidation. While we may have bottomed in said bear market, my red scenarios suggest the final bottom may reside between $1600 and $2000. And, scarily, nothing about this wave iv breaks until $475 breaks. But regardless of these perspectives, we're in a big range for the last two years, a range with a nominal $20K to $30K difference, peak to trough. Basically we’re in a large bull flag.
That's an opportunity.
As you know I’m more of a swing trader. The risk of wave 2, down to $4520, is heavy enough for me to be flat Bitcoin. Further, I watch these charts every day and not afraid to miss a breakout. But many do not possess the attention span, or confidence in their own trading to manage this way. For those folks, consider the opportunity in this weekly chart. Flat consolidations in markets are periods where assets change from weak hands to strong hands. They are generally periods of accumulation for larger players with deeper pockets.
Further, whether we’re talking about my white scenario, which takes us to $70K and then $2K, or my scenario that takes us no higher than $30K before back to $2-3K there is a large primary fifth wave in the future. This is the next time we should expect to see Bitcoin run in a similar manner that it did in 2017. We may just need to be patient. I’ll be surprised if that peak is any lower than $300K.
If you are not nimble, save yourself the frustration and follow the institutions in slow accumulation. As we climb above $10-15K, consider taking profit. As we drop into the $4K to $2K region, accumulate. Rinse, Repeat. By the end of this bull flag, whether the breakout occurs this year, or two years down the road, heaven forbid, ideally you’d have accumulated a large holding for the large run. If you need some help with that accumulation, my core algo with its 0/50/100 positioning system may prove to help. Granted it is still in the testing phase.
You can also divide your portfolio into this semi-lazy approach to trading, and a more short term trading approach. How you play this opportunity is up to you, but the slow accumulation approach is not an approach requiring instant gratification. Be patient.
Finally, note, per the zoomed-in chart, this month’s behavior won’t last. I can’t say whether it will end next week, next month, or six months. But just as high volatility begets low volatility in markets, this works in reverse. So, keep one eye on Bitcoin. It will move in due time.