
Newmont Mining: Record Cash Flow — Trepidation in the Tape
 By
Levi
By
Levi
Newmont Mining: Record Cash Flow — Trepidation in the Tape
Let's start with a number that should not be controversial.
Two point two billion dollars.
That is the free cash flow Newmont generated in a single quarter — a second-quarter record for the company — according to its own earnings release, dated July 23, 2026, straight from Investor Relations. Not projected. Not adjusted into something flattering. Generated, banked, done.
And that is the thing about this stock right now that I keep circling back to. Because if you only read the release, you would expect the tape to be celebrating. But it’s not.
Let me give you three figures from that same release, because they matter for what comes next.
First, the one already mentioned — a record second-quarter free cash flow of $2.2 billion. A gold miner throwing off that kind of cash is not a company in distress. It is a company doing exactly what it exists to do, at scale.
Second, the buyback. Newmont has repurchased $1.7 billion of its own stock since the last earnings call, with $4.3 billion still remaining under a $6 billion authorization. Sit with that for a second. Management is looking at its own share price and choosing, aggressively, to buy. That is not a neutral act. That is a company voting on its own stock with real money.
Third, and this is the one I find most telling — since February of 2024, Newmont has reduced its share count by more than 100 million shares. Roughly nine percent of the company, retired. Every remaining shareholder now owns a bigger slice of all that cash flow than they did two years ago.
Record cash. Heavy buybacks. A shrinking share count. A net cash position on the balance sheet. By many fundamental measures I can point to, this is a business firing on all cylinders.
So here is the question that makes this interesting.
Why is the tape so seemingly apprehensive?
Price has been sliding. Sentiment around this name has been sour. And there is a temptation — one I want us to resist together — to look at strong earnings and simply declare the stock a buy. That is not how this works. That is not how any of it works.
The earnings do not tell you when price turns. With a company of this size, they rarely do. What they tell you is what the crowd is fighting against. And right now, the crowd's fear and the company's performance have drifted a long way apart.
That gap is the whole story.
Sentiment carried this stock down to where it sits. Sentiment — not the press release — will carry it back up when it is ready. The strong quarter does not cause the turn. It simply shows us how far trepidation has wandered from the fundamentals, and how much room there may be to travel once the crowd changes its mind.
Which brings us to the only thing that actually keeps score. The structure of price on the chart.
Zac Mannes and Garrett Patten have been tracking something worth your attention across the entire sector. Let’s have a look specifically at NEM.
Sentiment Speaks
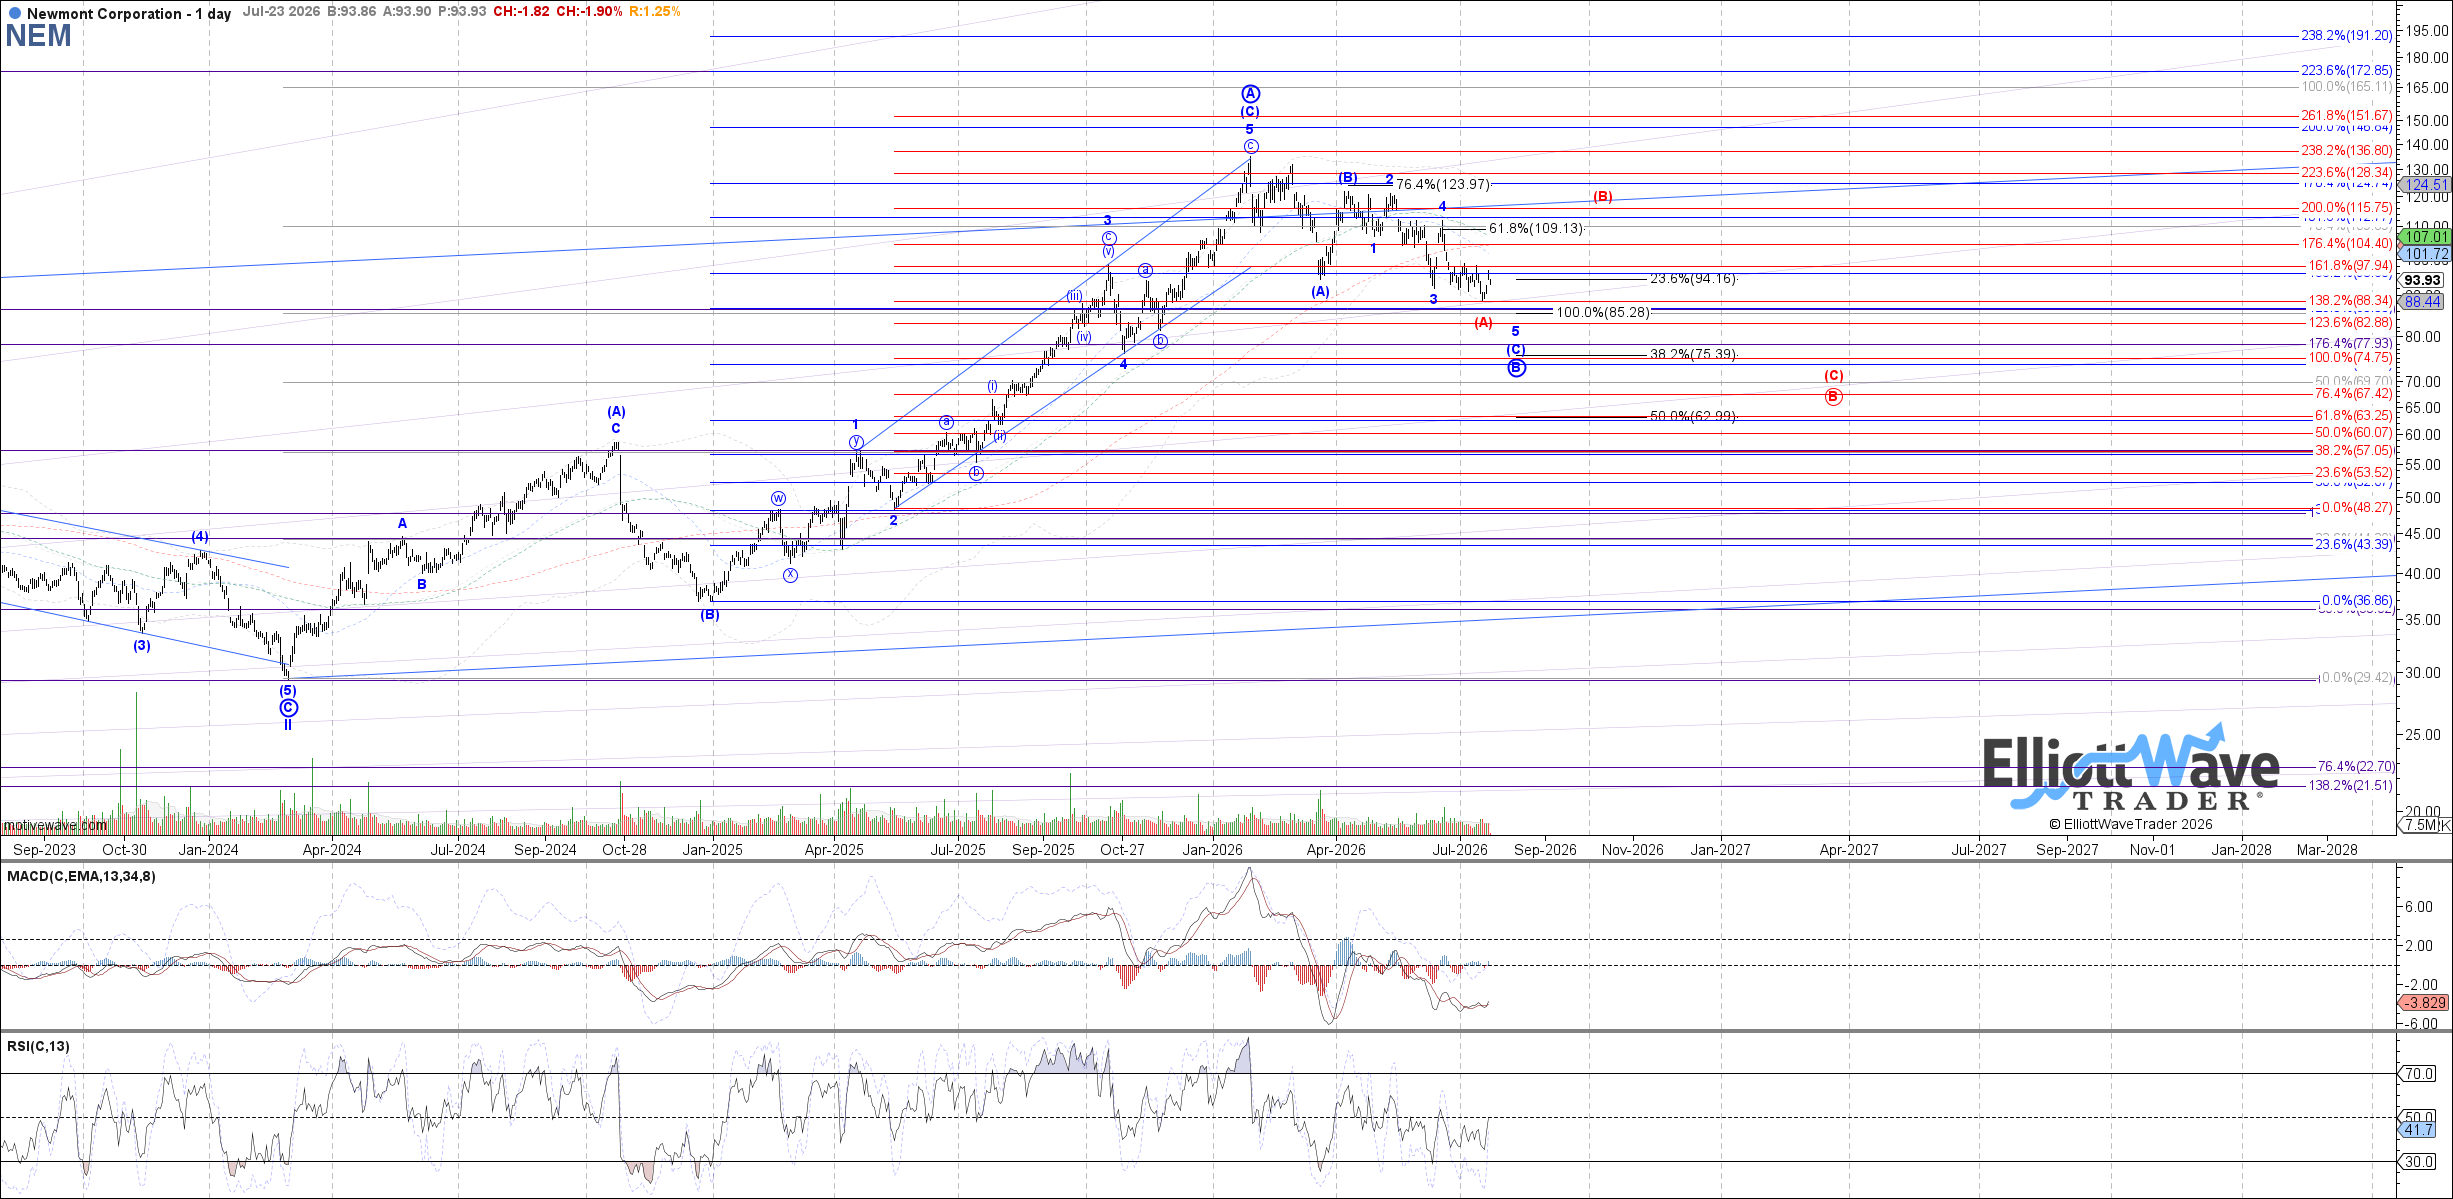
Just at first blush, you can look at this chart and see that this current corrective move appears to be complete or very near to being so. Better confirmation of this completion will happen with a move back above the $110 area. However, there is a salient point that we must not overlook.
Note how Garrett is showing his primary path as the low counting as a Primary ‘B’ wave. The alternative is the red path and it is just a lesser degree (A) wave. Why does this matter? And, how would we tell which is which?
That is one of the standout features of this methodology. What’s more, it’s rather straightforward at the moment. If it is the alternative path in Red then the next bounce, even if it clears the $110 area resistance, will be choppy and overlapping in nature as a (B) wave.
Now, considering the primary path painted on the chart, the next move should form 5 waves up and then a smaller corrective 3 waves down as a pullback. This type of structure would be a strong confirmation that a key low is in place and the Primary ‘C’ wave is underway.
In either path, should price instead move below the $75 area then we would reconsider the bullish near term scenarios.
Conclusion
So let's bring the two threads together.
On one side, a company posting record cash flow, retiring its own shares by the tens of millions, sitting on net cash — a business, by the numbers, doing nearly everything right. On the other, a tape that has spent months acting as though none of that were true.
That divergence is not a contradiction to be explained away. It is the setup. Fear drove this stock down to where it sits, and fear does not consult an earnings release before it decides to lift. It lifts when the structure says the selling is exhausted — and the structure is now telling us that moment may be at hand, or already behind us.
Here is what I will be watching, and it is refreshingly clear. A move back above $110 confirms the corrective move is likely complete. From there, the shape decides everything. Five waves up followed by a shallow three down, and the primary path is asserting itself — a key low in place, the larger 'C' wave rally underway. A choppy, overlapping bounce instead, and we are likely in the red alternate, with more work to do. And below $75, the near-term bullish case steps aside and we reassess.
That is the whole map. One level to confirm, one structure to arbitrate, one level to invalidate.
I cannot tell you the crowd will change its mind next week, or next month. Nobody can. What I can tell you is that the distance between this company's performance and this stock's price has grown wide enough to be worth watching closely — and that price, not the press release, will fire the starting gun.
The cash flow is real. The trepidation is real too. The question is only which one the crowd decides to believe.
