
Netflix Is Between Crowds
 By
Levi
By
Levi
Here is a thing that does not get said enough about falling stocks.
Sometimes a decline is not a verdict. Sometimes it is just an empty room.
One group of people is leaving. Another group has not shown up yet. And in the space between them, price does what price does when there is nobody standing underneath it.
That, I think, is Netflix right now.
Let me back up though, because Lyn Alden framed the fundamental side of this better than I could, and I want you to read it in her words rather than mine:
"Netflix is getting more interesting at current levels, but it's too early for me to go long yet.
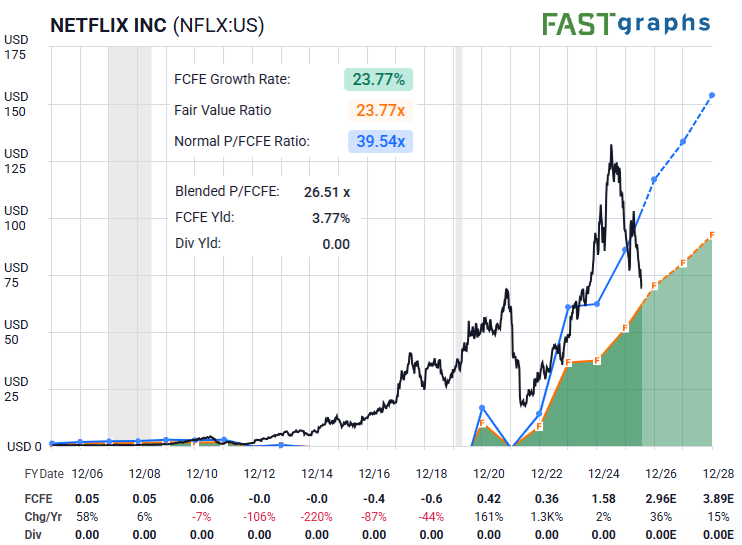
Fundamentally speaking, Netflix is finally generating a growing amount of cash from all their prior years of aggressive growth and reinvestment. However, the market doesn't appreciate the fact that they got outbid on their Warner Bros. Discovery acquisition, and the fact that their growth rate is slowing down.
I'd describe it as Netflix transitioning from a growth stock to a value stock, which is a hard process because it involves a lot of shareholder rotations and a lower baseline valuation.
If the share price drops closer to $50/share and begins showing signs of momentum reversal, then I could become quite interested in the name."
Read that third paragraph again. That is the whole piece.
A lot of shareholder rotations.
Four words, and they describe something enormous. A company does not change categories quietly. When a stock stops being a growth story and starts being a value story, it has to change owners — nearly all of them, over time. The people who bought it for the growth do not want it anymore. Their thesis is finished. Not wrong, mind you. Finished. And they sell, because that is what you do when the reason you owned something no longer exists.
But the value buyers? They are patient by nature. They are not coming in at any price. They have a number, and until price reaches it, they will happily stand there with their hands in their pockets and watch.
So the sellers have a reason to sell today. The buyers have no reason to buy today.
That is not a broken company. That is an empty room.
And this is where it gets interesting, because that gap between the crowds is not some vague notion. It is measurable. It has edges. The first crowd exits at prices where its thesis breaks, and the second crowd enters at prices where its thesis begins. Somewhere in between sits an air pocket — and air pockets are exactly the kind of thing the structure of price is really good at mapping.
Notice too that Lyn gave us a number. Closer to fifty, with signs of a momentum reversal. That is not a wish. That is a level and a condition, which has fundamental analysis aligning with crowd sentiment projections.
So the question we want to put to the charts is a simple one.
Where does the second crowd start showing up?
We have a unique tool set available to point us toward the probable path.
Sentiment Speaks
These crowds moving back and forth paint recognizable patterns. These very patterns exhibit variable self-similarity at all degrees of the structure. This means that we can take the context and then project how the market may finish its next sentence.
Now, this is not prediction. It is not prophecy. Simply said, it is projecting what is most likely to take place as the structure fills in the next probable sequence. Allow us to illustrate with the following charts.
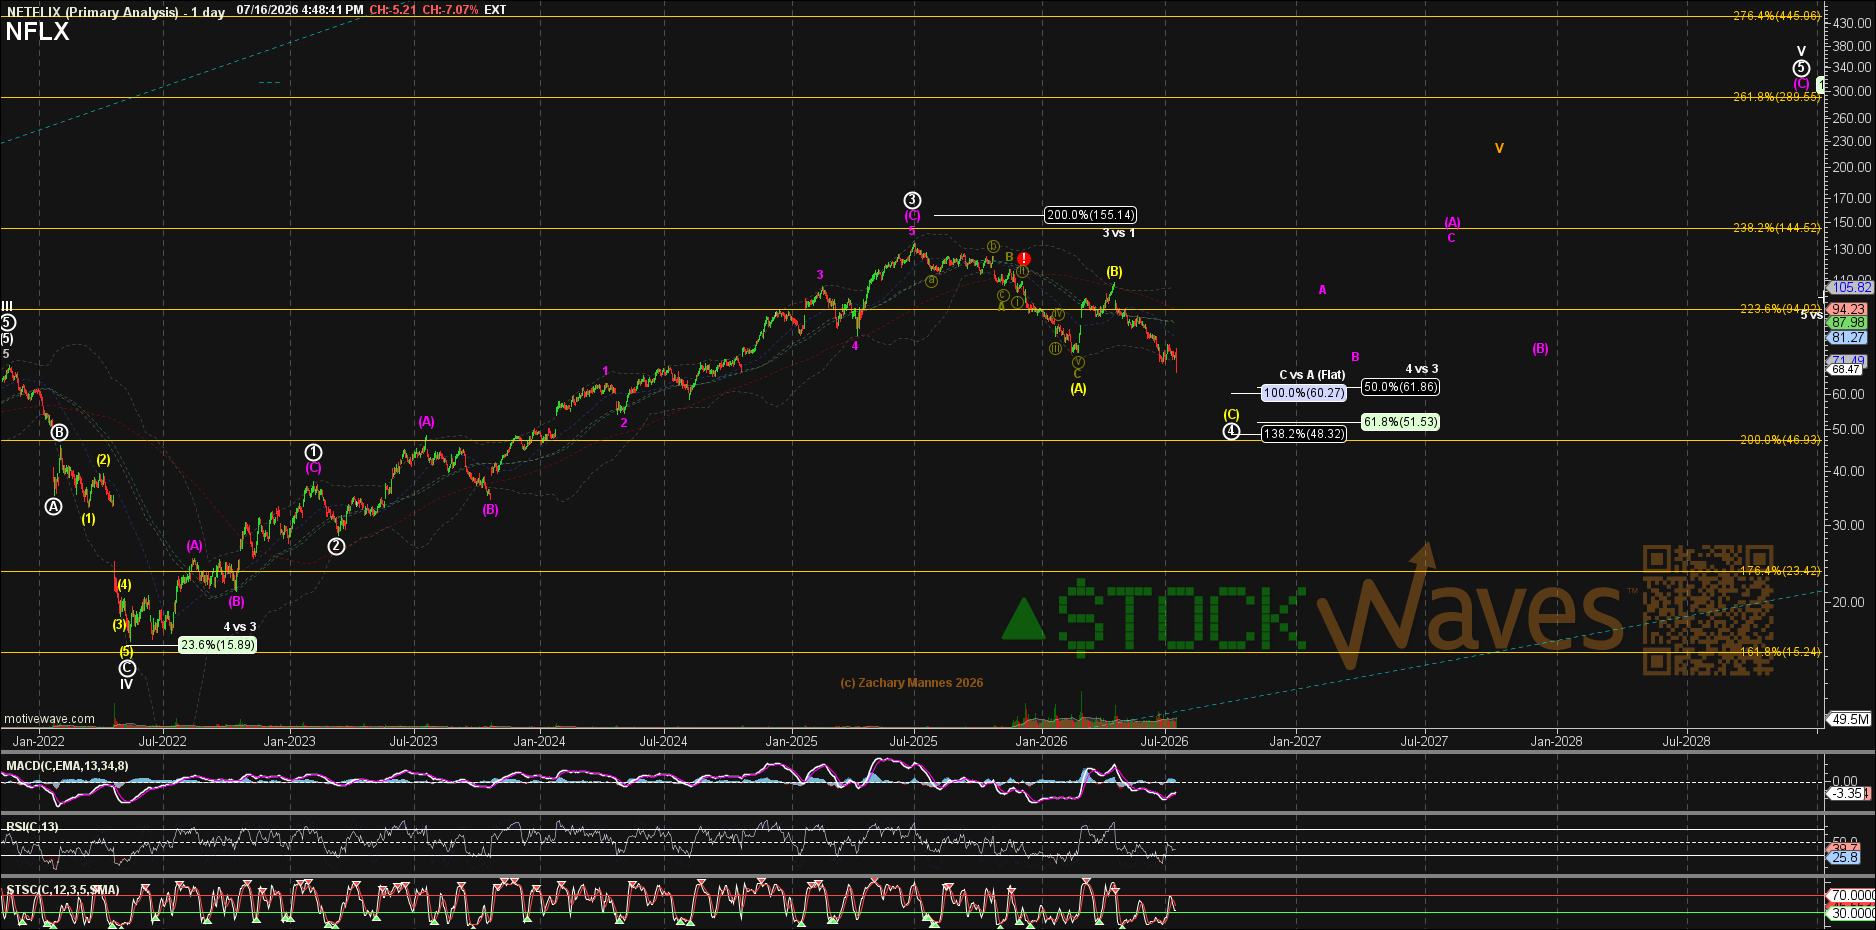
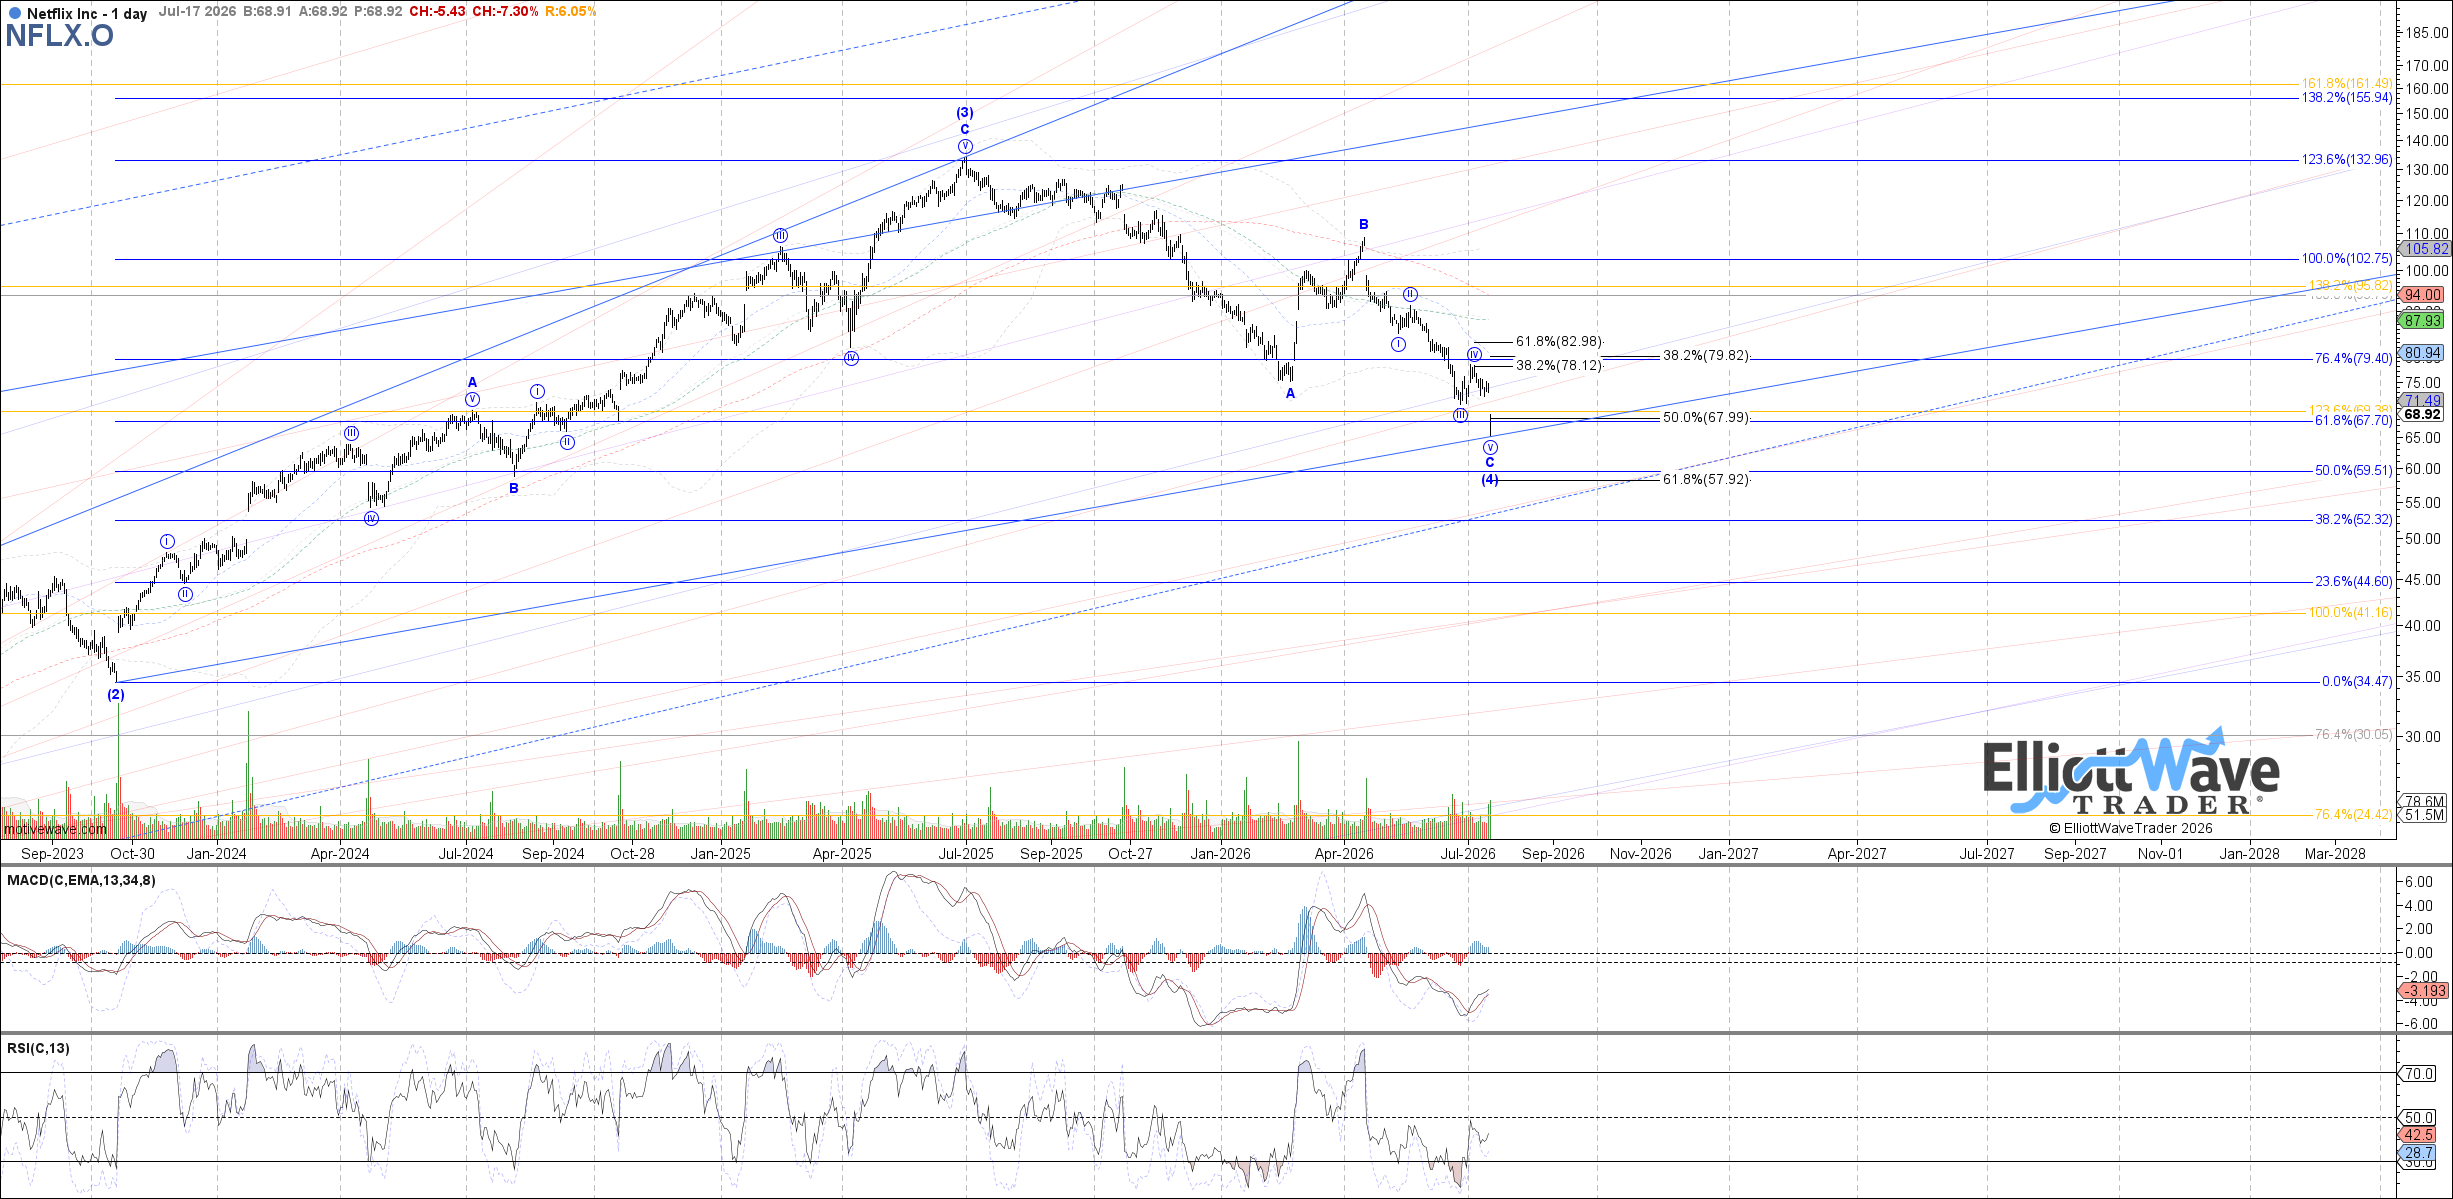 From the above you will easily see that Zac and Garrett are in lock-step with their expectations of this current chart. An Intermediate wave (3) completed at the last high. Wave (4) has been taking some time to fill out. But it now appears that this correction could be nearing a finish. What would signal a possible end?
Well, if we zoom in closer to both charts we can see that Garrett is illustrating the potential for the last low to be the final portion of the C wave of (4). A better confirmation of this scenario would be with a move above the $80-$83 area.
Zac’s price confluence just below the current market suggests that there is yet one more leg down to complete all of C of (4). So, how might one view this apparent small disparity of the moment?
This methodology helps the user identify and define risk versus reward. While timing is not implied on these charts, it would seem that NFLX is much closer to an important low now. The $60-$62 zone may yet beckon in the days just ahead. We are closely tracking the structure of price in this area to see if the lower low is indeed struck or if the resistance zone starting at the $80 area is taken out first.
However, in both scenarios as shown, this current area seems to offer the potential for a wave (5) back towards the recent highs and beyond. It’s just waiting for the next crowd to fill the room.
