Nasdaq Paths Point Lower
 By
By
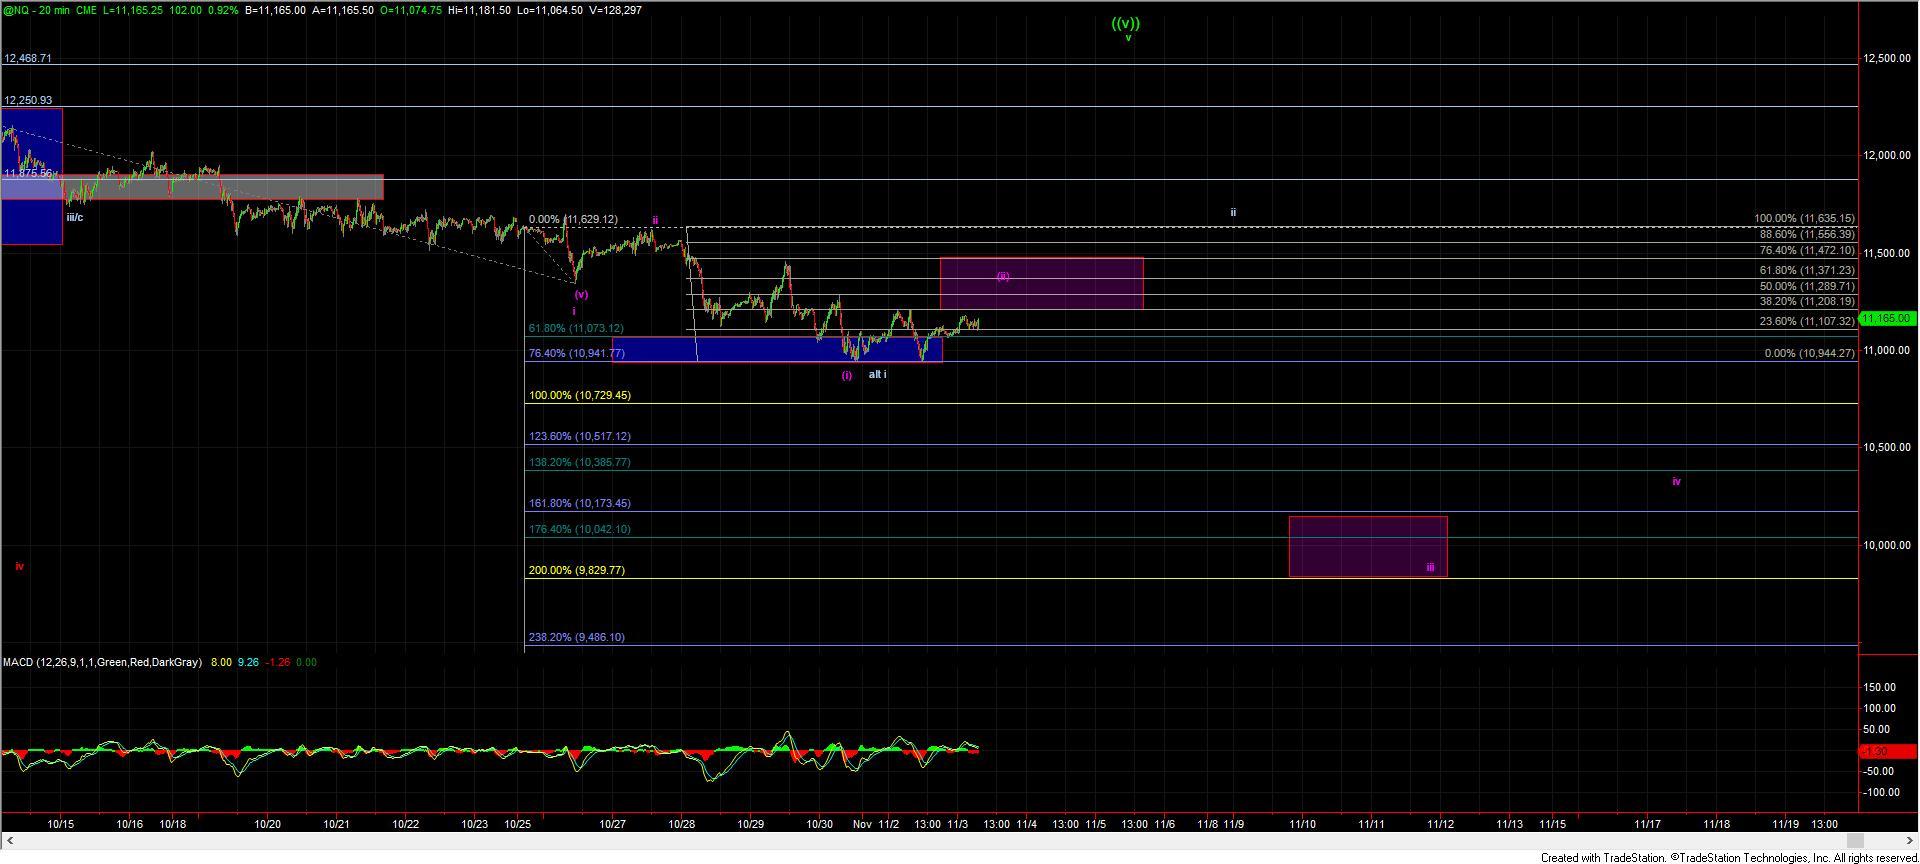
Overall this bounce has been fairly weak on the Nasdaq 100 futures (NQ) but also quite sloppy on the way down as I have been noting. This is making it difficult to track as the action has not been following the idea fibs.
With that being said, the fact that we bounced right off fo the 10,941 fib now twice certainly does have my attention and is suggestive that we may be following a i-ii (i)-(ii) down as shown in purple with yesterday's low acting as the bottom of the wave (i) of iii.
Under this case, I would be looking for the NQ to hold the 11,208-11,472 zone and then move down sharply for a strong wave (iii) of iii down towards the 10,173-9829 zone for wave iii of the larger wave (c) of 2 with ultimate targets for wave v of (c) of 2 down towards the 9486-9273 zone.
Should we break back up over the 11,629 high, then it would be suggestive that we may have formed a bottom in a larger wave i down and may be seeing a deeper retrace for a wave ii in the 11,592-11,937 zone before heading lower for the wave iii of (c) of 2 back below the 10,941 levels. Under this case, we would need the high of day under the 12,246 level, as this would invalidate the downside setup.
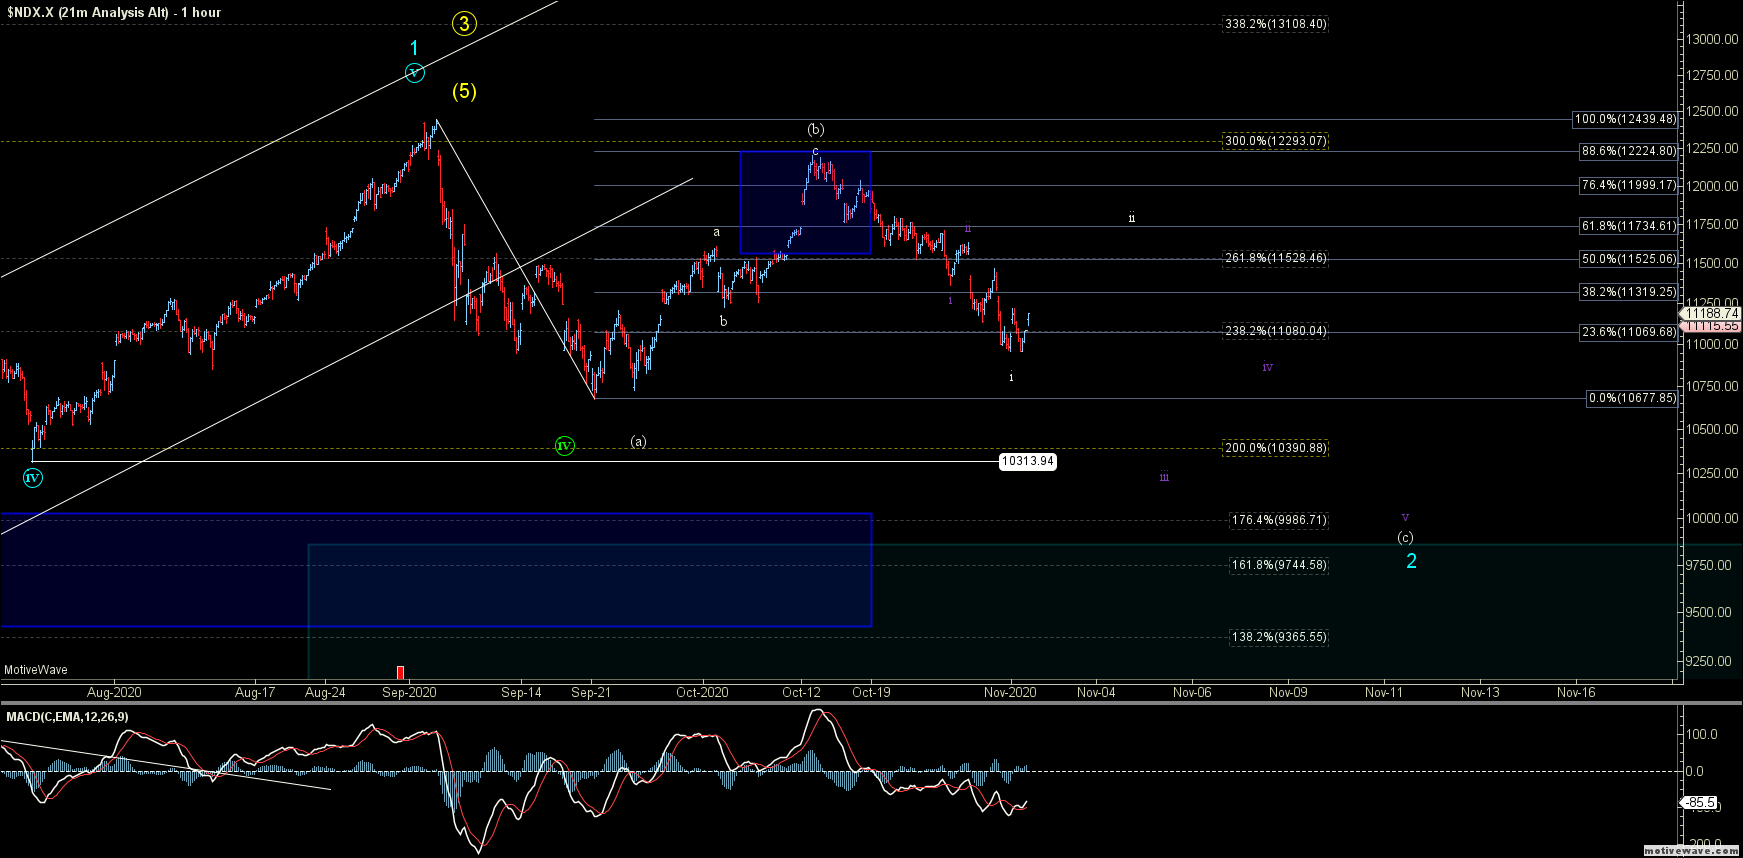
So, ultimately, both of these paths do point lower as the downside pattern is still looking quite incomplete. The bottoming path that I have is shown in green on the NDX chart and would require a truncated wave of ((iv)), but I am not giving this a high degree of likelihood at the moment.