NKE: Fundamentals At Rest — Will Sentiment Run?
 By
Levi
By
Levi
We love being able to query Lyn Alden for her clear-eyed take on the fundamental landscape. She zeroes in on the key components and provides a clear, forward-looking perspective. In the case of NKE, the outlook appears somewhat muddy for now. At times, that happens. But pictures and outlooks can change. Let’s examine the current view — and what may shift first to signal a potential run in NKE.
Here is Lyn’s recent workup on NKE stock:
“I'd defer to technicals on NKE.
The current valuation relative to analyst expectations of growth still leave a lot to be desired. I remain neutral fundamentally, and have no position.” - Lyn Alden
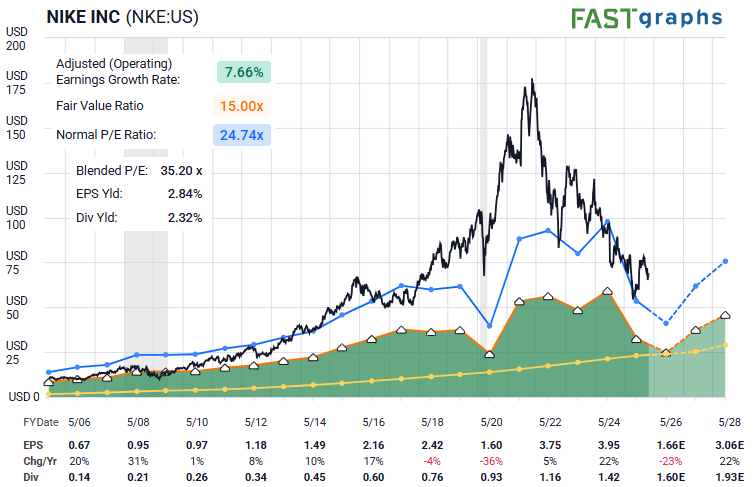
Take a look at the projected earnings growth, or rather the lack thereof, on the FAST graph shared above. Does that mean that NKE will also just slog along sideways? Not necessarily. Why not?
Sentiment Is Setting Up For A Run
Granted, not all setups are certainties. In this one for NKE, however, we’ll know when it needs adjustment — or if it may even invalidate. Let’s examine the chart shared by Zac Mannes and see what we can glean.
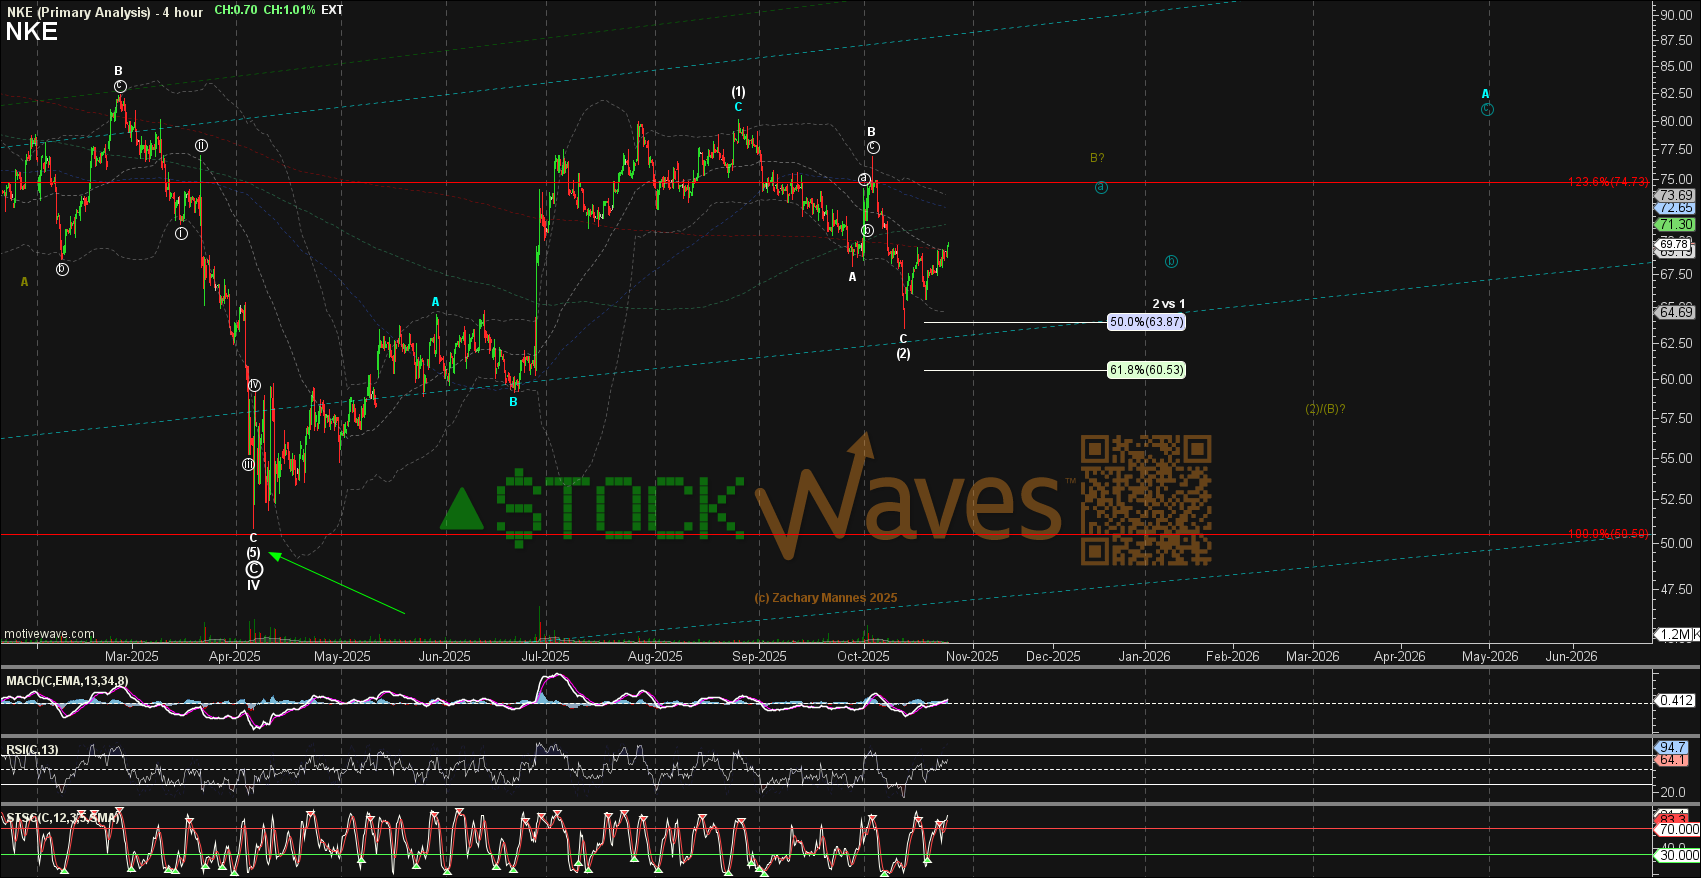
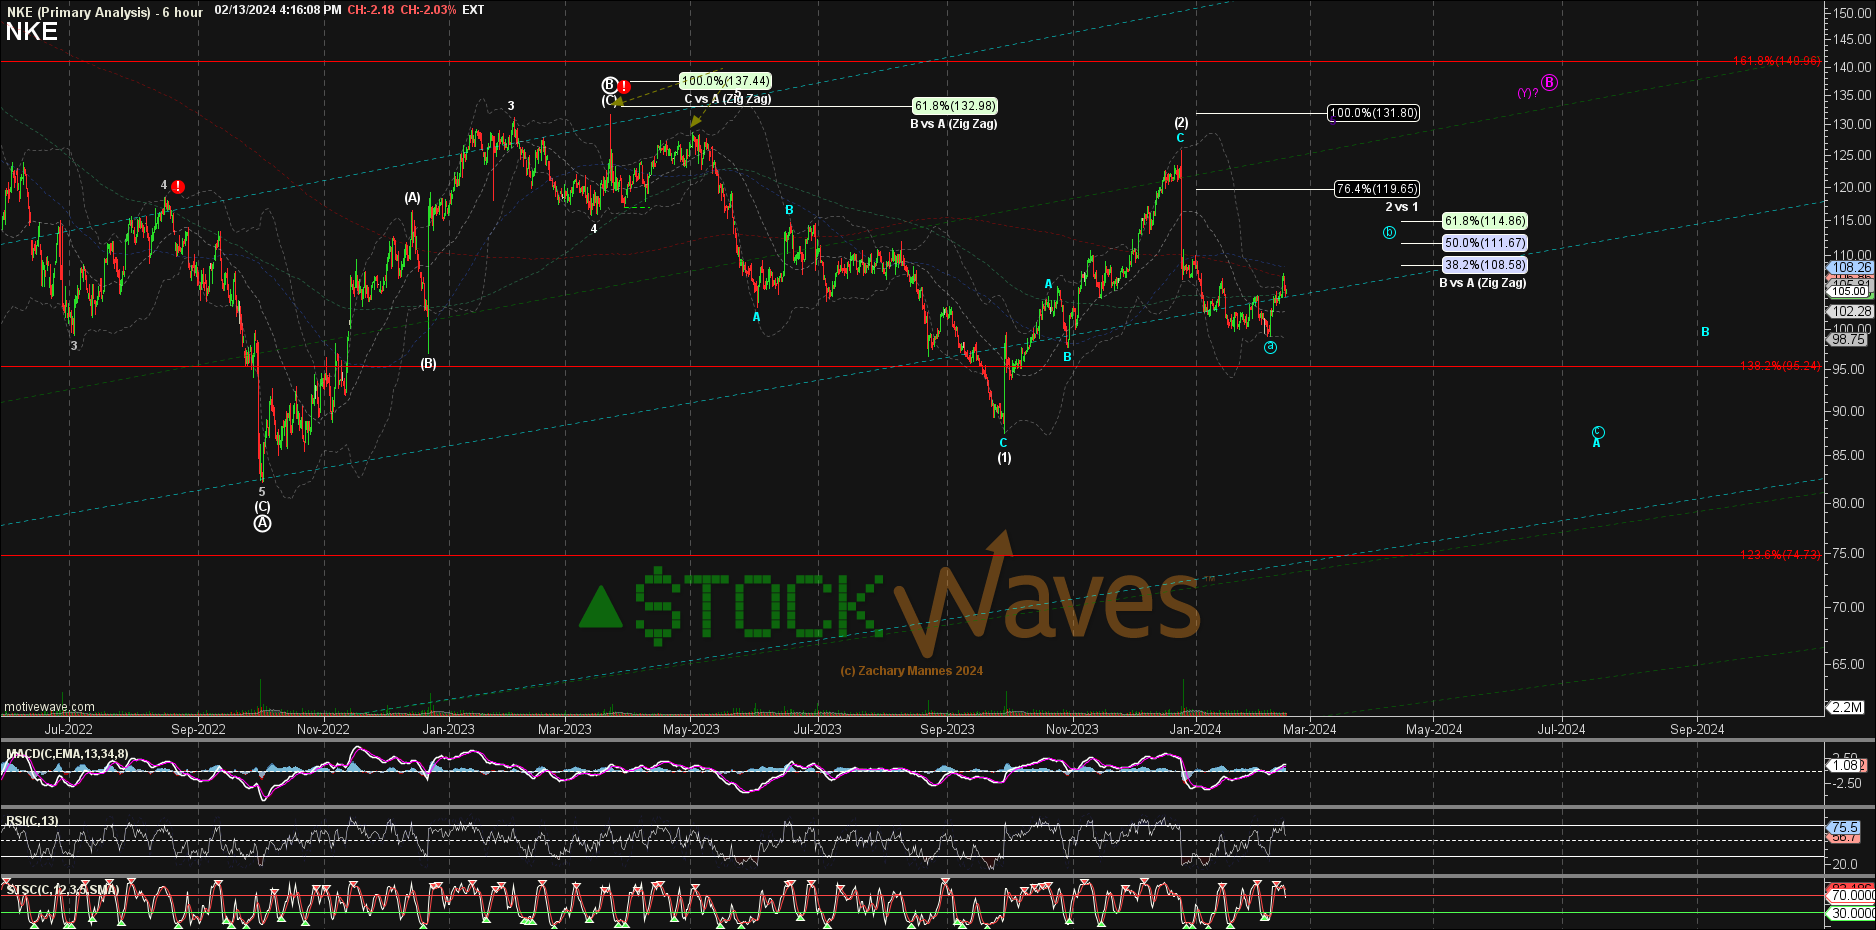
NKE is a stock that actually presented as bearish for some time. It is one that we anticipated pulling back to the mid-$50’s even as shares hovered in the $100 range. Here is Zac’s chart from early 2024 when NKE was trading at just above $100 in a corrective bounce.
Conveniently, the chart bottomed one year later, this past April in the Tariff Tantrum downturn. Since then, price has formed what looks to be a (1)-(2) rally up from those lows. What is likely to happen next?
Elliott Wave shines in its versatility and adaptability — especially when framing risk-versus-reward setups. In the case of a (1)-(2) setup such as is presenting at this time, a wave (3) will have a standard extension in the 1.618 zone overhead. That would project to $109 or even as high as $129 in a more bullish extension. But, initially we need to see the next subwaves fill in the chart.
And yes, a lower wave (2) remains plausible. So, in the near term, price could still decline to the $60-$62 area and remain bullish in the bigger picture. The overall upside projection would not technically invalidate unless price moves under the $54 area.
From either the recent $64 low or a nominally lower dip into the $60–$62 zone, we anticipate the next move up toward $74. It will then be the structure of any pullback seen that will help determine if it was a corrective move higher or a bullish beginning to wave (3).
So, even though fundamentals appear flat here, this one may just be lacing up its spikes for a run.
