NDX Attempting To Form A Bottom?
 By
By
With the break of the 14,821 low, the Nasdaq 100 is now looking to be following the larger wave c of ((4)).
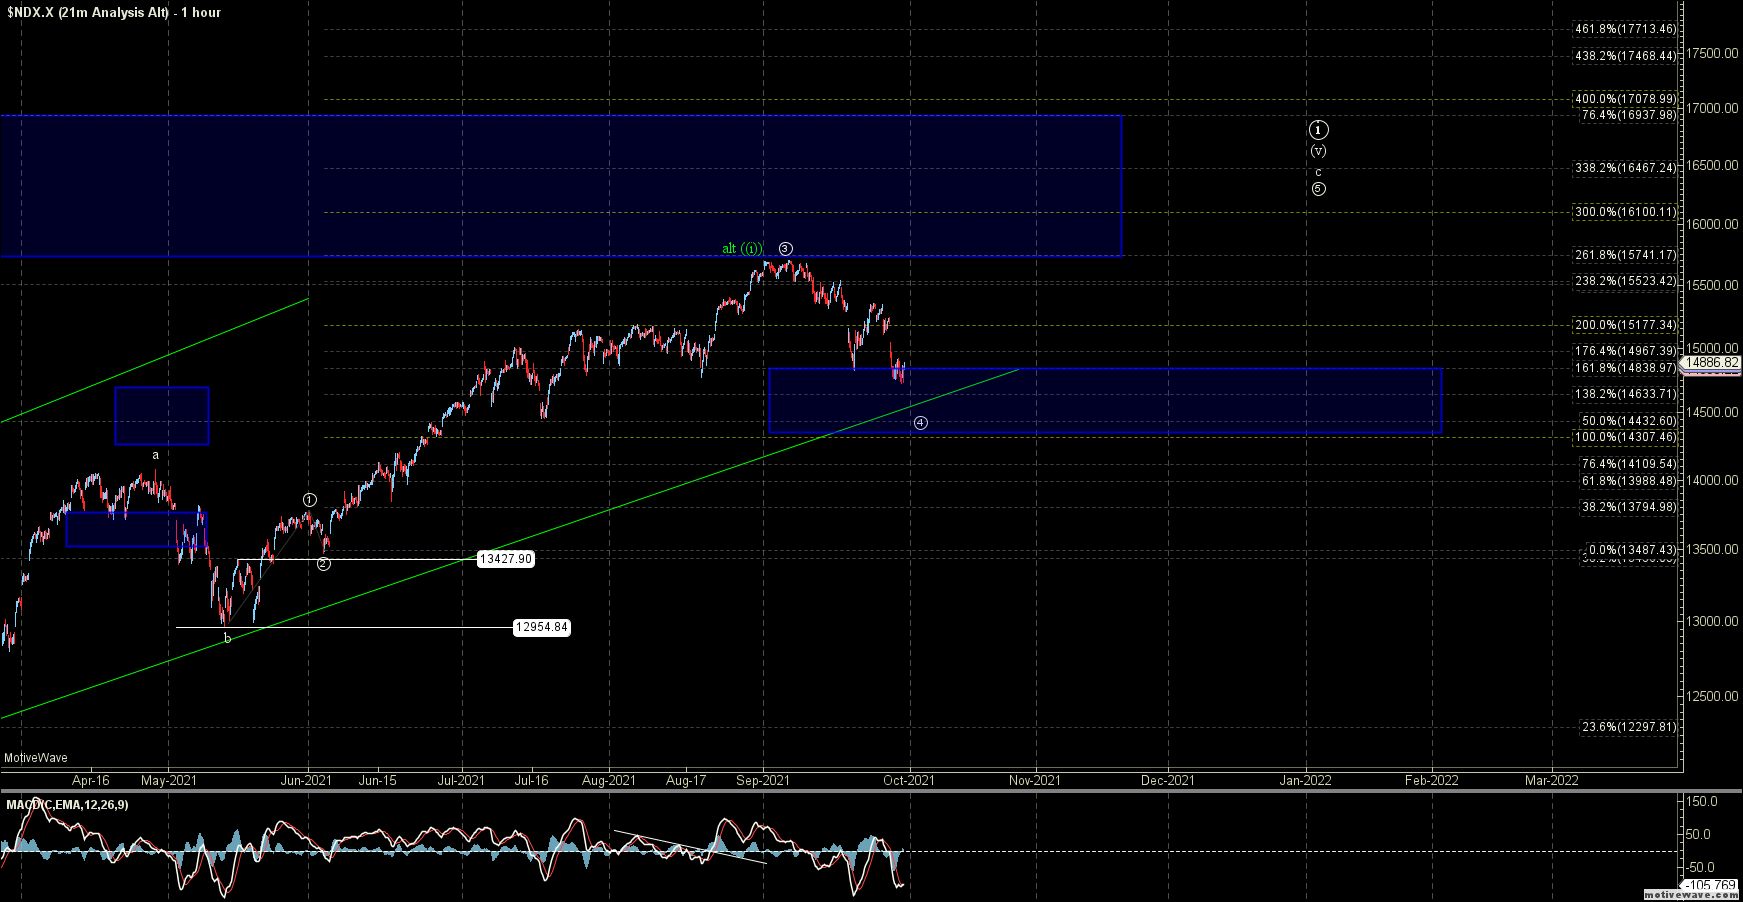
I am going to allow for this to now push as low as 14,307 and still be part of that wave ((4)), which I am showing in white still needing another push higher in the wave ((5)). Under this case, we would need to see a full five up off of the lows and a push back up over the 15,345 high to suggest that a bottom has indeed been found.
If we see a corrective push up off of the lows followed by a break below that 14,307 level, then It would signal that we have indeed formed a larger degree top, under which case I would expect to see a deeper corrective pattern. I will note that we are starting to form some divergence on the 60m MACD here, but we still need to confirm this with a continued push higher as well as seeing that full five up off of the lows.
So, while there are some good early signals that this may be attempting to form a bottom in the near term, I still will remain somewhat cautious on this chart until we can see a clean five up off of the lows and/or a break over the 15,345 level.