MoodMusing: Schrodinger’s Turquoise Cat
 By
By
It was days before the Las Vegas shooting in October of 2017. There was a relatively long Elliott Wave diagonal in progress, and I was having trouble discerning the signal orientation of the mood pattern charts that I use for looking at upcoming news themes. It really mattered to know which of two possibilities were in play, because one of them meant an almost certain terrorist attack in the United States. Even more concerning on a personal level, was that my latest attempt at mapping this potential event showed the highest probability for it to be in Denver, CO where I had family members (see map below). It was only after the event, that I discovered that Las Vegas was the centerpoint of what showed on the map as an identified area of likely disruption and an identified area of likely destruction.
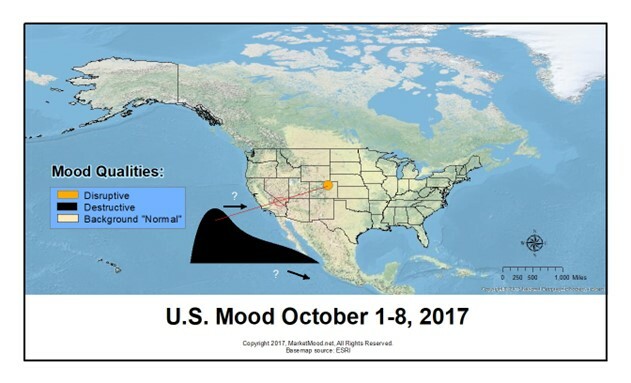
In a moment of frustration and exasperation, one day before the shooting, I proposed in this post that the potential attack might be stopped if the “flip” (signal orientation) of the mood pattern was inverted. In that case the market would be up instead of down, and the news would be more on the random or bizarre side than tragic.
The tragic event occurred, and I learned something about moodmapping. More pertinent to our current situation, I discovered the Schrodinger’s cat nature of Elliott Wave diagonals. During a diagonal, there are in a sense, two overlapping realities of mood or sentiment. The news themes that would be occurring with the current mood pattern are taking place, and its opposite, which would be occurring during an inverted or flipped condition are also present. In the case of the Las Vegas shooting, it was both terrorist attack-like and it was random and bizarre. Both “cats” were present at the same time. There was no way to tell which way was up with the mood pattern nor which way the market was going to go until after this “wave” collapsed into its final form.
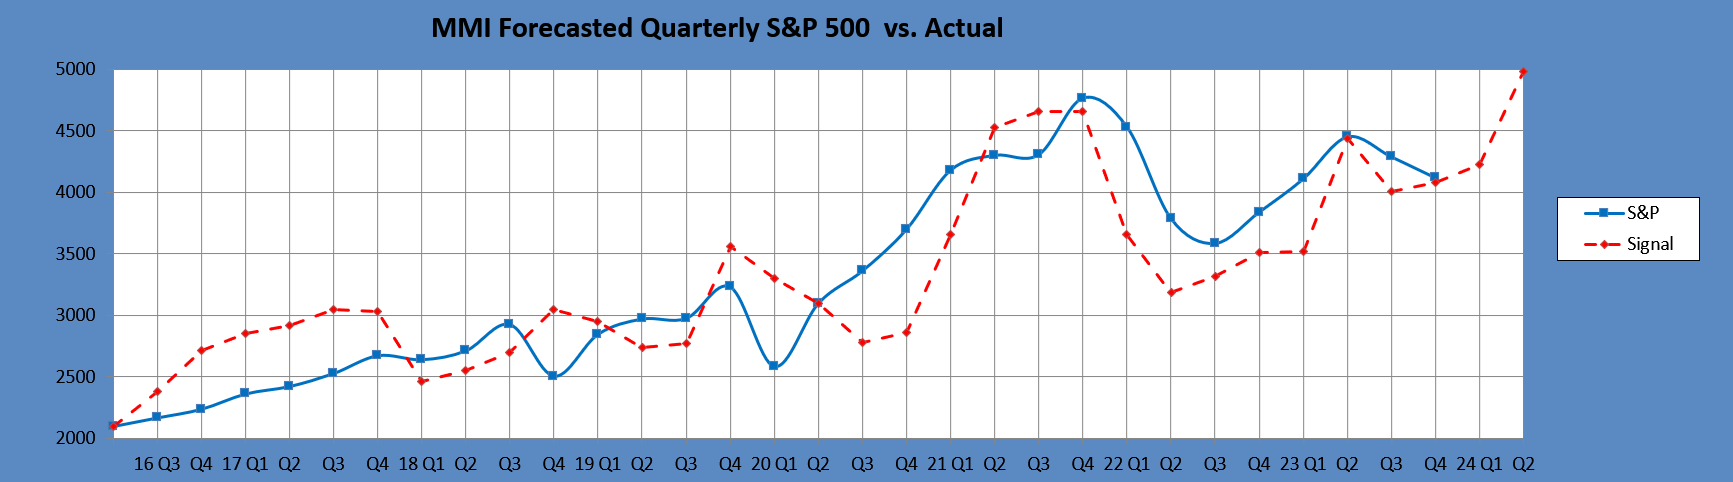
Fast forward to 2023. I just read Avi Gilbert’s most thoughtful article on where the market is at and its implications. For some time, there have been a few very important but unresolvable wave counts with quite different paths for the year ahead. In reviewing the parameters presented in this article it dawned on me that there are some commonalities here with the unresolvable charts which I have been struggling with for much of this year. He mentioned giving the market room to prove that it “can rally to the 5000 region before the bear market I expect begins in earnest.” Below is the MMI vs. S&P 500 quarterly chart which has seemed to me to be too uber-bullish to be true. I have not been able to reconcile this with the shorter term charts and thus have kept it private until this moment.
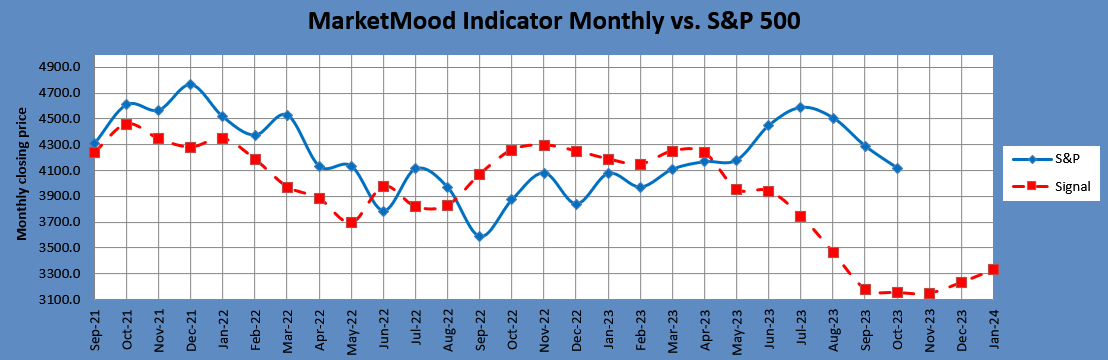
Later in the article, Avi mentions a much more bearish scenario which could take the market down to 2900-3300 SPX. This lines up with what was my primary monthly MMI vs. S&P 500 chart which was so uber-bearish I didn’t disclose it until I could later come up with some more moderate alternatives.
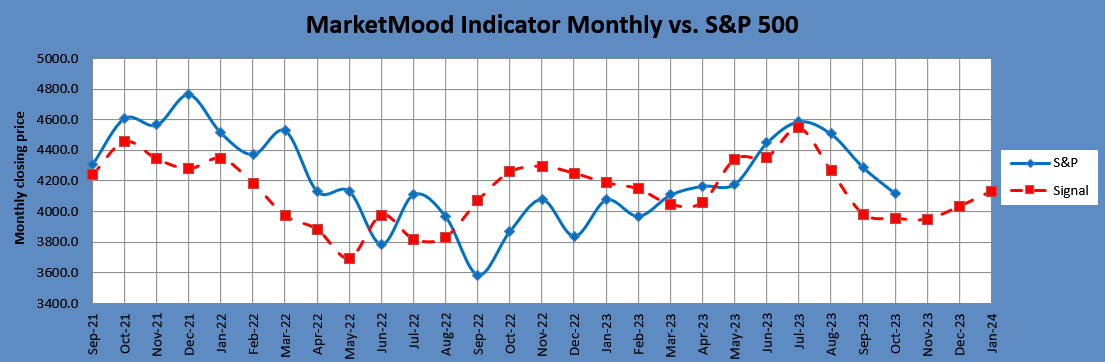
In order to make this alternative and now primary monthly chart (below), I had to break a previously never-failed flip rule which I was really hesitant to do. So far, it has been tracking the market and allows me to sleep better at night than the previous primary case, at least for now.
Back to the topic of diagonals. According to how I normally track flips or inversions, both the uber-bullish quarterly chart and the uber-bearish monthly chart would be my primary charts. I can’t resolve the apparent discrepancy and am using the new monthly chart as a temporary band-aid for now. I am holding on to the uber-bullish potential partly because I just want to hang on to the possibility of one more year before the Great Bear begins. However, the reason that it’s valid to hold onto both possibilities for now is because a large diagonal looks to be in play. Yet, looking at Avi’s wave counts, if a diagonal is in play, then his Green count becomes prominent and my uber-bearish monthly chart steps back into the foreground. It is my hope that there is another yet unknown possibility. Instead of a Blue count or a Green count perhaps there’s a less ominous “Turquoise” count, which won’t be apparent until the diagonal resolves and the two simultaneous cats collapse into a single and obvious presentation. Until then, I must resign myself to the possibility of the most bearish case and at the same time hold on to the potential of the most bullish case. Remember, until this is resolved, it is not either one or the other. Until the wave collapses, there are two cats, there are two unreconcilable counts, and there are two unreconcilable charts.
