Miners and Metals In Different Worlds
There is one constant which still seems to be pervasive through the entire complex, and that is lower lows are more likely than not. However, the set up for those lower lows is more immediately evident in the GDX, whereas the GLD is close to invalidating its immediate bearish set up.
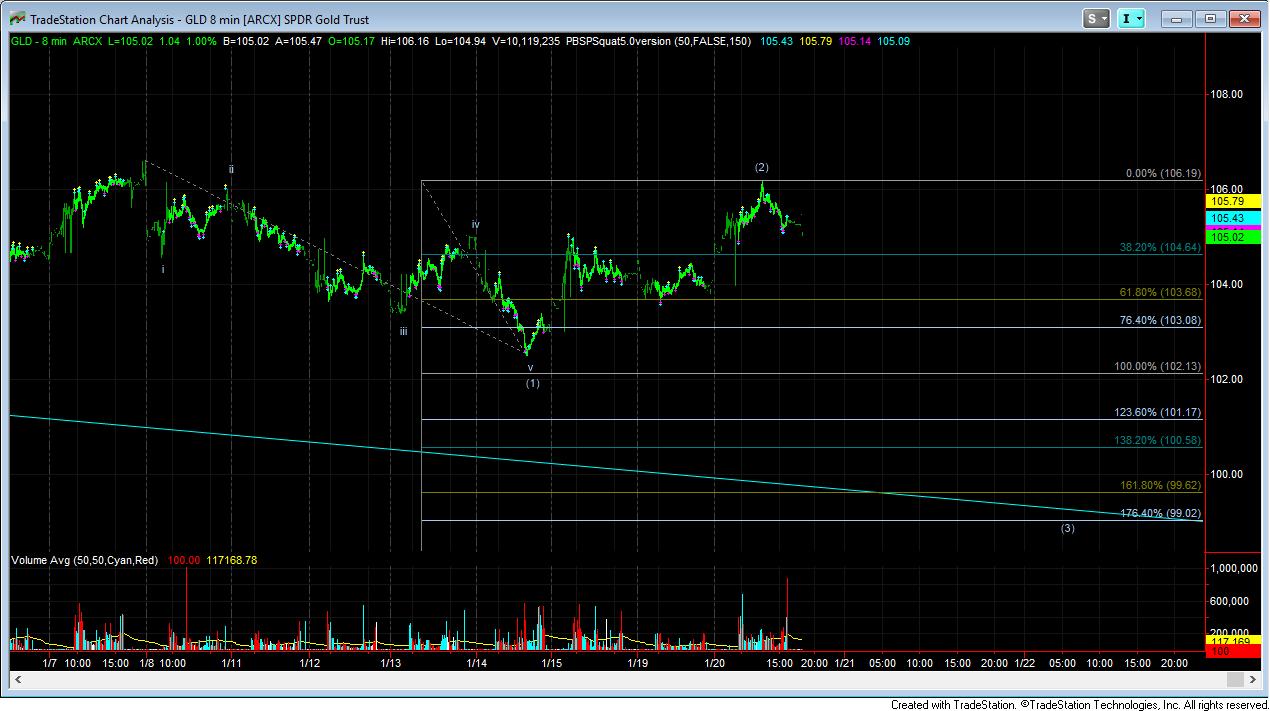
In starting with the GLD, as you can see from the attached 8 minute chart, the market has retraced a significant amount of the initial 5 waves down. While the potential initial 5 down can only be counted as a leading diagonal – of which I am not fond since they are not highly reliable – leading diagonals often see deep retracements in their 2nd waves. So, along those lines, this sizable retracement does make sense. However, in order to maintain this count, the GLD cannot surpass the 106.35 level, which would take it beyond the start of wave (1) down, thereby invalidating the immediate downside set up. This would likely mean a higher move will be seen to complete a much more complex 4th wave, which then would set up the final decline. In the current immediate set up, the minimal target is the long term target we set in the 98 region (2.00 extension), with the potential to drop as low as the 95 region (2.618 extension).
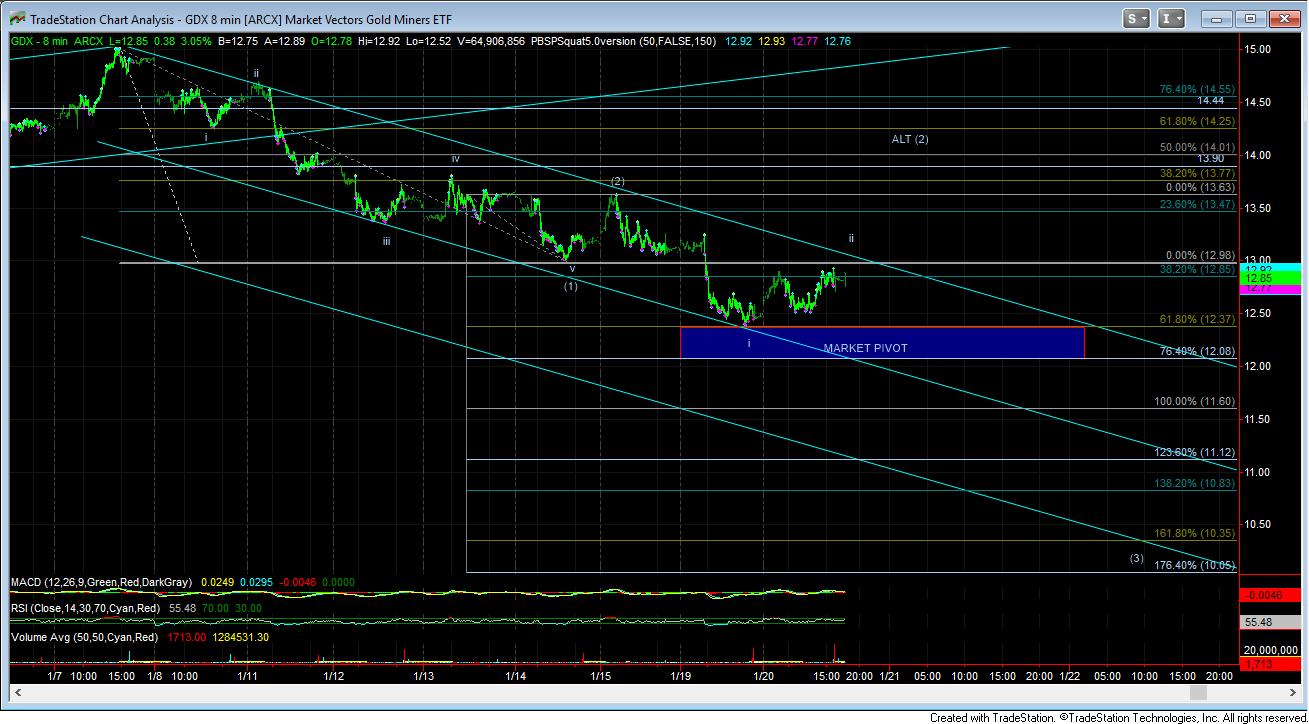
As far as the GDX, the most bearish case scenario has us in a (1)(2), I-ii set up to the downside, which means the heart of a 3rd wave down should be about to take hold. But, it too has its own issues. There are several segments in this move down that truly count better as 3 wave structure, especially the last move down to our market pivot. There can be multiple interpretations here, but we ill allow the Fib levels to guide us through. So, as long as the market maintains below 13.62, I will view this set up more aggressively and consider that we are about to break down to the 9.65 region target we set as the lower end of our targets box several years ago. A break down below our market pivot, which is then unable to move back over the market pivot on a bounce is the strong signal we are on our way to finish off the long term correcgtion.
However, should the market move past that level, then I have to assume that the low we struck at our market pivot was really a larger leading diagonal down for wave (1), with the potential for a deep retracement to be seen for wave (2), which can take us back to the 14-14.50 region.
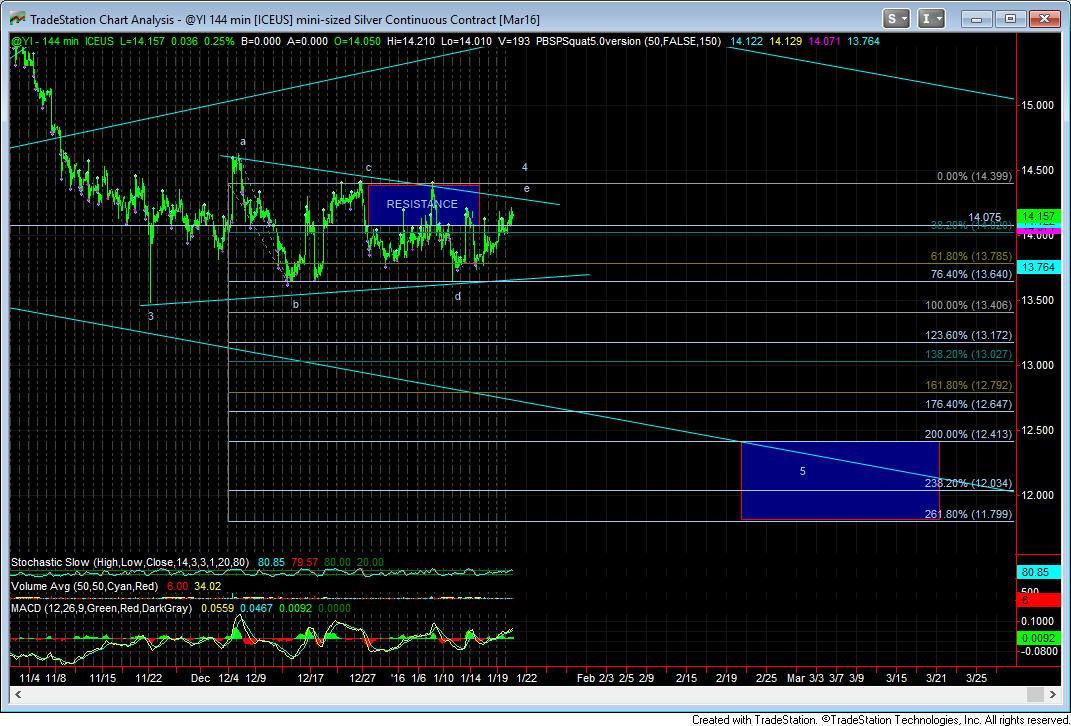
So, I then turn to silver, and try to figure out which of the two potentials work best, and it, too, has a different pattern. Silver can also count as a 1-2 down, or even as just completing a triangle, as noted in the 144 minute chart attached.
Ultimately, it still leaves us with many questions as to the “how” we get to those lower targets, but all set ups right now suggest that those lower lows will likely still be struck before this long term correction has completed. For now, I am going to maintain the immediate bearish perspective, as noted in the GDX set up, and expecting that GLD and silver will simply catch up. But, clearly, I cannot say that I have extremely high confidence in the immediate set ups, especially with a different pattern potential being traced out on the 3 different charts. So, I will remain with the trend, and assume we are about to break down, until the market tells us otherwise.