
Micron: Sales Multiple Says Stop — Cash Flow Says Go
 By
Levi
By
Levi
Micron has put investors in an uncomfortable position. The stock is trading near the richest price-to-sales ratio in its public history, and the forward cash flow estimates make it look inexpensive at the same time. Both statements are supported by the data. Neither one cancels the other.
That is the setup worth thinking through before the next move decides it for you.
The Sentiment Extreme Is Real
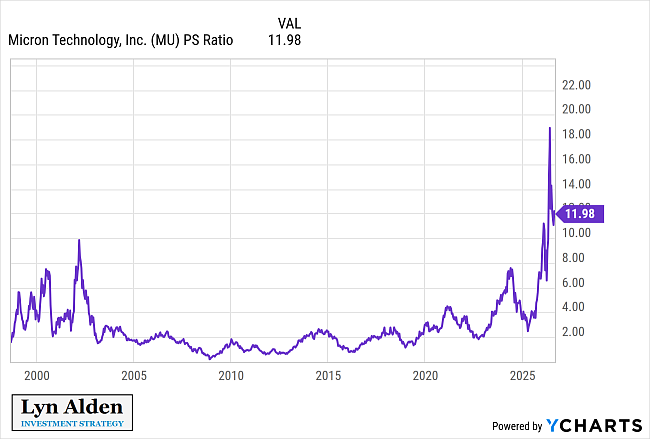
Micron's price-to-sales ratio sits at 11.98. For context on what that means, the ratio spent most of the last twenty-five years between 1 and 3. The 2002 spike reached roughly 9.5 and stood as the high-water mark for two decades. The 2024 run topped out near 7. The recent surge carried above 18 before pulling back to current levels.
There is no prior reading on this chart that says the market has been here before and it worked out fine. It has not been here before.
Sentiment on the name matches the multiple. The bull run has been long, the coverage has been favorable, and the demand narrative is repeated without much pushback. That combination is what an extreme looks like from the inside. It never announces itself as one.
The Earnings Are Not Fiction
Here is where the case gets complicated for anyone wanting to write this off as a bubble.
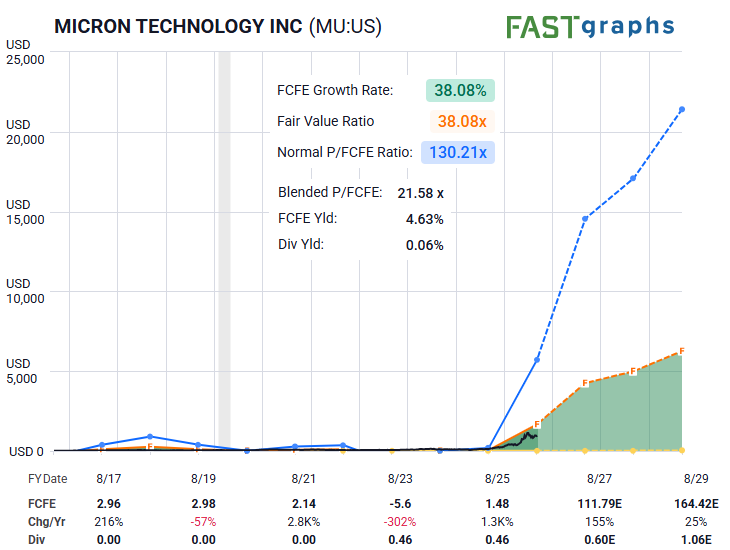
Micron's fiscal 2023 free cash flow to equity was negative. Fiscal 2025 came in at 1.48. Current estimates put fiscal 2027 at 111.79 and fiscal 2029 at 164.42. Whatever you think of forward estimates as a category, that is not a company treading water while its stock runs.
Run those numbers against the price and the blended price-to-free-cash-flow-to-equity multiple works out to 21.58x. The normal multiple for the name over the measured history is 130.21x. The free cash flow yield is 4.63%. The FCFE growth rate is 38.08%.
So the stock is at a multiple of sales without precedent and roughly one-sixth of its historical multiple of cash flow. Those two facts describe the same company on the same day.
Lyn Alden's Read
Lyn Alden framed the tension this way:
"MU has a huge fundamental variance. I've primarily been playing that by selling options to farm the premiums, rather than to bet near-term on its price directionality.
Two things are true simultaneously:
-Micron is trading at a historically high price/sales ratio, after a historically strong bull run, with historically positive sentiment.
-Micron's growth has been pretty justified by earnings and free cash flow. They really do have trouble keeping up with so much demand, and this has been different than all prior cycles at how large and persistent that demand is. AI opened a floodgate of new demand for memory that isn't going away any time soon.
I actually err toward bullishness on this one, but cautiously. I sell options with a long bias at this time.
The main risk I'm watching is the rise of Chinese memory. Historically, three companies control well over 90% of the global supply of memory, but with so much demand and national strategic importance, China is getting into the space in a big way, which will likely seriously disrupt the existing triad of memory companies.” — Lyn Alden
The China point deserves its own paragraph. Memory has been an oligopoly for a long time, and oligopoly pricing power is a large part of why this cycle has produced the cash flow it has. A fourth major supplier operating with state backing and strategic patience changes the arithmetic of every forward estimate on the page. That risk does not show up in a wave count. It shows up years later, in the denominator.
What The Structure Is Telling Us Now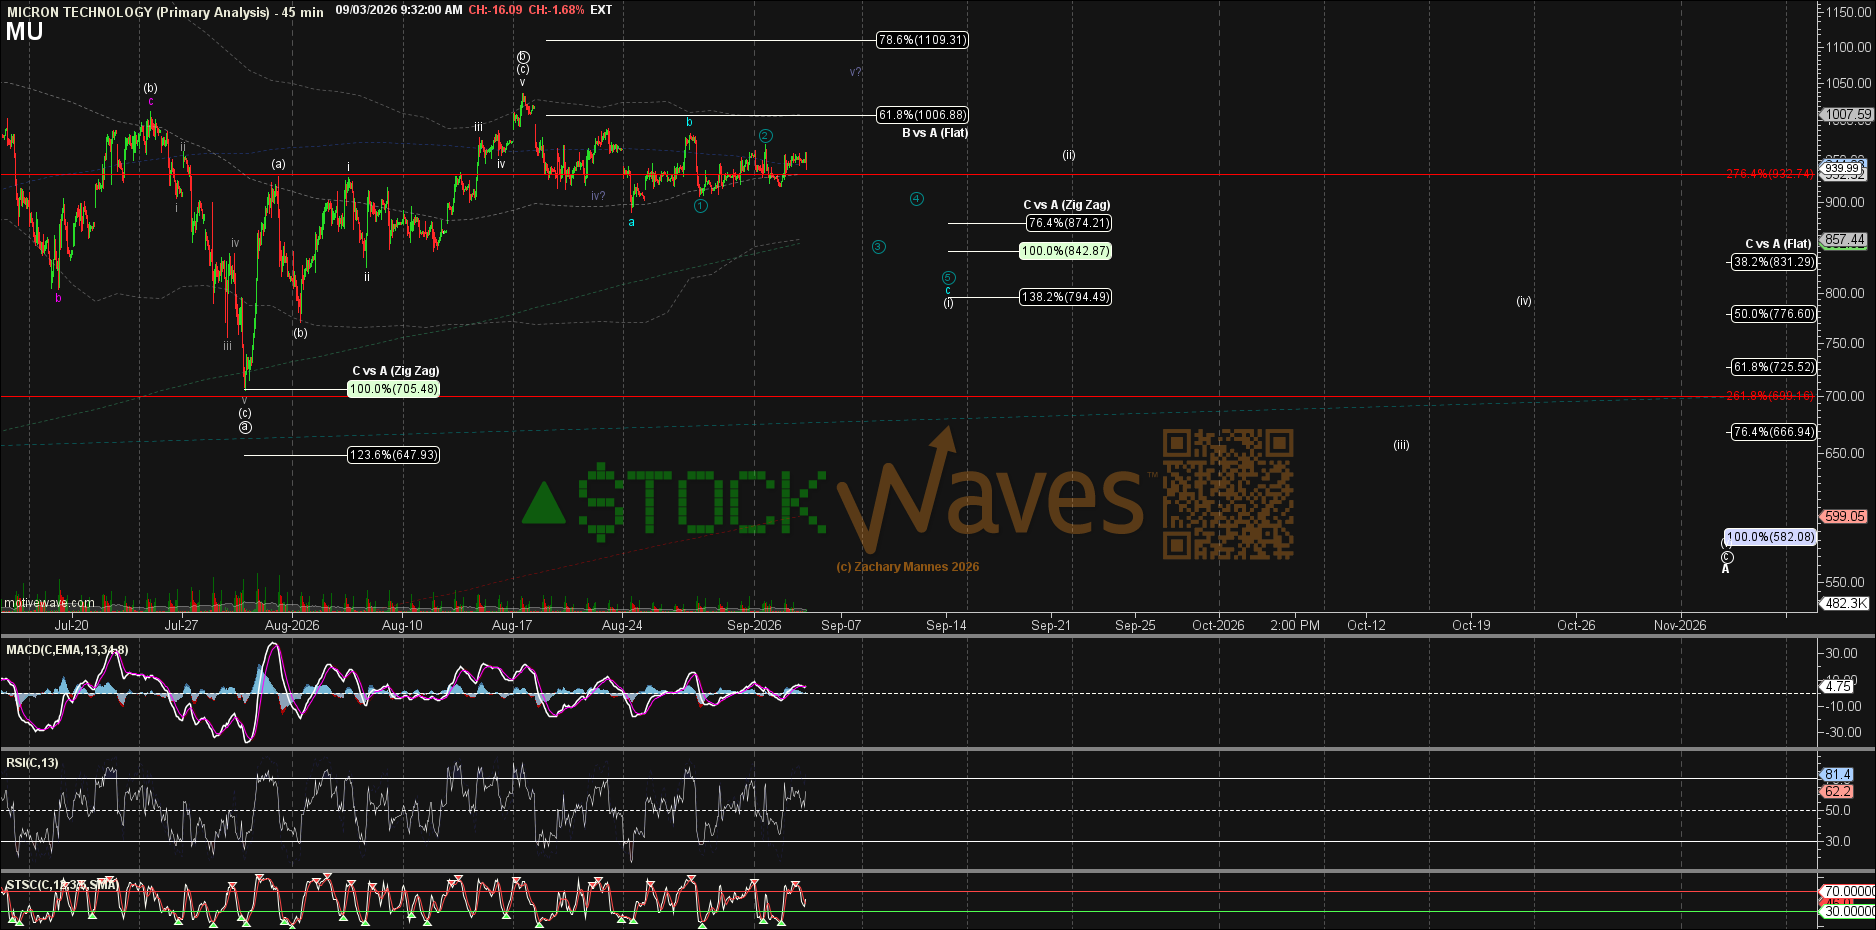
Zac Mannes has the count tracking a corrective decline off the highs near 1040. This appears to be part of a larger A wave down. Inside this A wave price is in the lesser degree circle ‘c’. And drilling down into the structure of that subwave, we are now forming wave (i) down.
This is to instruct us to anticipate near-term downside after a brief bounce in wave (ii). The downside setup remains intact for as long as price holds under the circle ‘b’ wave high at 1036. A stronger bearish setup would form once waves (i) and (ii) are in place. It would also tell us a more likely target for all of the circle ‘c’ of A.
Should price instead reclaim the 1036 area then it is either an extension of the circle ‘b’ or a deeper upside corrective move.
Holding Both
The mistake available here is picking one side of the fundamental picture and treating the other as noise. The multiple bears are looking at a real chart. The cash flow bulls are looking at real estimates. What separates them is a question nobody can answer from the data on hand: whether the demand that justified the run persists long enough for the earnings to grow into the price, and whether Chinese supply arrives before that happens.
Selling premium against the variance, as Lyn Alden describes, is one coherent answer to that question. It monetizes the uncertainty instead of resolving it.
The other coherent answer is to let the structure of price on the chart do the deciding. The parameters are already drawn. Below 1036, the burden of proof sits with the bulls. Above it, this correction was shallower than it appeared and the cash flow side of the argument gets the next word.
No one knows for sure which way that resolves. That is not the same as being left in the lurch. Our methodology finds the synergy between fundamentals and technicals. The technicals are the study of human behavior patterns that repeat from the smaller price structures to the larger ones. Viewed through a probabilistic lens, those structures give us the likely paths and the clean parameters that tell us when to revise them.
That is the only workable answer to a company trading at a multiple of sales it has never held before and a fraction of its normal multiple of cash flow. You do not have to resolve the contradiction. You have to know which side price is arguing for, and where it changes its mind.
Right now it is arguing lower. 1036 is where it stops.
