Metals Turn Towards Hatred
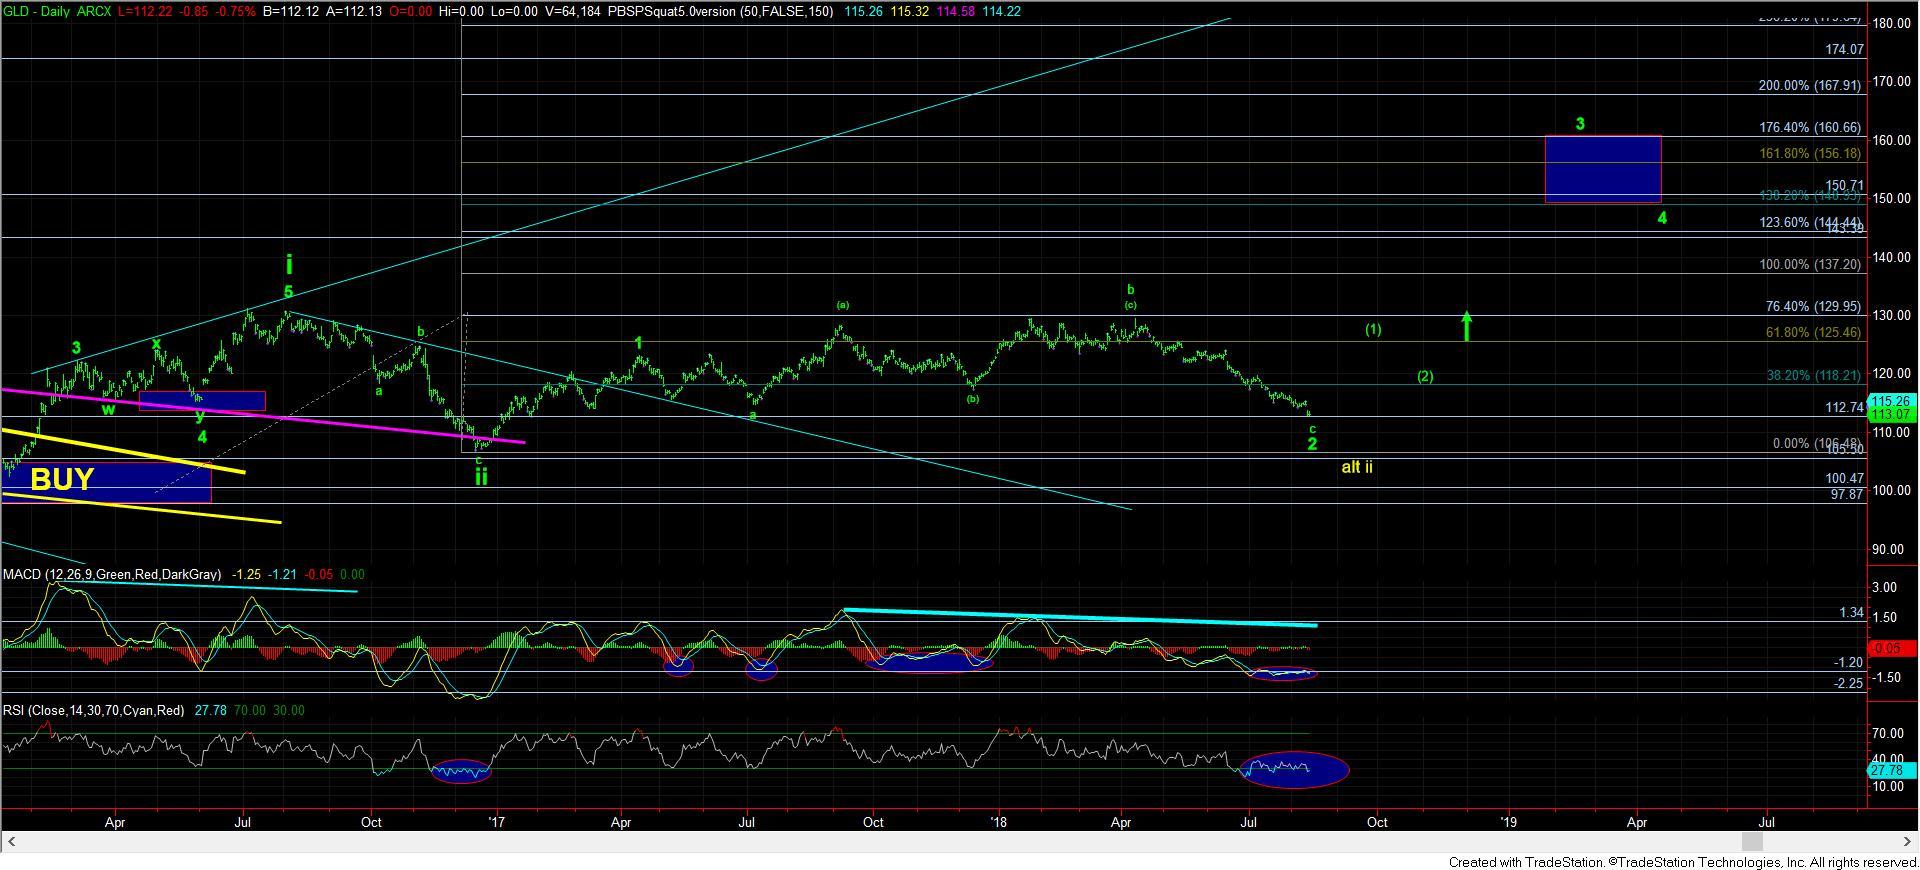
When we came into 2018, I had a VERY bullish set up in the GLD and entire metals complex. We had a 1-2, i-ii set up, and the market just had to take out resistance to trigger that set up. In fact, we have had this same set up for the better part of the last year and half. But, as I also said as we came into 2018, I needed to see GLD hold the 119 region to maintain this strong set up.
Unfortunately, GLD was unable to hold the 119 region, and then proceeded to break the next support at 117.40. I wish I was able to control the market, but, alas, I cannot. In fact, no one can, despite all the talk about “manipulation.” Rather, I have to follow the market, and the break of 119 was clearly an early warning, as we outlined at the time.
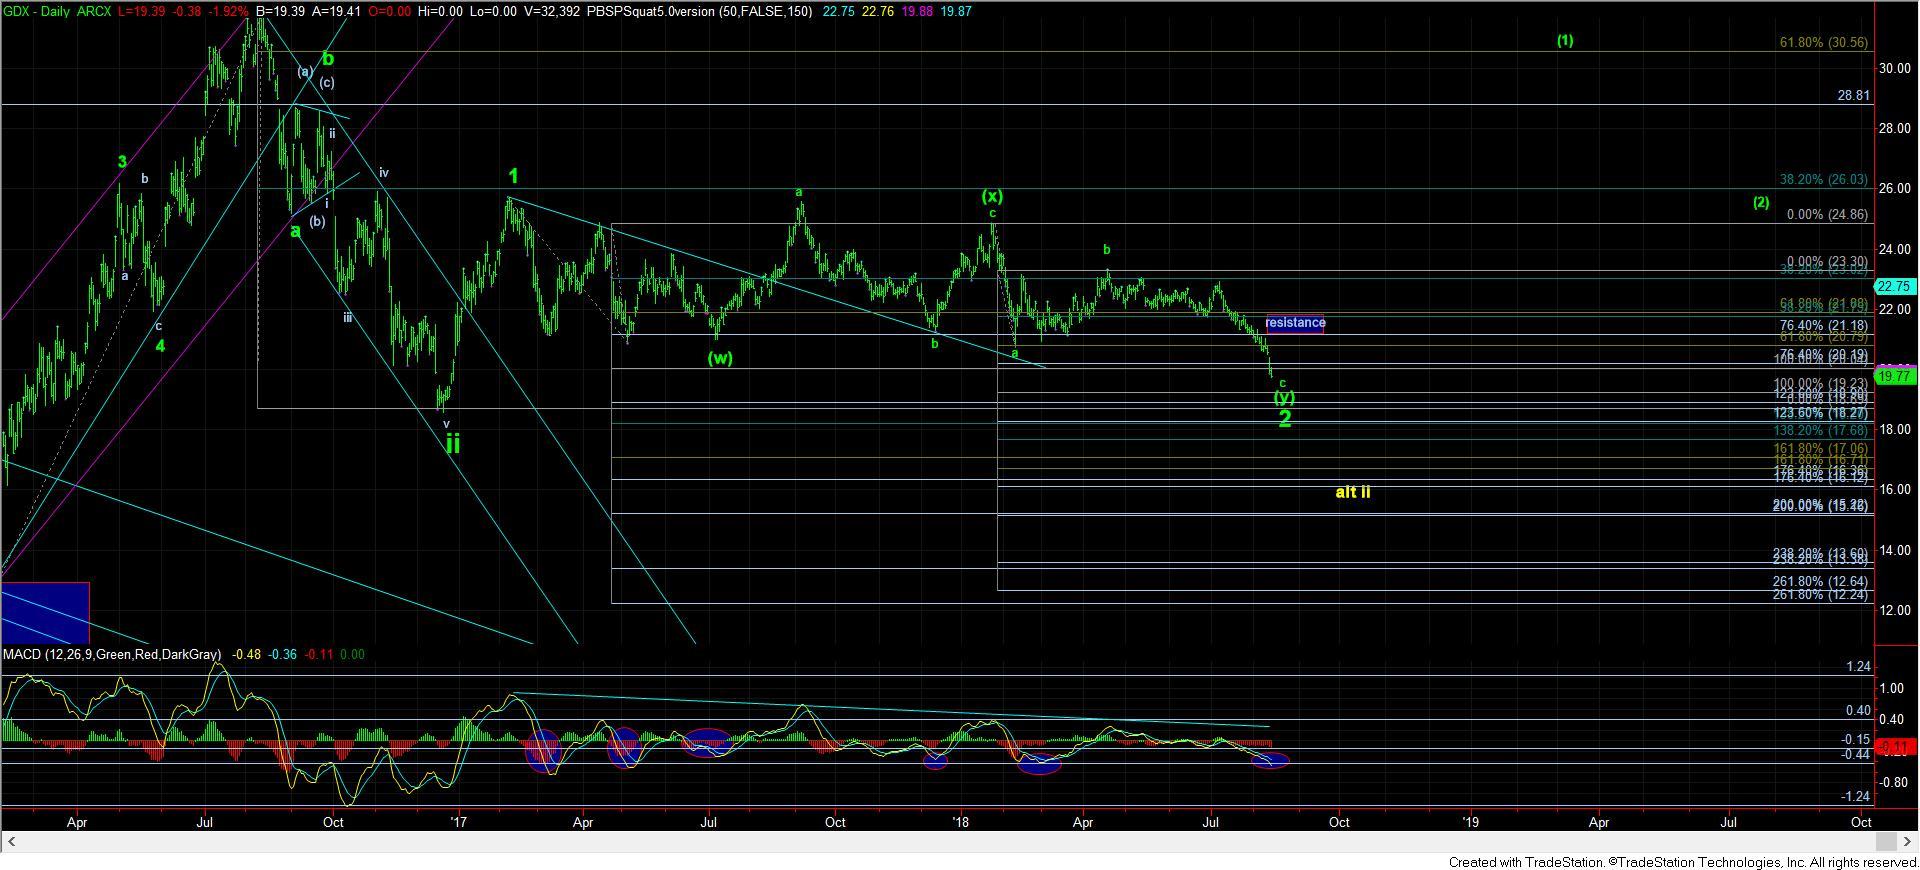
Moreover, a number of miners dropped a bit more than I had wanted to see this past week, and dragged the GDX down with it. To be honest, I have an issue trusting the GDX count due to the complexity, as it is being pushed and pulled by the various miners, which really are all over the board. For this reason, I have really not been focusing heavily on the GDX until the market as a whole begins to line up within some form of relative perspective.
So, when I look at NEM (one of the larger holdings in the GDX), it clearly broke the 35 support I wanted to see hold, at which time I posted that it has opened up to drop as deeply as the 30/31 region for a final low.
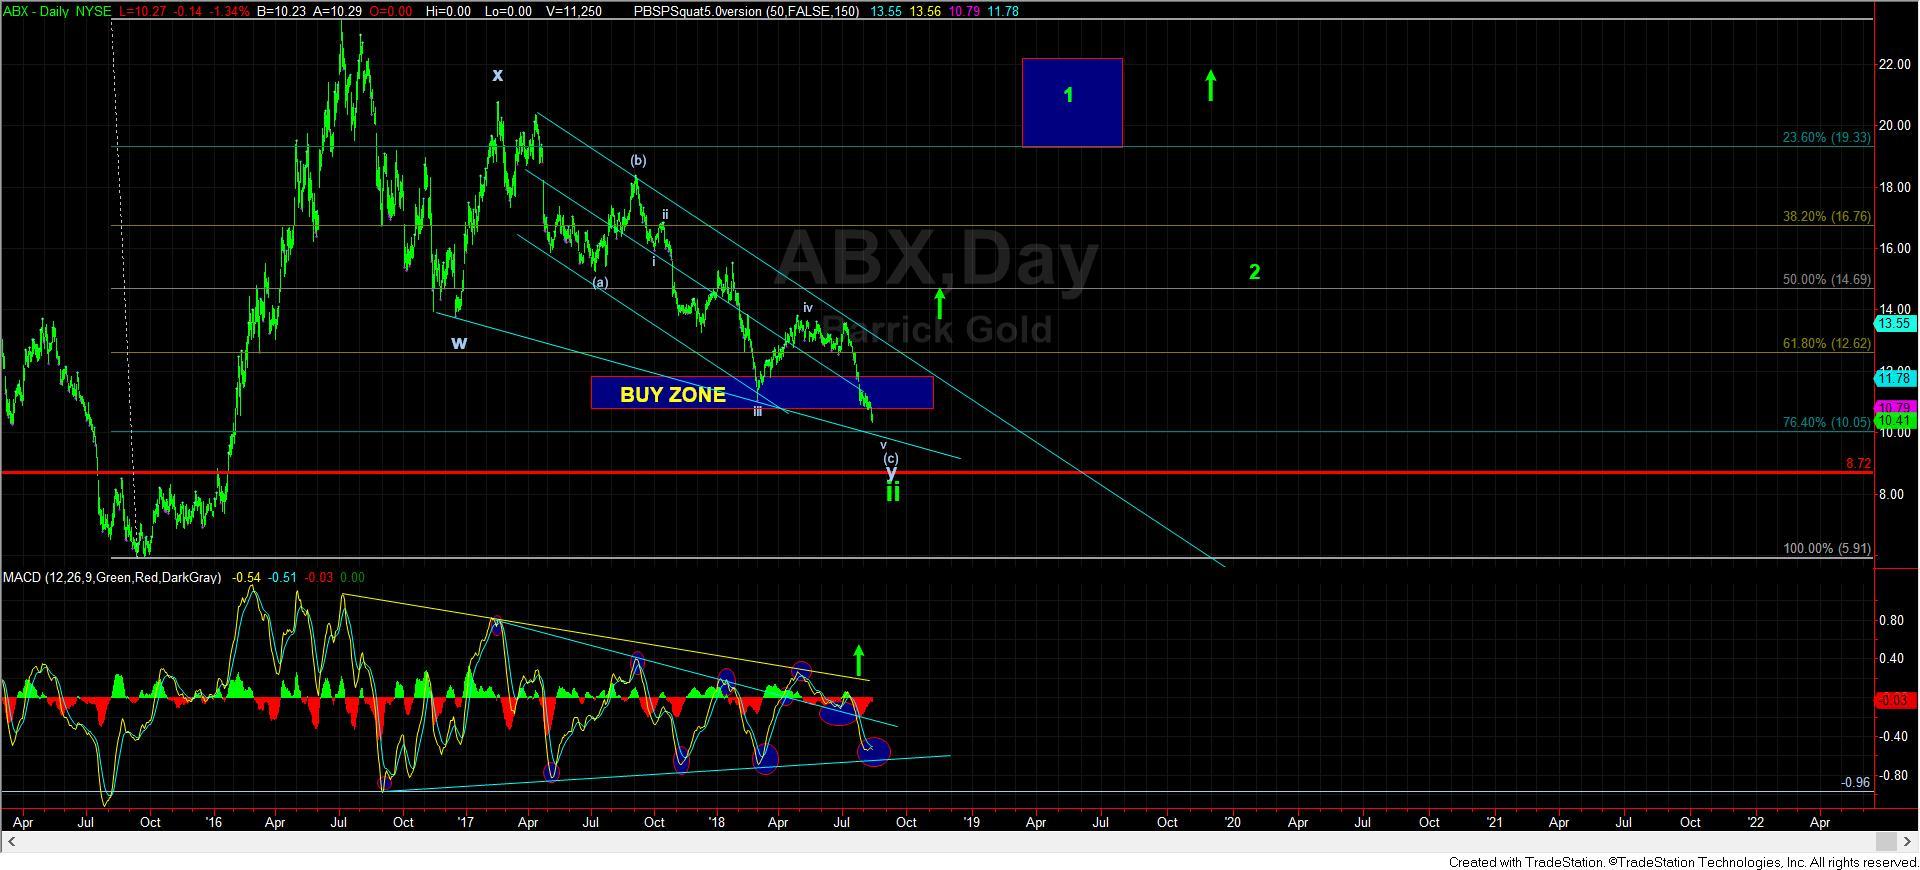
Yet, when I look at the ABX daily chart, even though we are making slightly lower lows relative to the March low, I really have a hard time viewing it bearishly. We are developing even further technical positive divergences at these lower lows, and have been doing so all the way down in this y-wave, relative to the x-wave. This is typical of 2nd wave retracements, as the selling pressure subsides during a y-wave or c-wave in a corrective pullback. And, since we are fully baked on the count in this c-wave within this y-wave, the count and technicals are incredibly aligned for this finally nearing a bottom in a long-term wave ii, as presented on the chart. Moreover, divergences this extreme should allow the rubber band to snap back in the opposite direction quite strongly once the bottom has been struck.
Also, since this market seems so divided between where the various miners are within their wave counts, we may see miners like ABX lead off the bottom like they did in 2015. So, even if NEM may push lower in the coming weeks, it would not shock me to see the ABX bottom much earlier and begin its rally even while other miners still continue to bottom out. So, again, I think it is much more important to review each miner chart individually rather than simply relying on the GDX, as the NEM may drag it down even though other miners may set up much more bullishly as there is much divergence between the various charts.
At this time, I see many people speaking out of emotion in this complex. Many see a downtrend and assume it will continue unabated. Moreover, the market is doing exactly what it should be doing to investors in making them believe that the bear market is certainly back, and there is no way possible the market can turn around.
However, I really do not want to speak from the emotion of fear, nor do I want to speak from a perspective of hope. Rather, I want to speak about what I am seeing in various charts. And, the break down in GLD below 119 and follow through below 117.40 is what has placed us within the precarious position we now find ourselves, but one cannot say they were not forewarned about what may occur if those levels broke. Yet, I will not assume it will continue unabated in a linear fashion, especially as many charts are completing downside counts, with supporting positive divergences evident on almost all time frames.
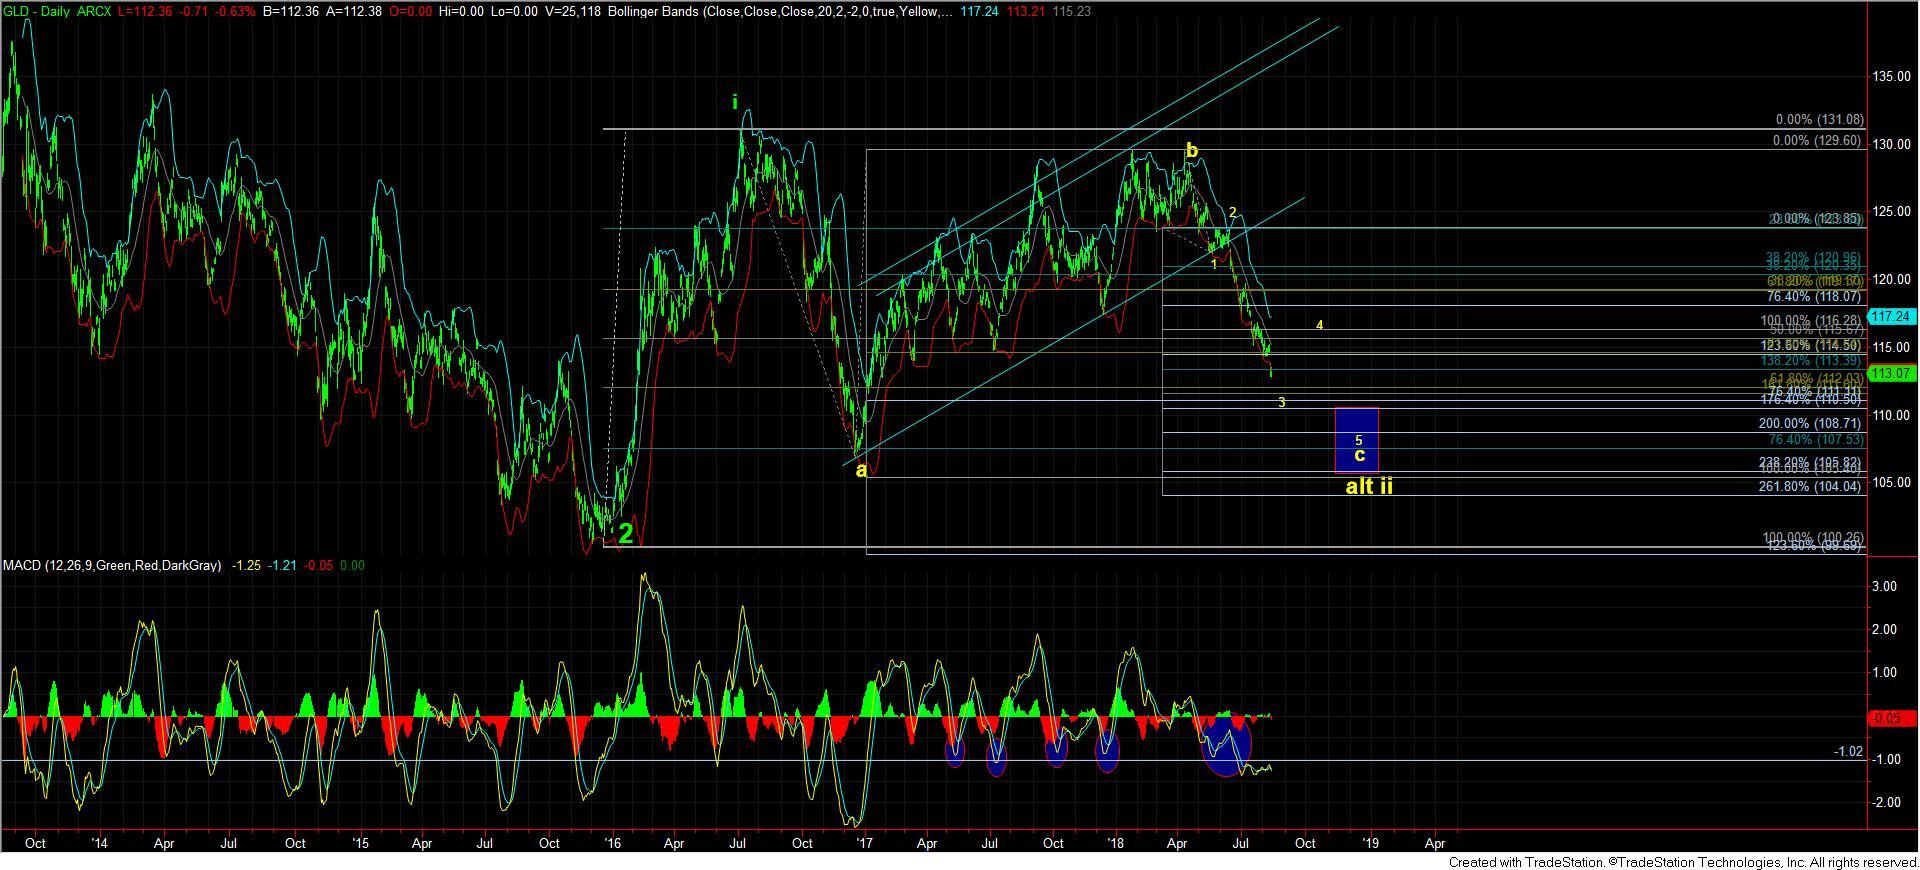
At this time, since we have broken below the 113/114GLD support, I have to give the alternative count a lot more weight. Even in that count, we should be bottoming out in wave 3, which means we will likely see a rally very soon. While we still may consider this wave 2 as presented on the standard daily chart I post, we will need to see an impulsive rally through 116.50 to confirm that. You see, the break down of the 113/114 support has opened the door to the 105-109 region, as I have mentioned many times in the past. While this has not been my primary expectation, I have to listen to what the market is saying. And, if we cannot get back over the 116.50 region in impulsive fashion in the next rally, then we will have to prepare for another drop down into the 105-109 region before this 2 year correction runs its course.
If I need to update this analysis later this evening, I will send out a further update.