Metals Still On The Edge
For those that follow my analysis for years, you would know that ever since we called the bottom to the metals market at the end of 2015 I have always given the bullish case scenario the benefit of the doubt. But, I am having a very hard time doing so at this point in time. I just do not have a reliable structure upon which I can rely for an IMMEDIATE bullish count.
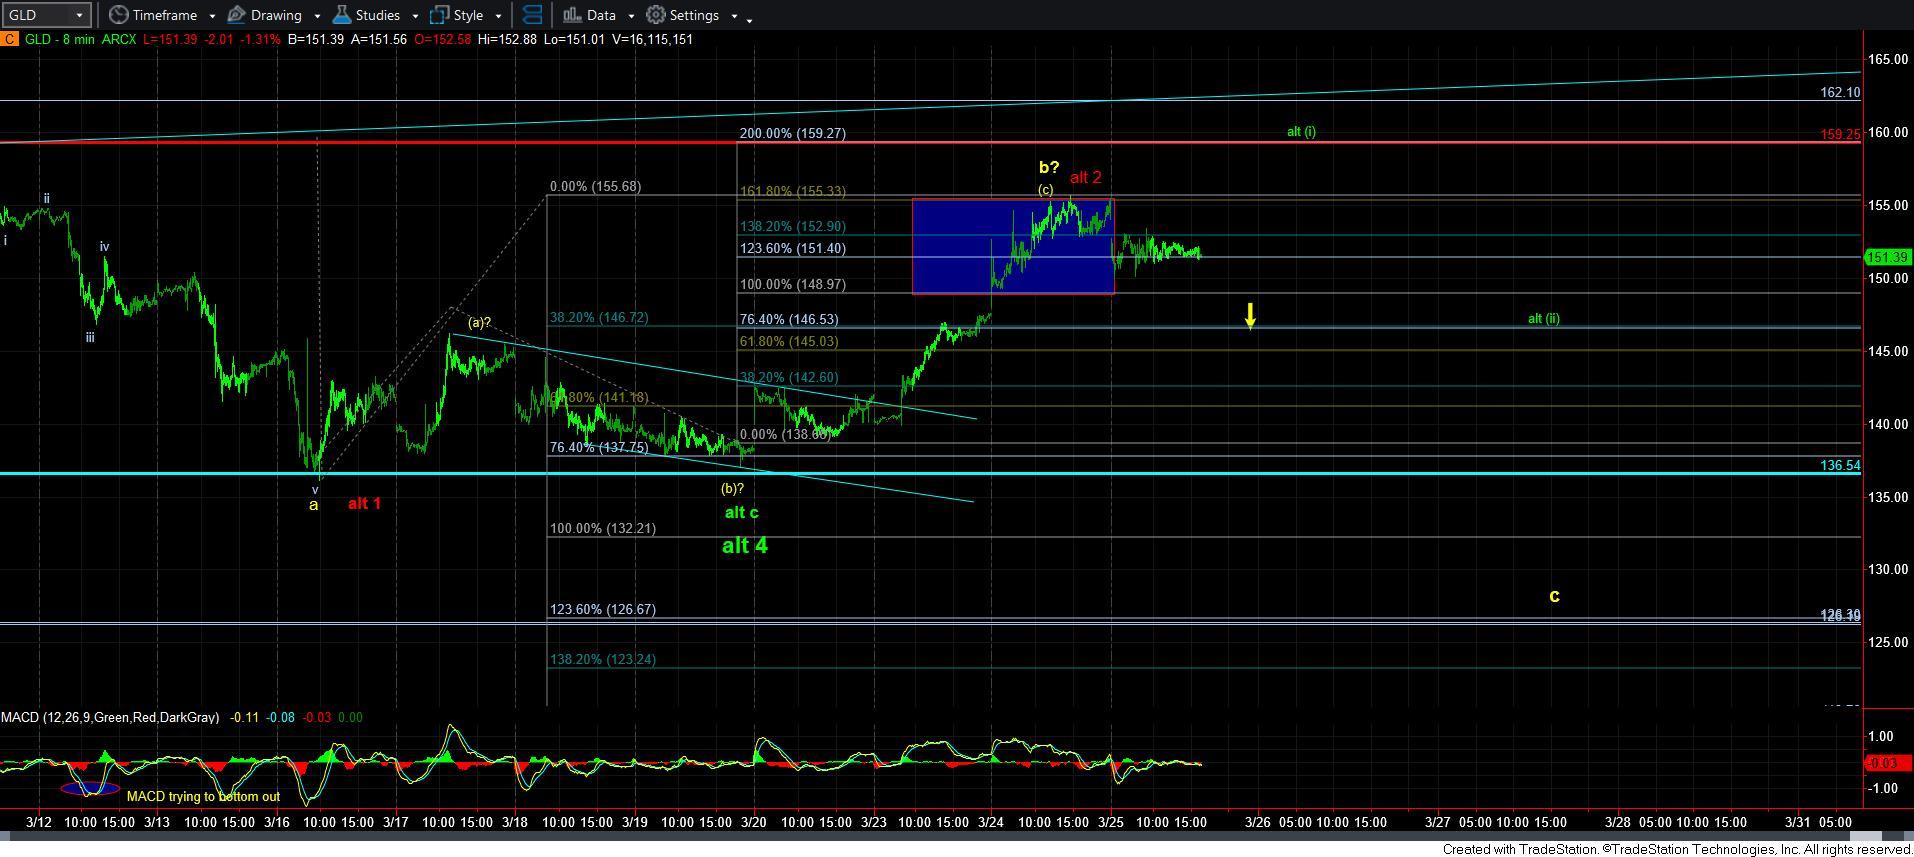
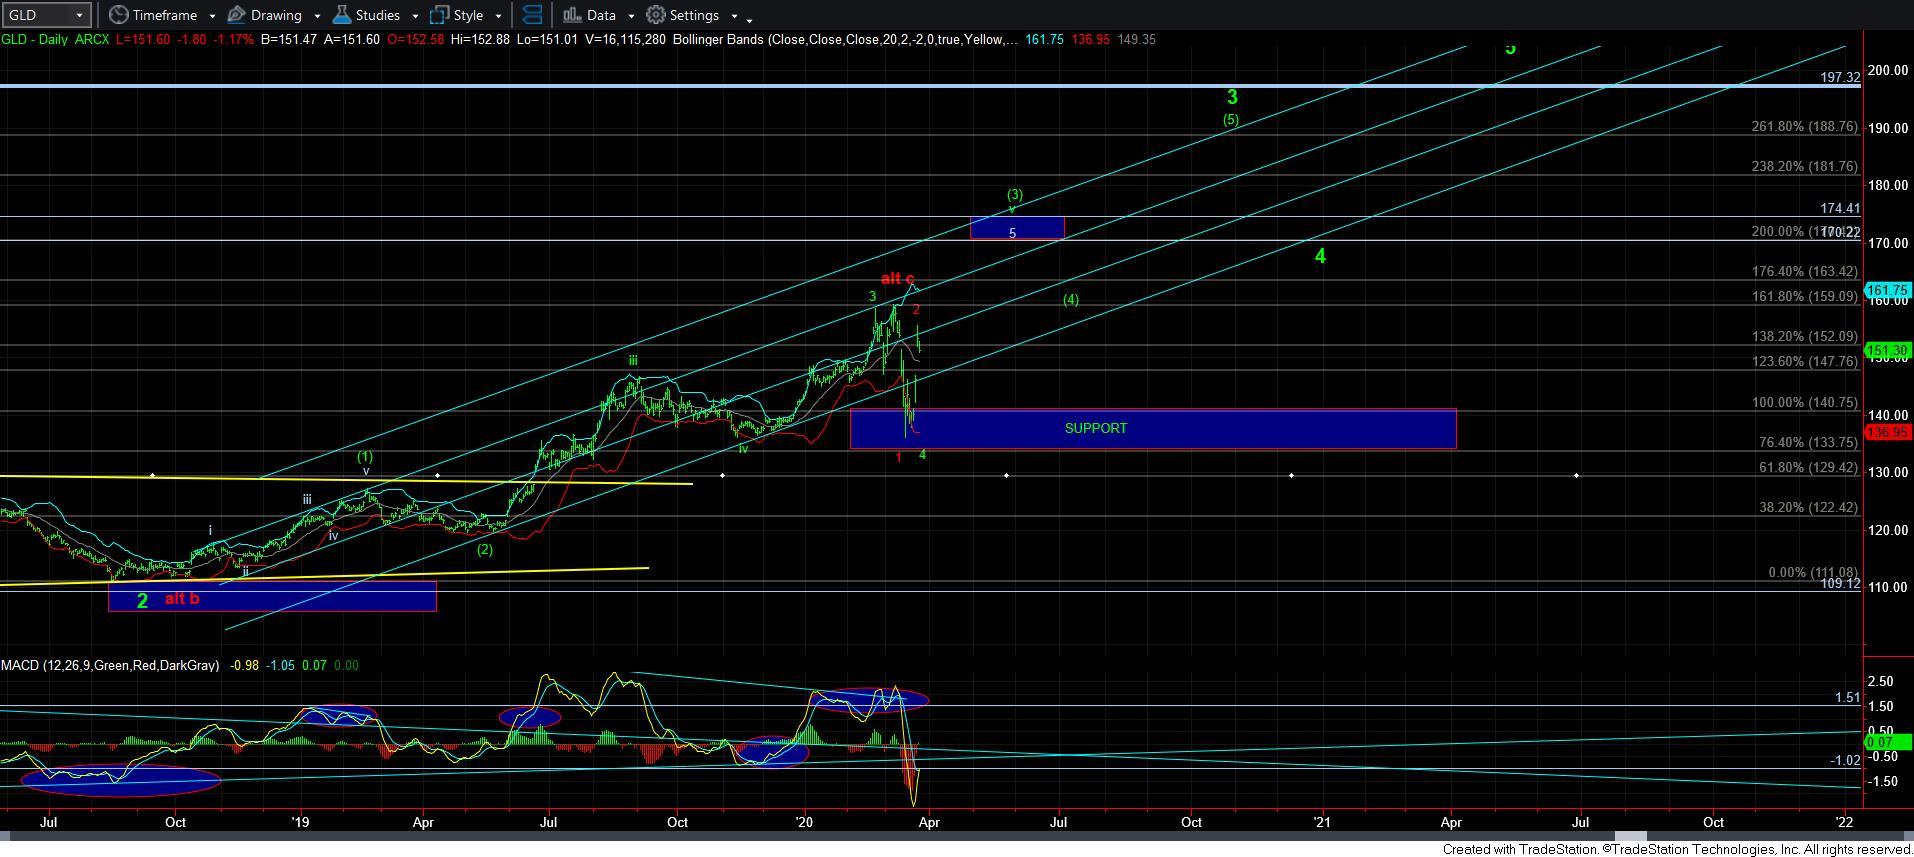
Starting with the GLD, it rallied right to the top of our resistance box, and has held it now for the last two days. And, unless it can complete a 5th wave up before breaking down below 149, I do not have an IMMEDIATE pattern upon which I can rely. And, while the very bearish red 1-2 downside structure does remain on the chart, I think the more likely scenario would be for a c-wave down into the 132 region to complete wave 4 on the daily chart, which would be the a=c region.
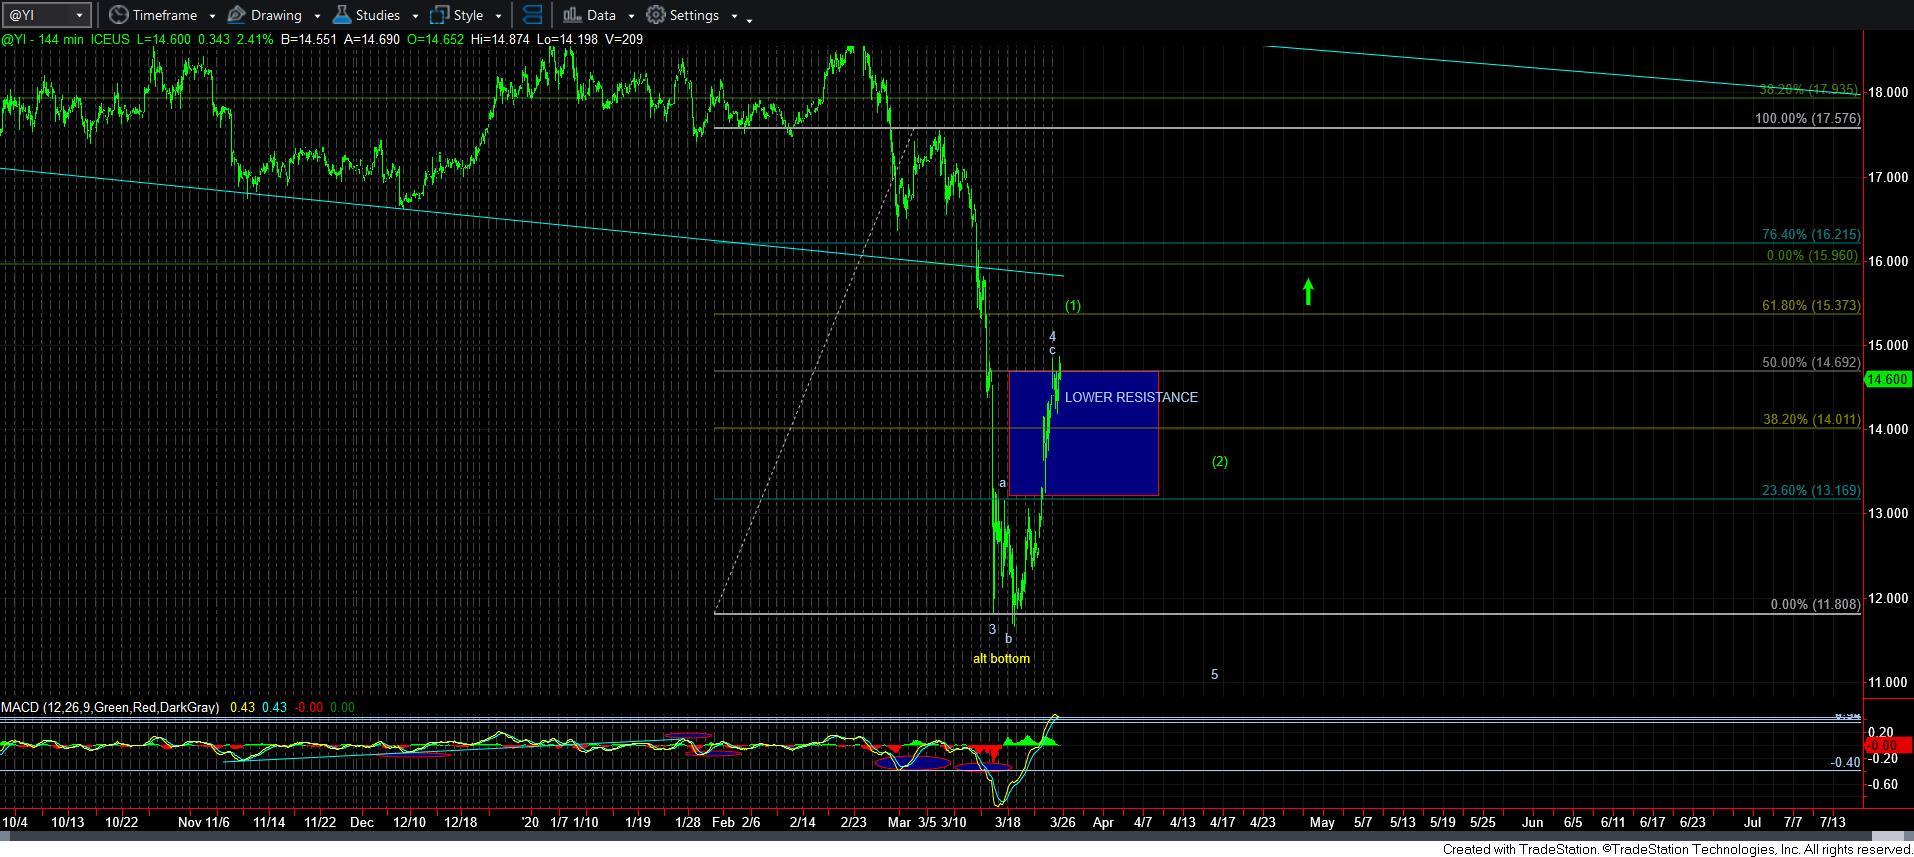
As far as silver is concerned, I am soooooo on the fence about this. It has still basically retained the resistance region for a potential wave 4, but I can just make out a 5-wave structure off the low. It is entirely possible that this 5-wave rally is still the c-wave of wave 4, with a lower low yet to come. It really did not rally high enough to make me comfortable on placing a wave [1] at the top of this rally just yet. But, to be honest, this is not a chart I would want to be shorting. Rather, I am using the GLD as my primary hedge using puts on that chart going out many months in time. If we see 5 waves up in GLD, I will adjust my positioning on the wave [ii] retrace.
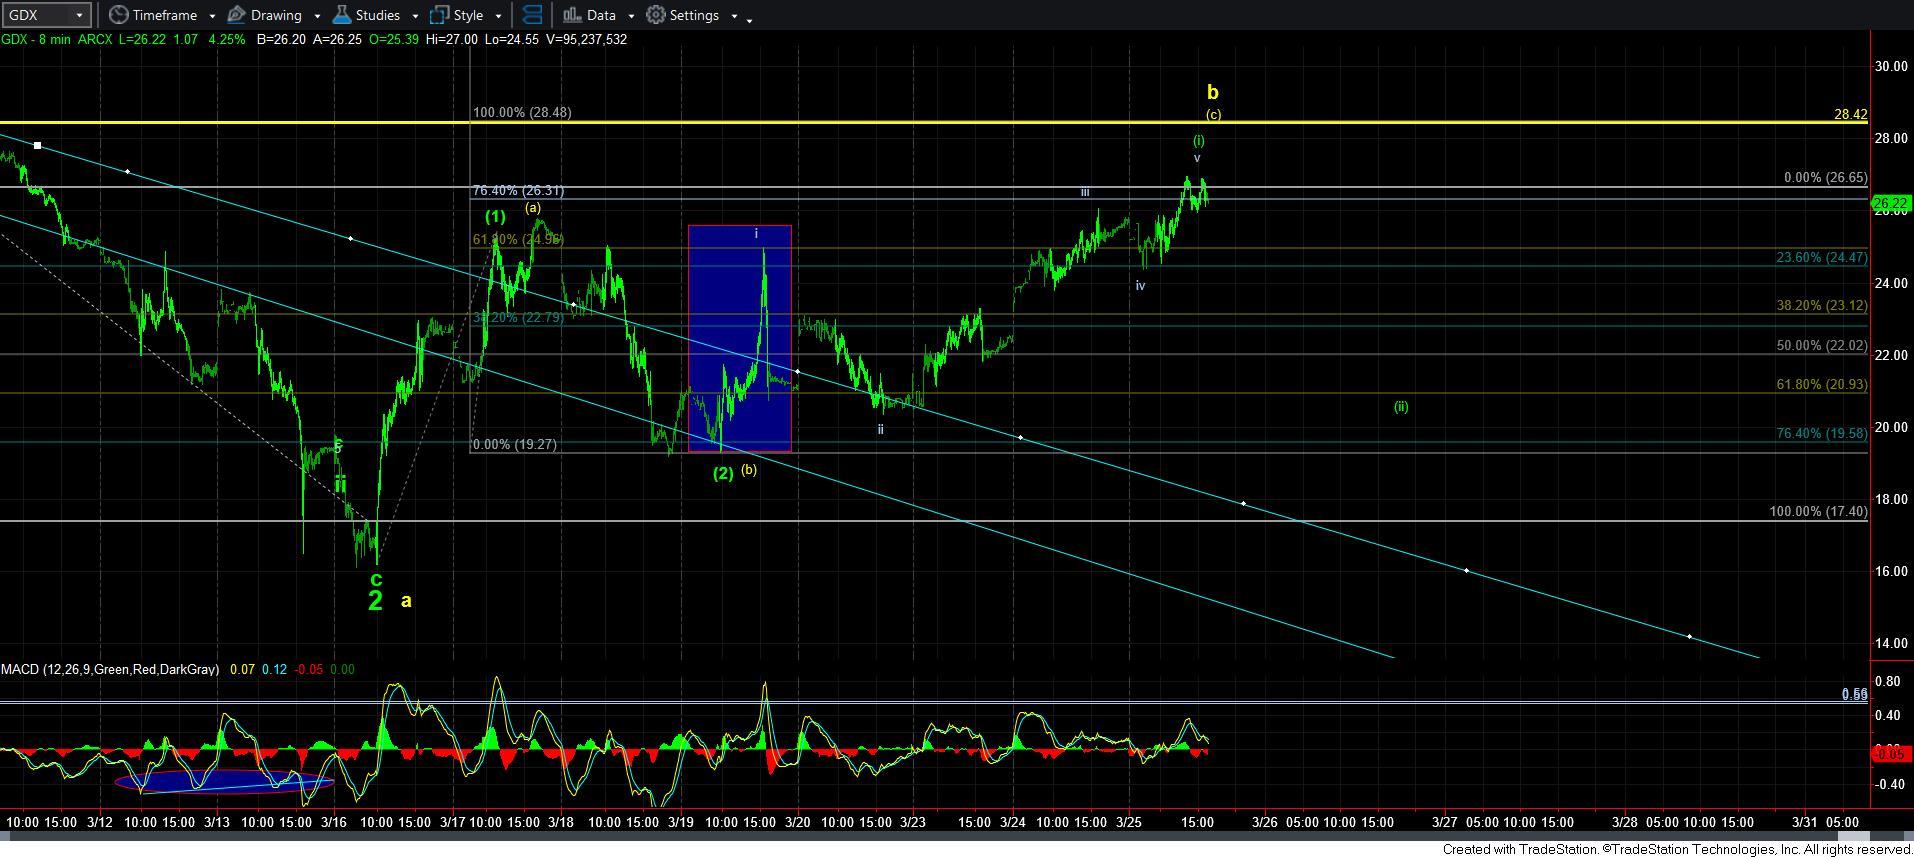
As far as GDX is concerned, as I noted again today, I have a hard time trusting this chart. Moreover, the initial move up off the potential green wave [2] looks like a rather clear 3-wave structure. So, one potential outlined as wave [i] of [3] is that we topped today and are going to see a corrective pullback in wave [ii]. That would provide us with a nice bullish break out set up if we can thereafter rally over the top of wave [i]. Yet, if the market continues higher to the 28.50 region, then we have an a-b-c structure off the recent lows, and we can drop back down to the 15-16 region one more time. It takes a strong rally over 28.50 to make me immediately bullish to levels over 40+. So, I have to say that this chart gives me the least amount of clarity.
Ultimately, as long as GLD is unable to complete 5 waves up, I am going to continue to remain cautious for another bout of weakness in the complex. Should it be able to complete 5-waves up over the next day or two before it breaks down below 149, then we have something more immediately bullish to work with.
Enjoy your evening.