Metals Have Turned Messy
For the last two weeks we have been awaiting the market to provide us with a bottoming in the metals complex followed by a 5-wave rally to signal the next rally phase. And, while many charts did seem to bottom out, we have yet to see a reliable 5-wave structure having started off those lows. So, as I wrote over the weekend, I have to remain skeptical of the rally. Moreover, the door remains open for more of a pullback to take shape.
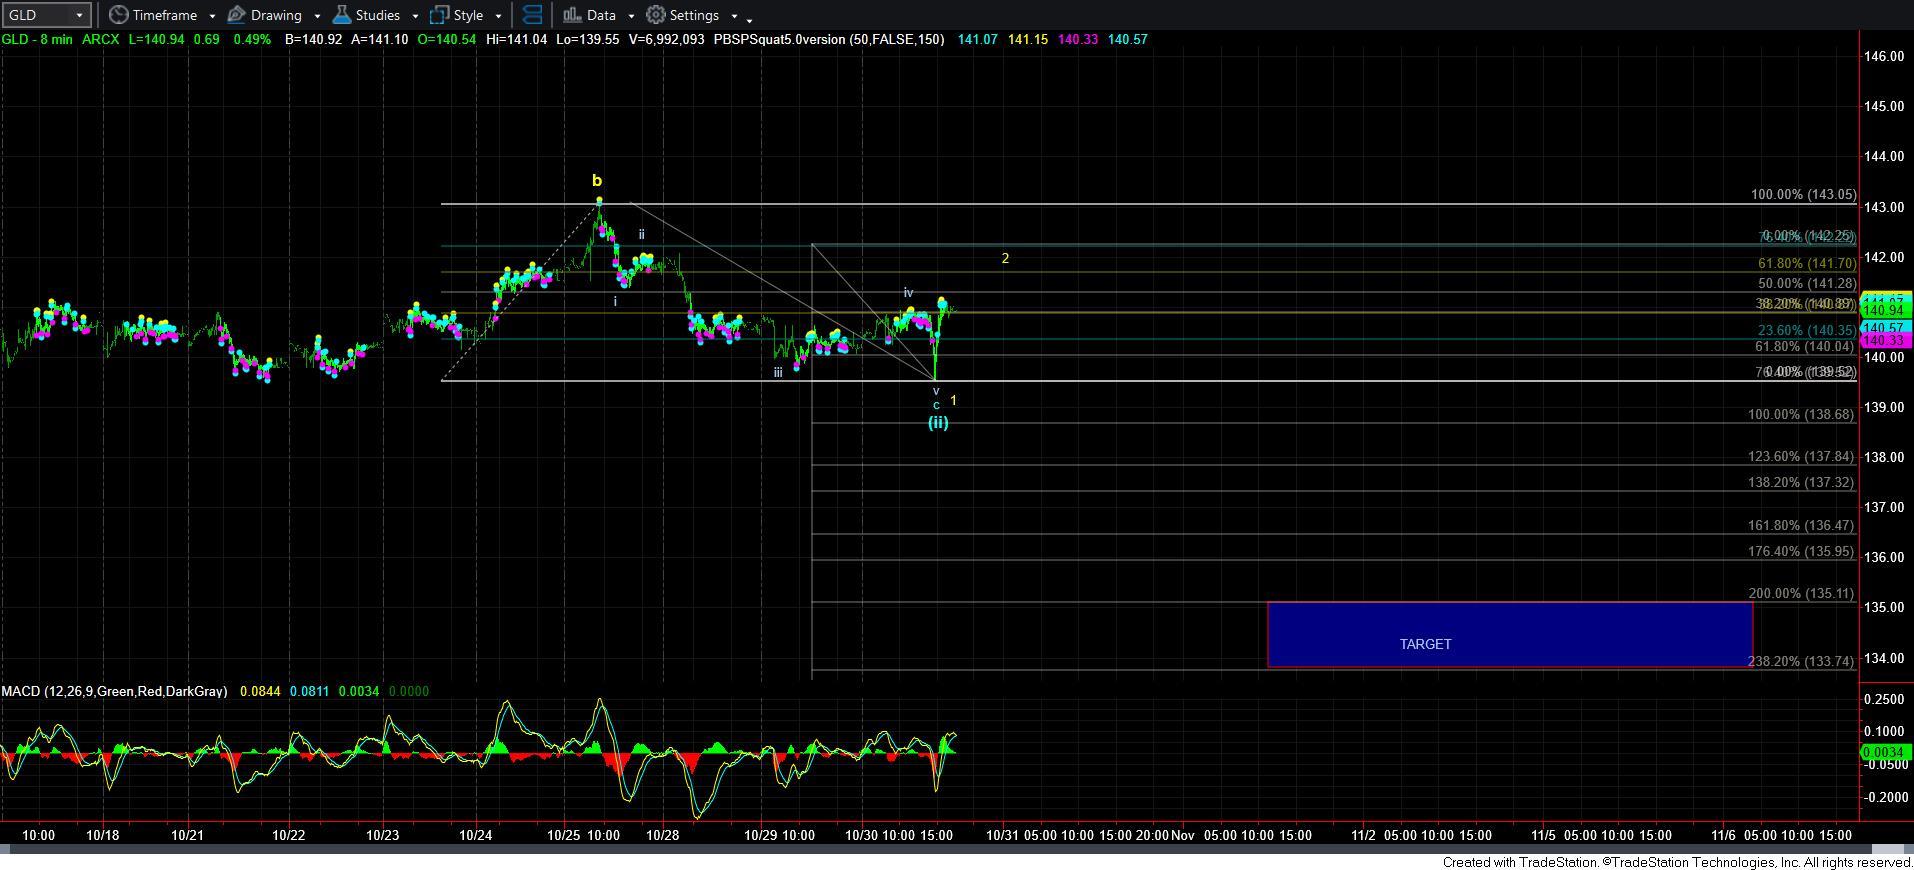
To this end, I highlighted the 8-minute GLD chart for clues as to how we will continue to progress.
At this point in time, today completed 5-waves down off last week’s high. While I have to note that the extensions seen in this decline were not ideal for a standard 5-wave Fibonacci Pinball structure (especially in the metals which often see strong extensions in their 3rd and 5th waves), it still does count as a reasonable 5-wave structure. The question is what does this 5-wave structure represent?
You see, the market has only been providing us with 3-wave structure for several weeks. And, if we were able to go up higher I could at least substantiate a leading diagonal. But, with what seems to be a 5-wave decline in GLD, that is much harder to substantiate. Moreover, there is potential that this 5-wave decline is a c-wave in a wave [ii] as shown in blue, I cannot say that I have high confidence in this potential since I really do not see this on many other charts.
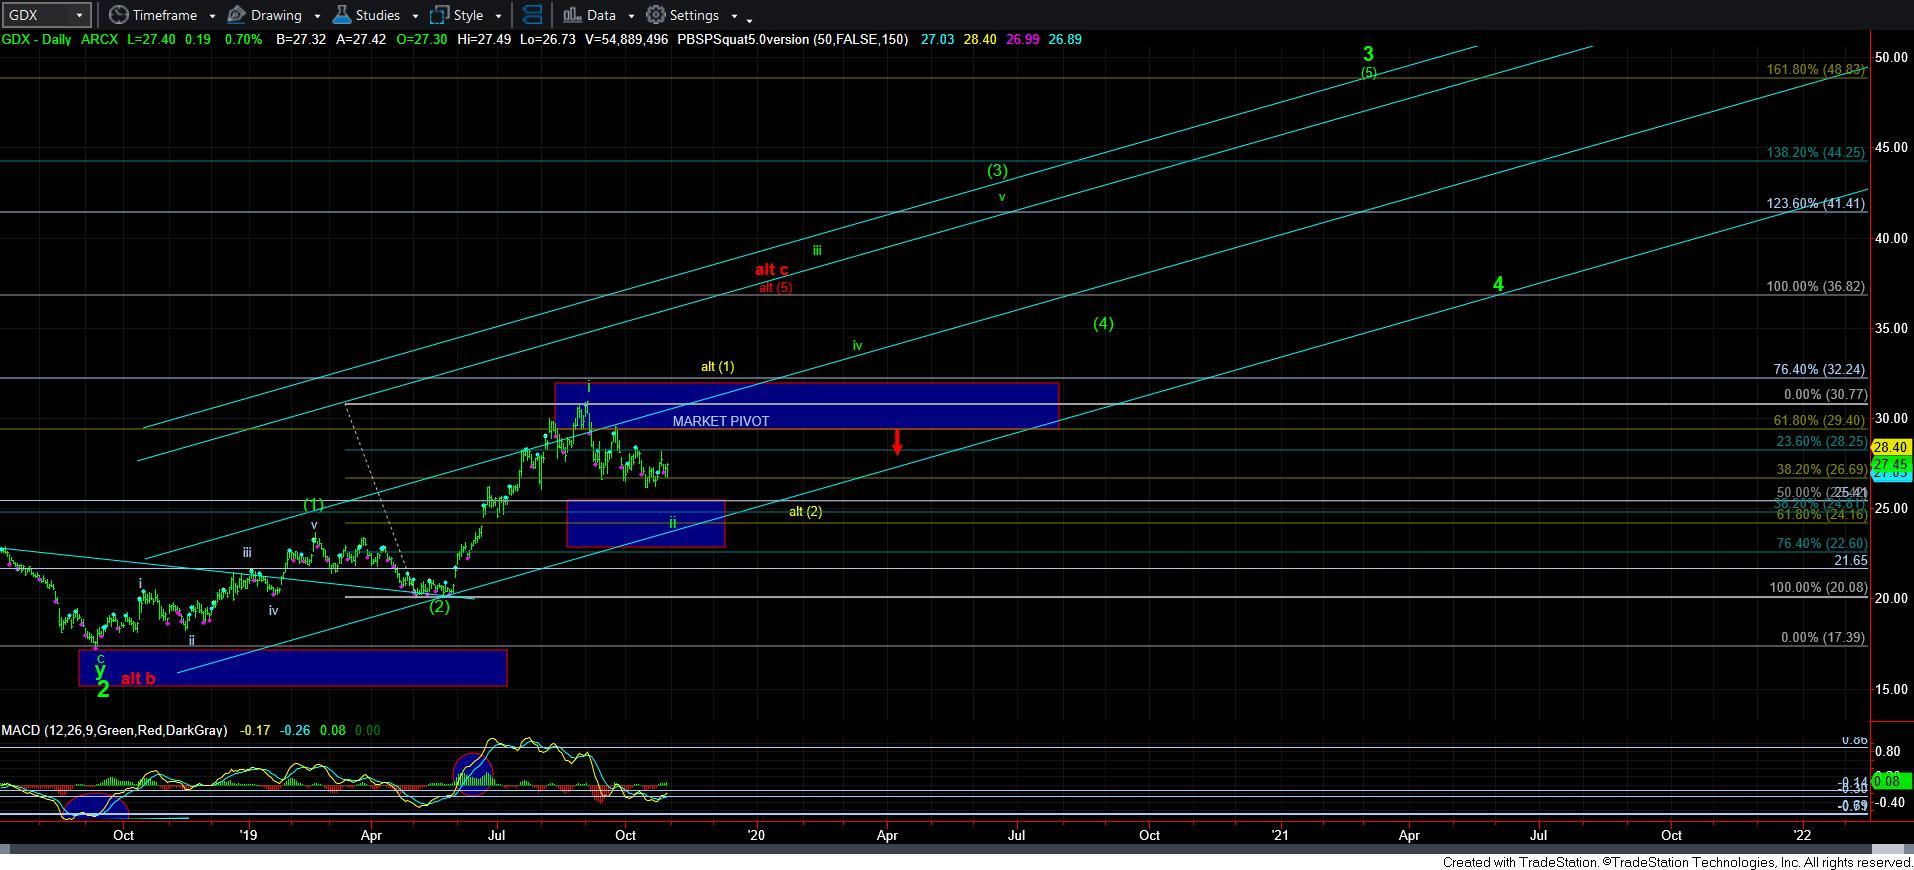
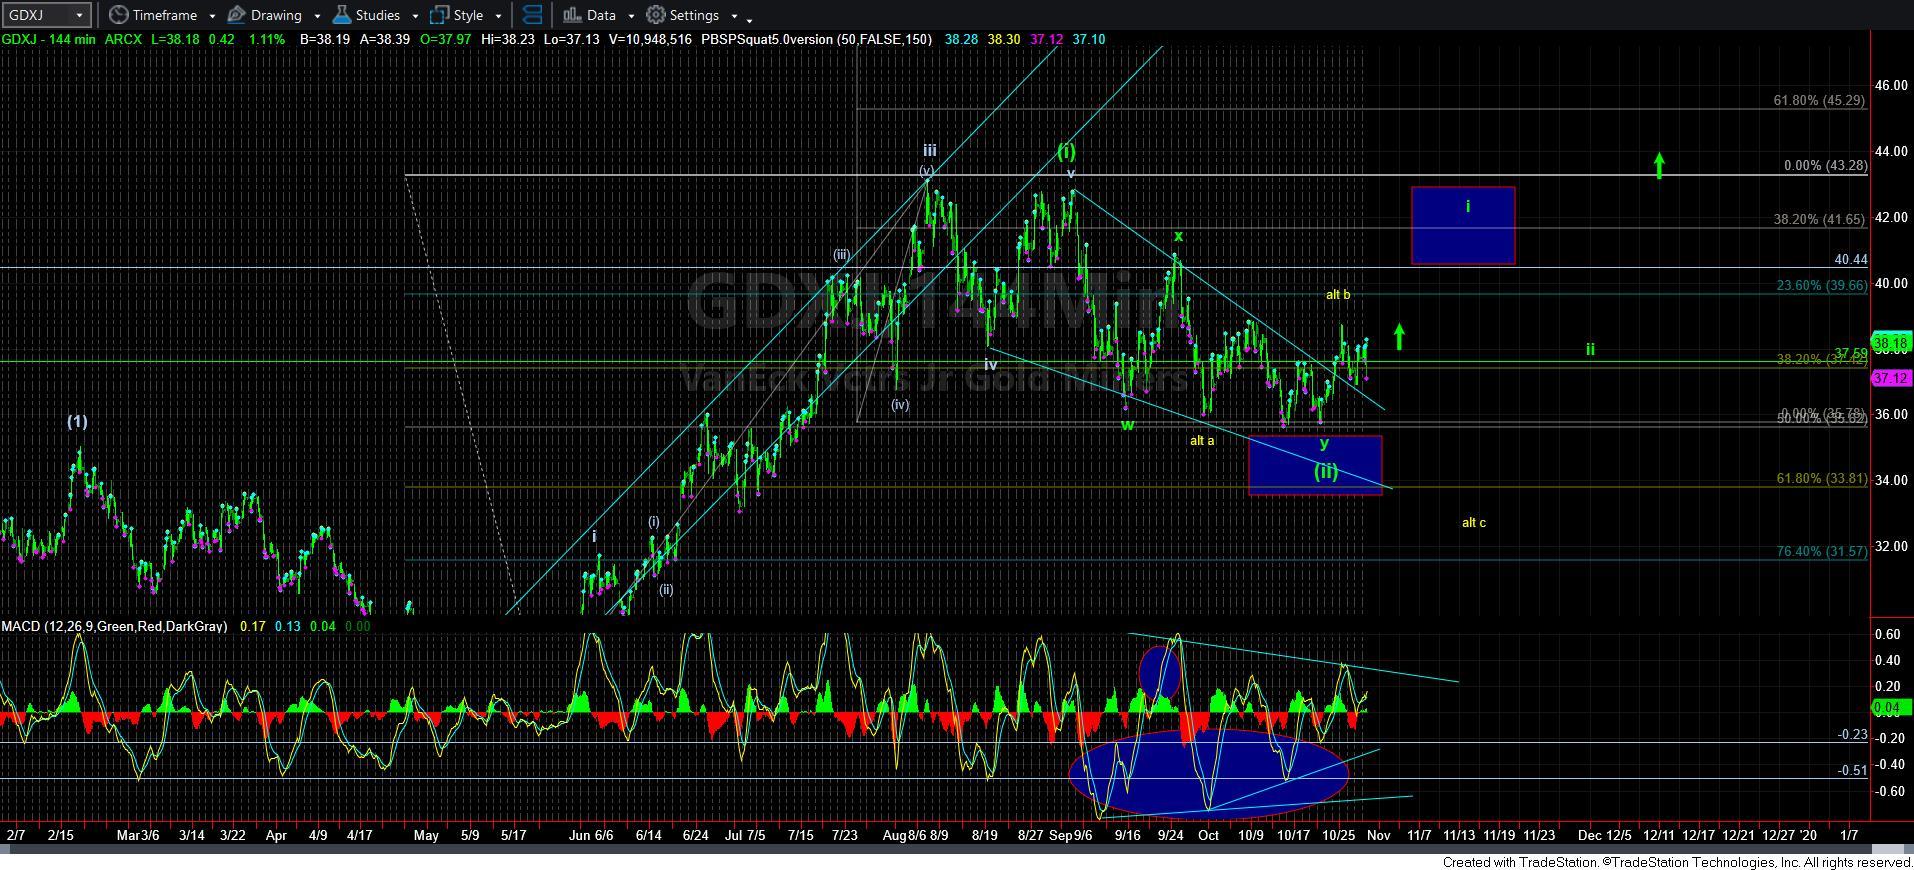
Yet, I do have to also note that this same set up is not clearly evidence in the micro structure on the GDXJ. Nor does it seem as clear in the GDX. So, it seems we have become a bit bifurcated again, which means that the metals may have more potential downside than the miners if we should see further weakness.
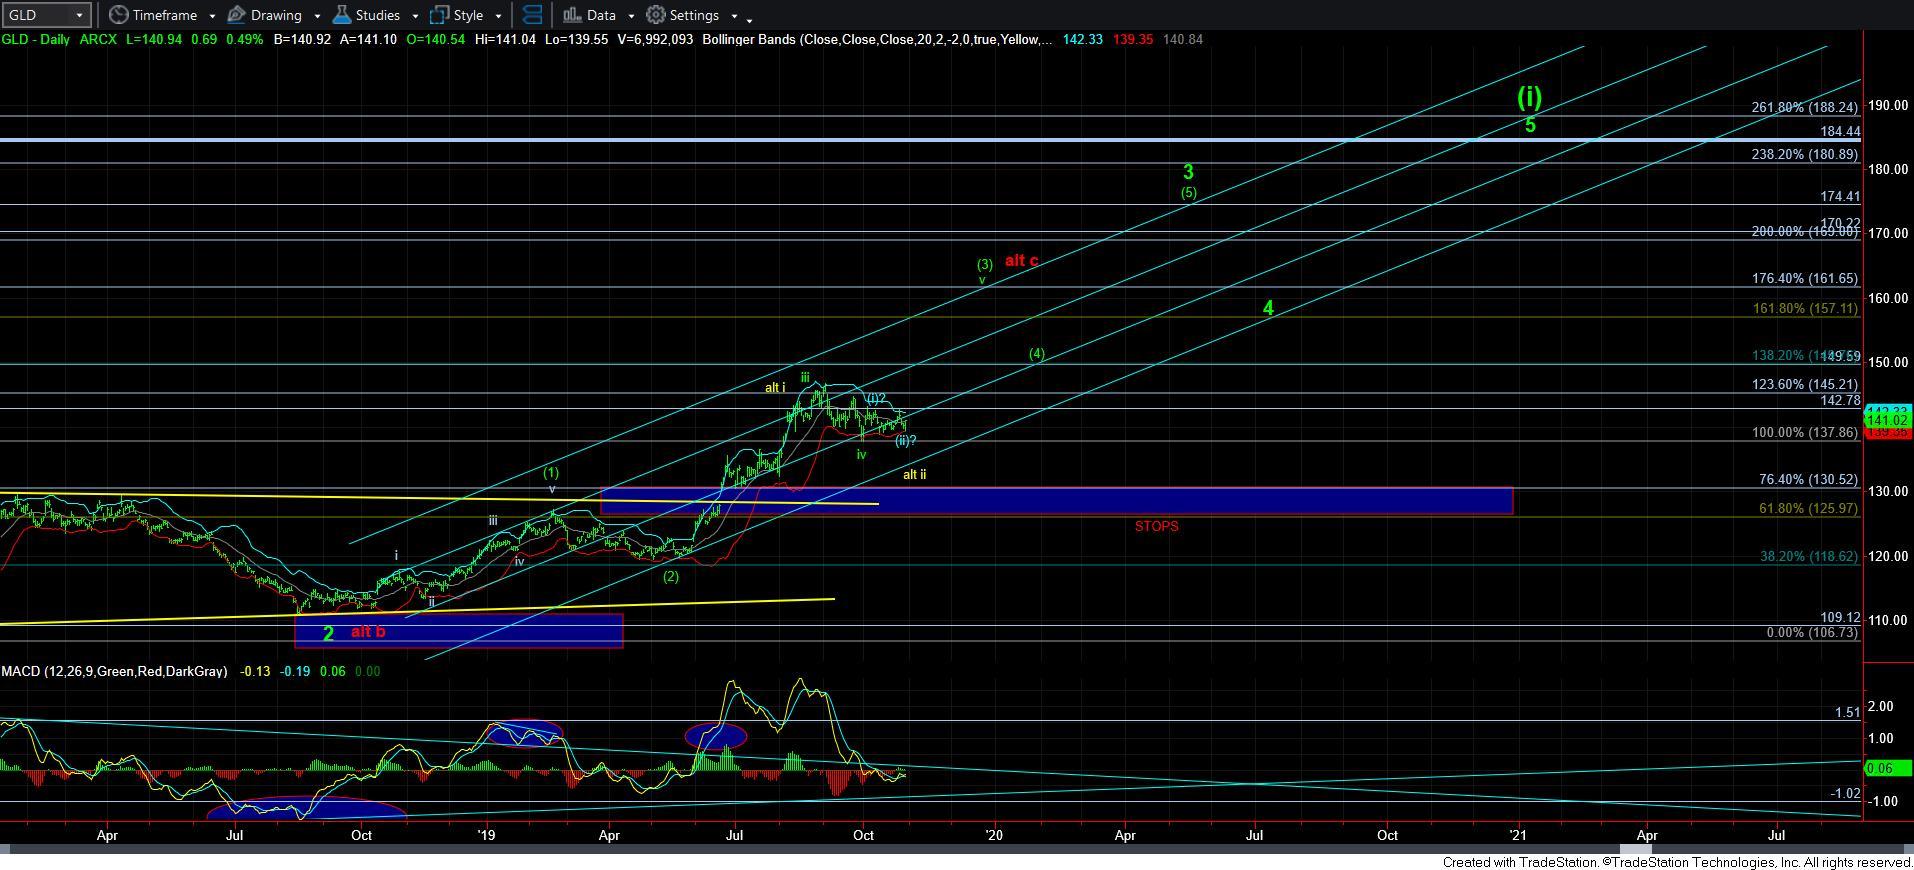
So, in specifically looking at GLD, by process of elimination, I have to assume that this was a wave 1 down in a bigger 5-wave c-wave that may be setting up over the coming days. And, as long as we remain below the high struck last week in GLD, I have to view immediate pressure as being to the downside. That means that I will likely buy protection for as long as the market remains below last week’s high in GLD. And, that c-wave can project down to the 133-135 region.
So, I will be following the 8-minute GLD chart quite closely in the coming days, and will keep you abreast of what I see. And, until such time as it is able to invalidate this downside set up for a deeper pullback, I am going to have to make this my primary expectation.
And, it would suggest that the potential for a deeper correction across the complex has risen. However, if the GLD were able to break out over the 143 region, then I would have to abandon my short term bearish bias, and begin looking higher for the next break out set up.