Metals Have One More Test
I have been taking a step back and viewing the forest more so than the leaves of late. The main reason is that I am still waiting for the market to make it clear when we have indeed begun the 3rd wave rally, with us being ultimately on our way to 55+ in this move off the recent lows.
As I have been trying to explain, we need a solid 1st and 2nd wave structure to be able to identify our targets for resistance and support on our way up to the 55+ regon over the coming year. And, the market has not been obliging in clear fashion.
But, based upon the size of the current consolidation, I think I can discuss the smaller degree structure and parameters with a bit more confidence at this time.
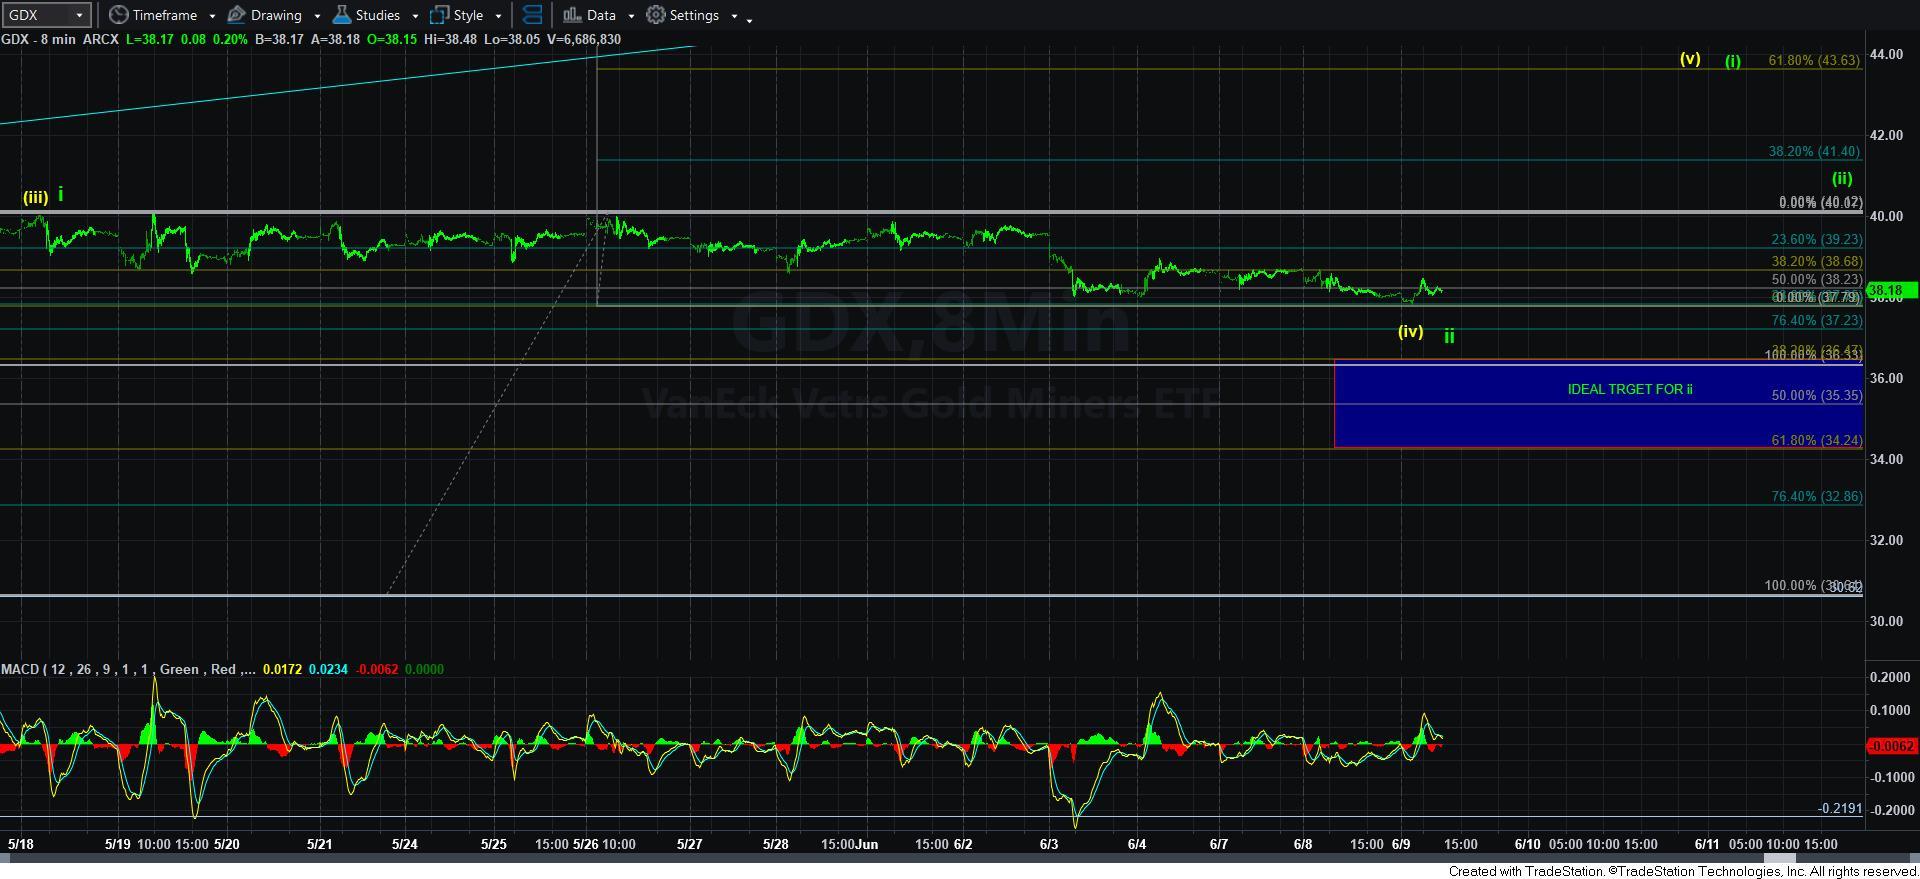
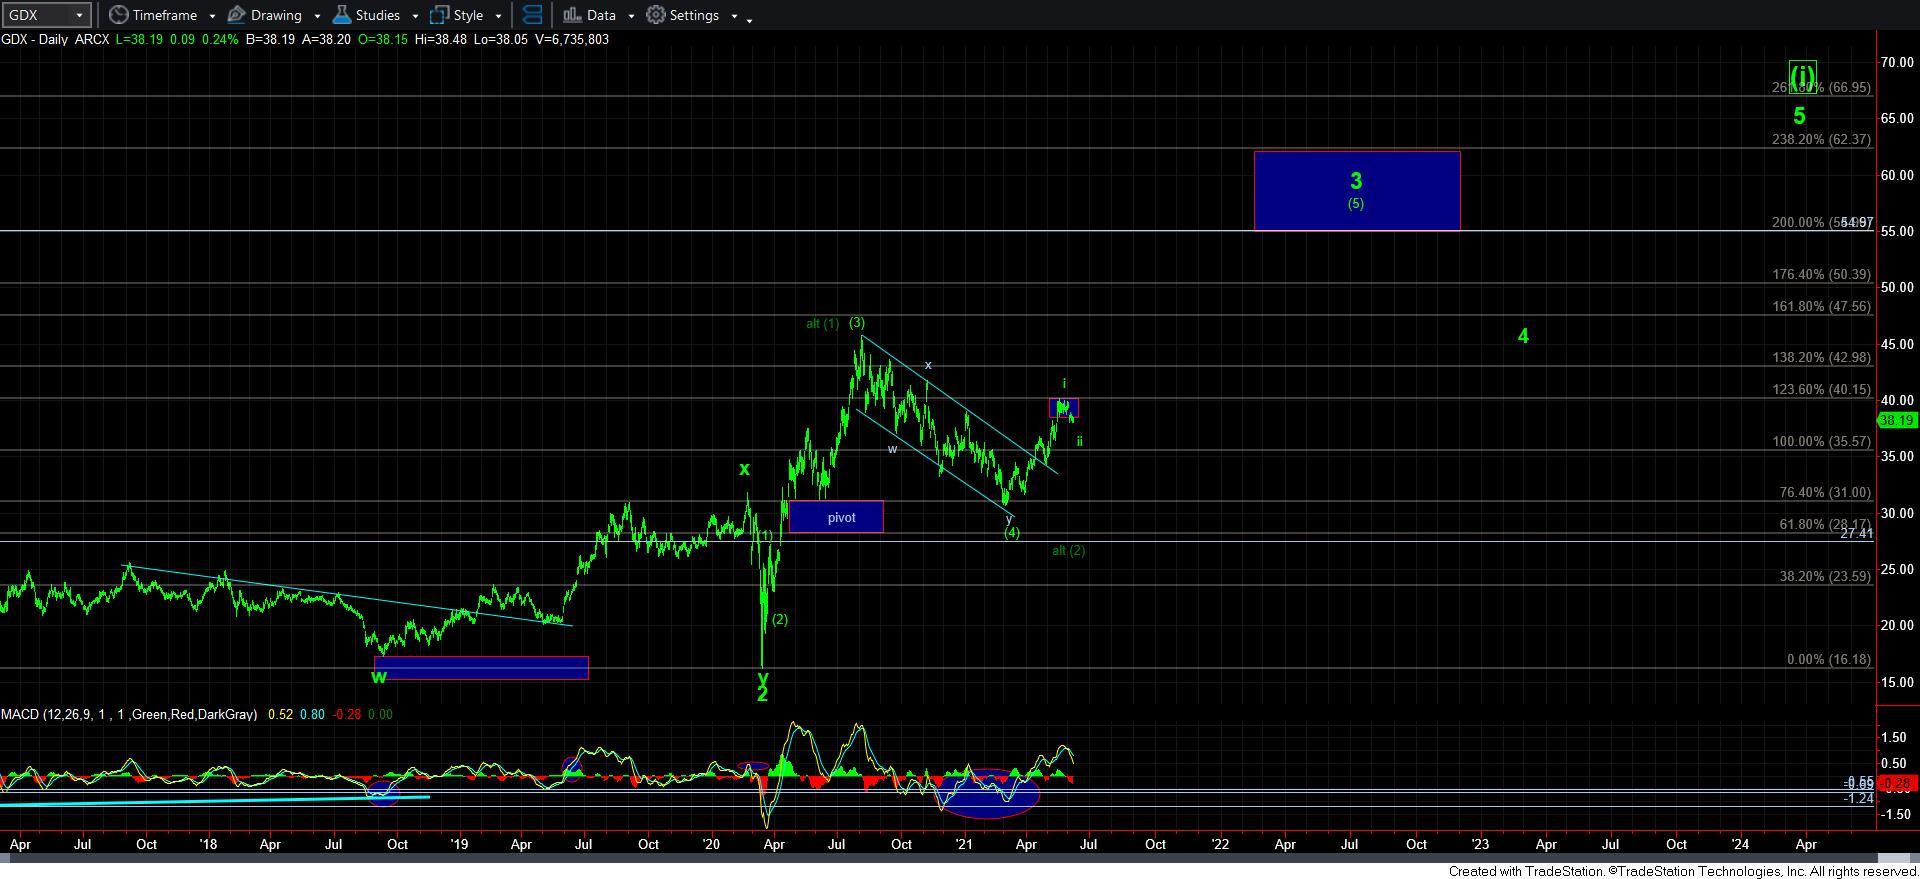
The GDX chart is the most clear when it comes to these parameters. As you can see from the 8-minute GDX chart, this pullback can best count as a wave [iv] within a larger wave i, which I have labeled as an alternative in yellow. Now, truth be told, this would really be my preference. But, as I have noted before, I will almost always side with the more immediate bullish count as the metals begin a bull market move. So, for this region the yellow count will remain an alternative and must prove itself.
Moreover, should the GDX continue to drop lower and lower and come closer to the ideal target box for wave ii I have on the chart, then it becomes more and more likely that this is indeed a solid wave i=ii structure. But, if we are unable to drop closer to that target, then I will need to allow the next rally to give me more of an indication regarding the correct count.
Allow me to explain. Another 5-wave rally will either be wave [i] of iii within the more immediate bullish count, or the wave [v] of a bigger wave i. If the market pulls back correctively after it completes that next rally, and then rallies back over the high we strike in that region, then that triggers me into a much more confident wave [iii] of iii count, and we will be looking to 50+ for wave [iii] at that point in time. But, as long as we remain below that high, and continue to pullback correctively, then the bigger i-ii will remain on my radar.
Ideally, we are simply attempting to determine where the heart of the 3rd wave takes hold in the complex, and this is what I am trying to outline.
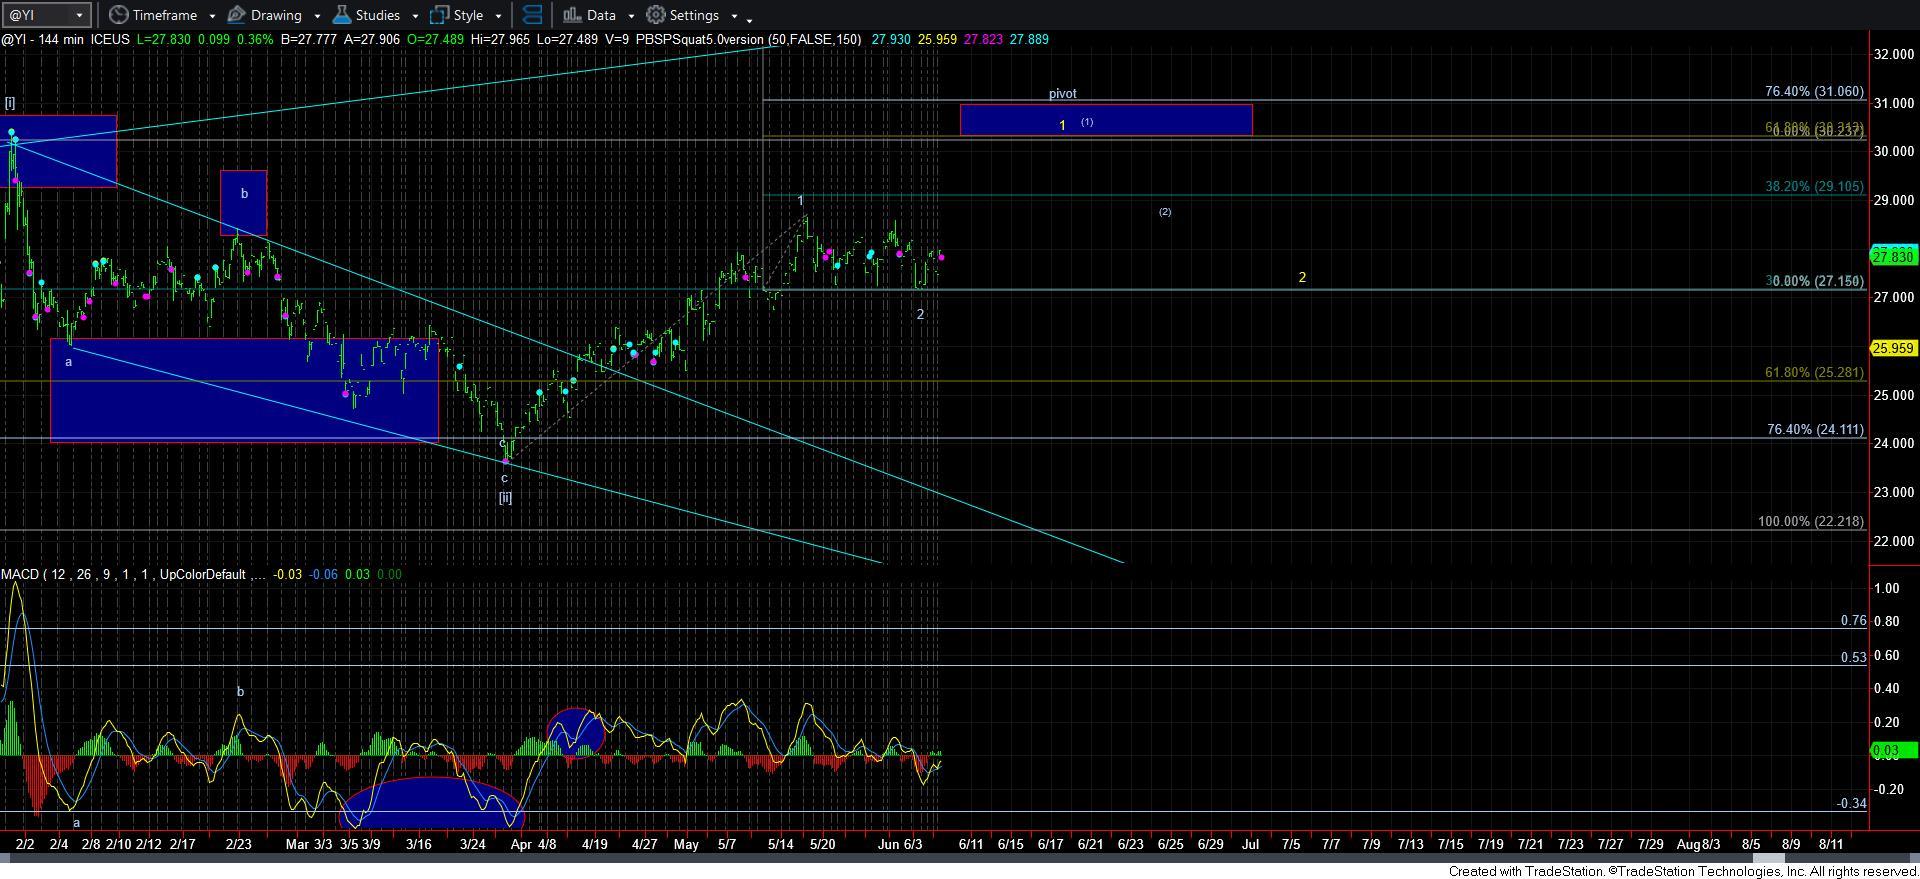
As far as silver, it is presenting similarly to the GDX, as you can see on the attached chart.
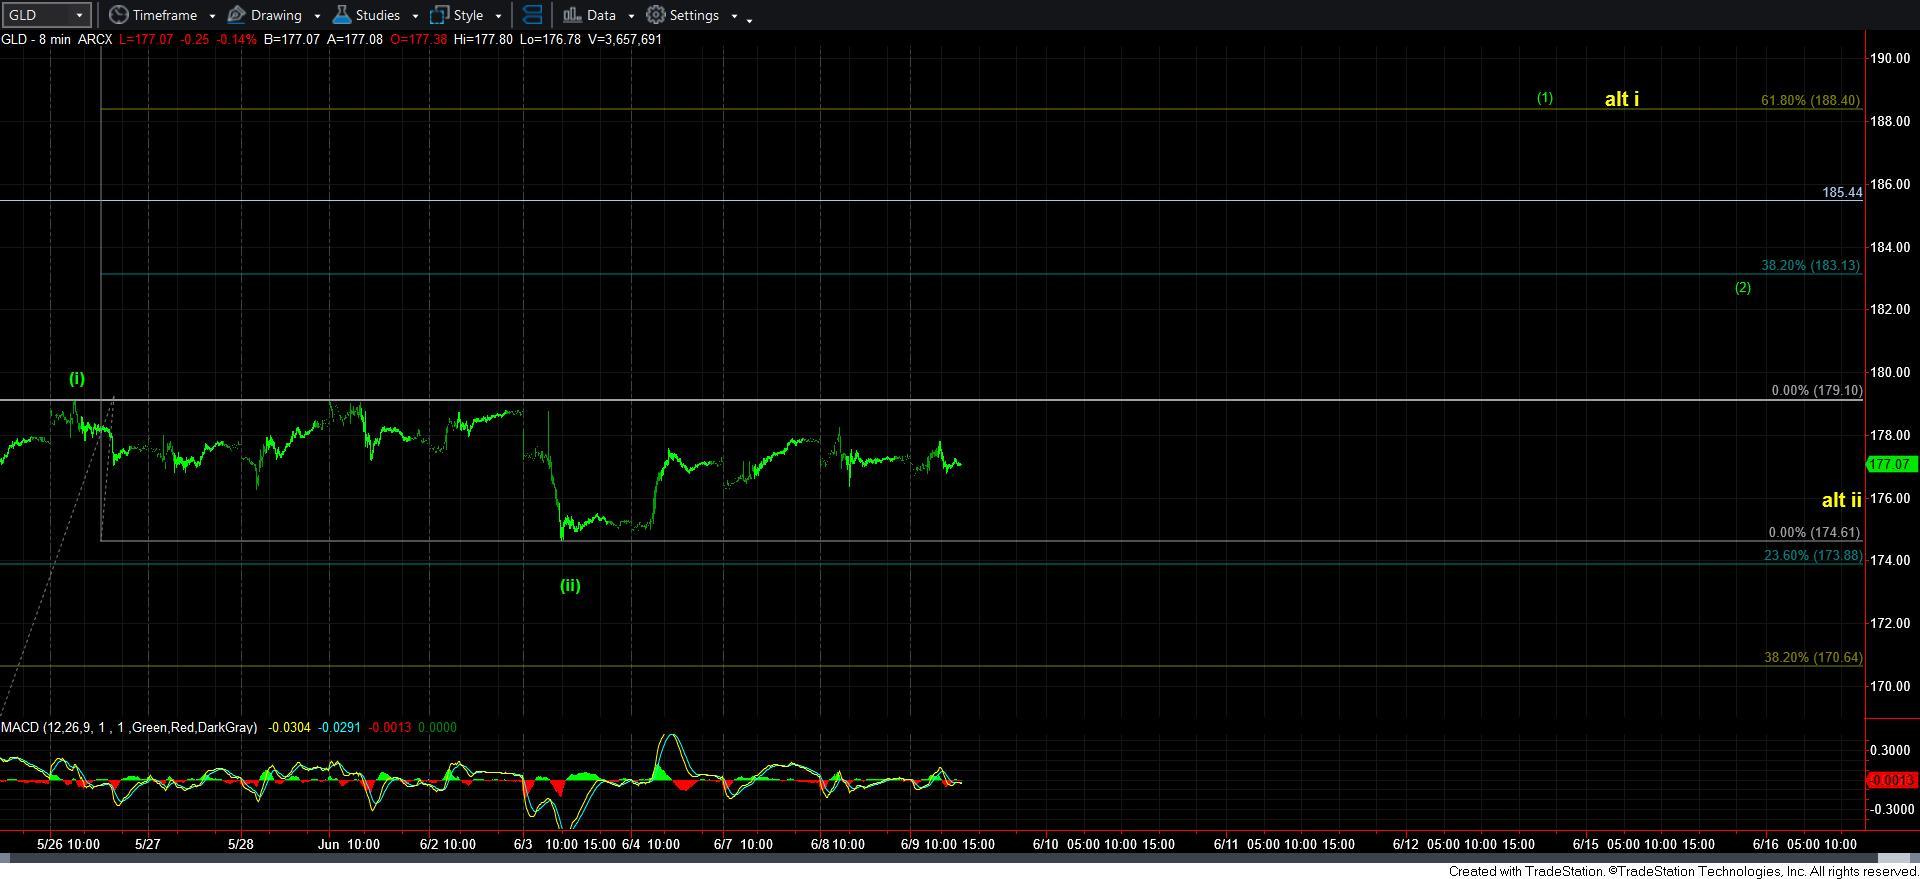
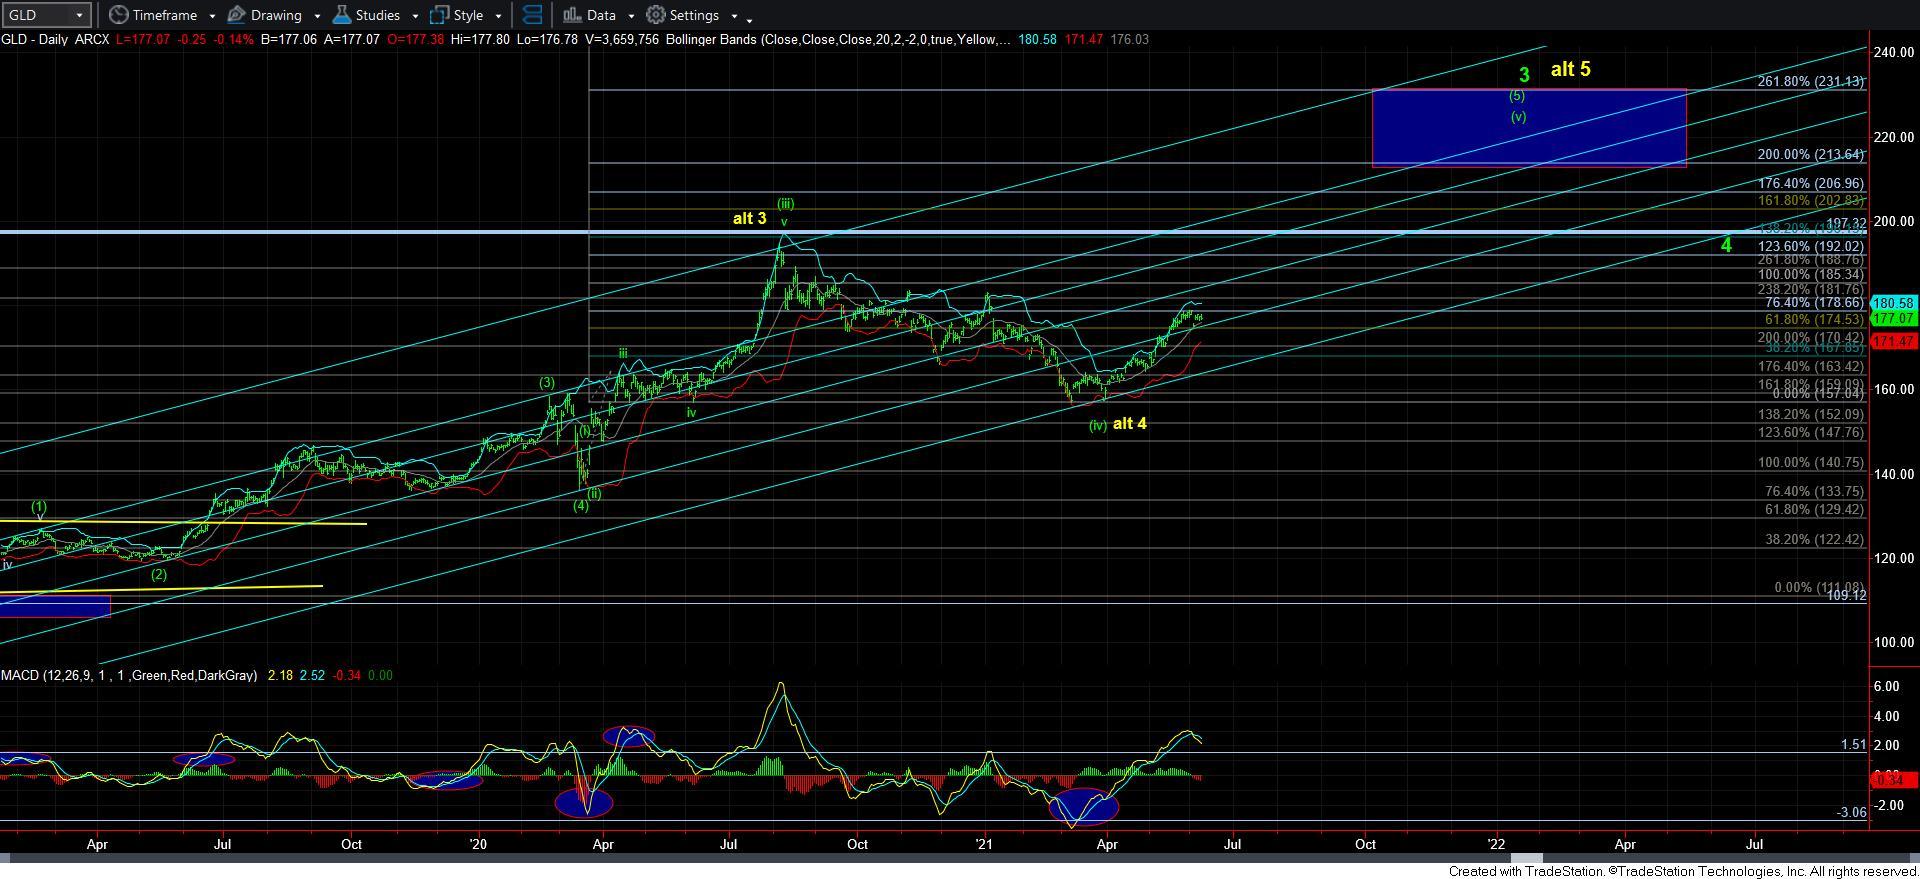
GLD counts a bit differently and can be viewed as a series of 1’s and 2’s, but the overall perspective remains the same – how the market reacts after the next 5-wave structure will be determinative as to how soon we take hold in the heart of the 3rd wave.
In summary, I am still quite bullish the overall complex. I expect a strong rally to be seen over the coming year, as I have been saying all year. The only question remains is where the heart of the 3rd wave takes hold. That is of what I am not yet sure, simply because of the lacking for an appropriately sized 2nd wave pullback.