Metals Have Just Gotten A Bit Easier
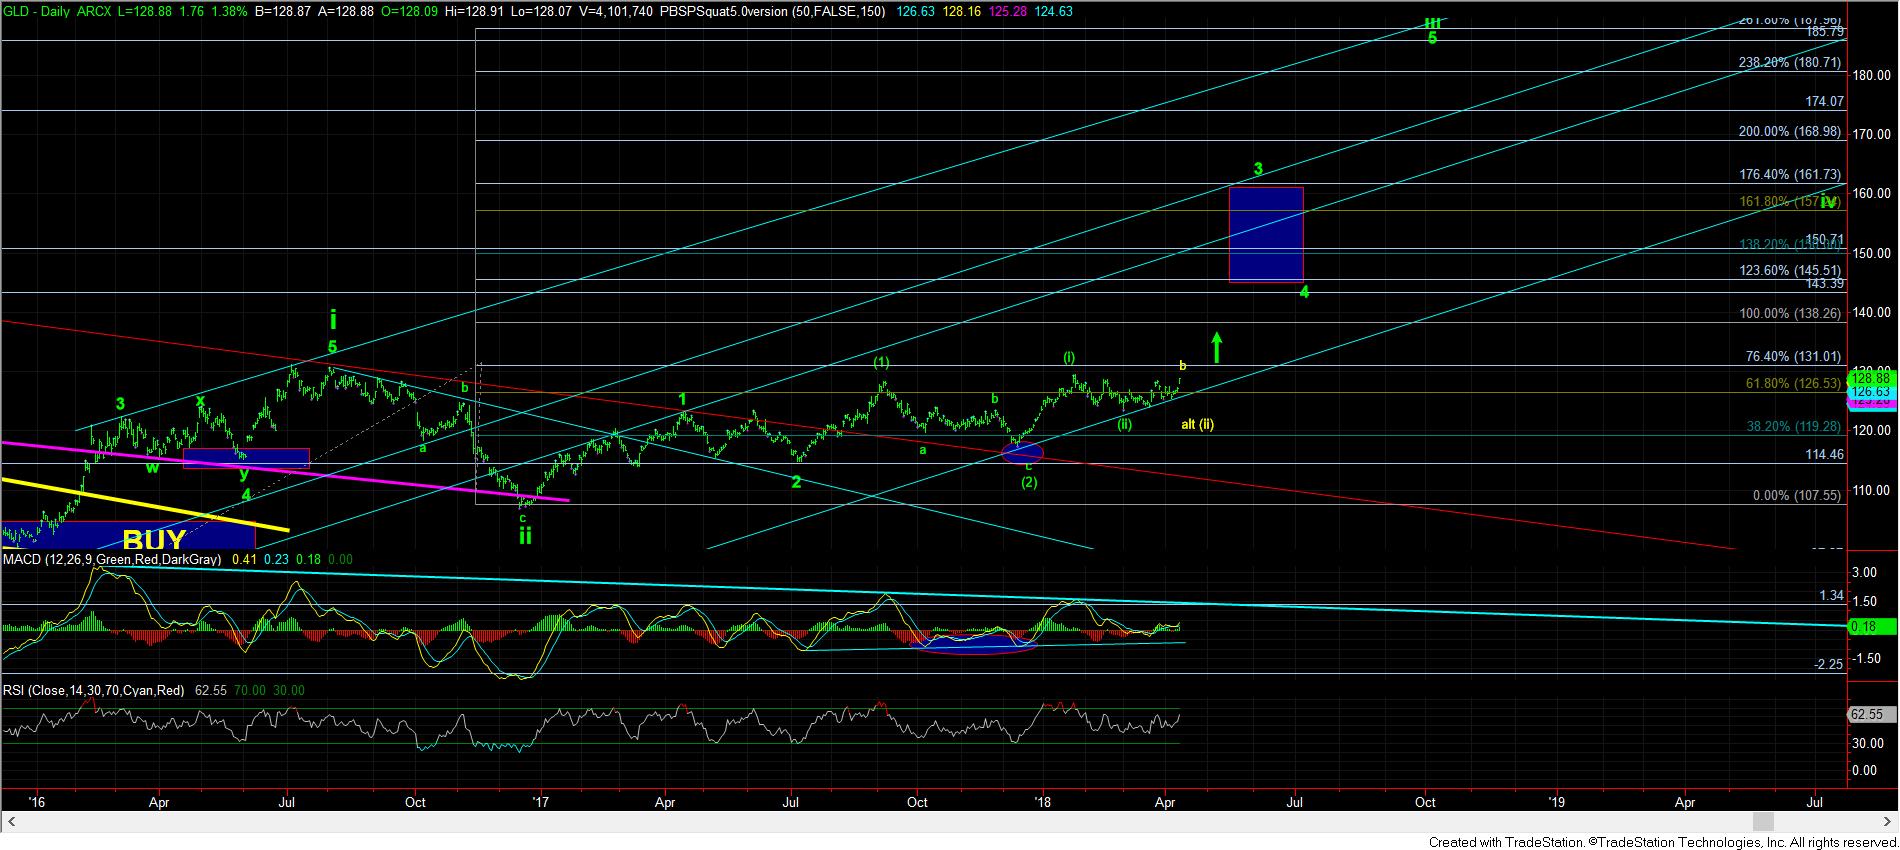
With today’s move up over last week’s high in GLD, the metals structure has gotten much easier to read as of today. The consolidation over the last week or two has been very hard to read, but today’s break has clarified much.
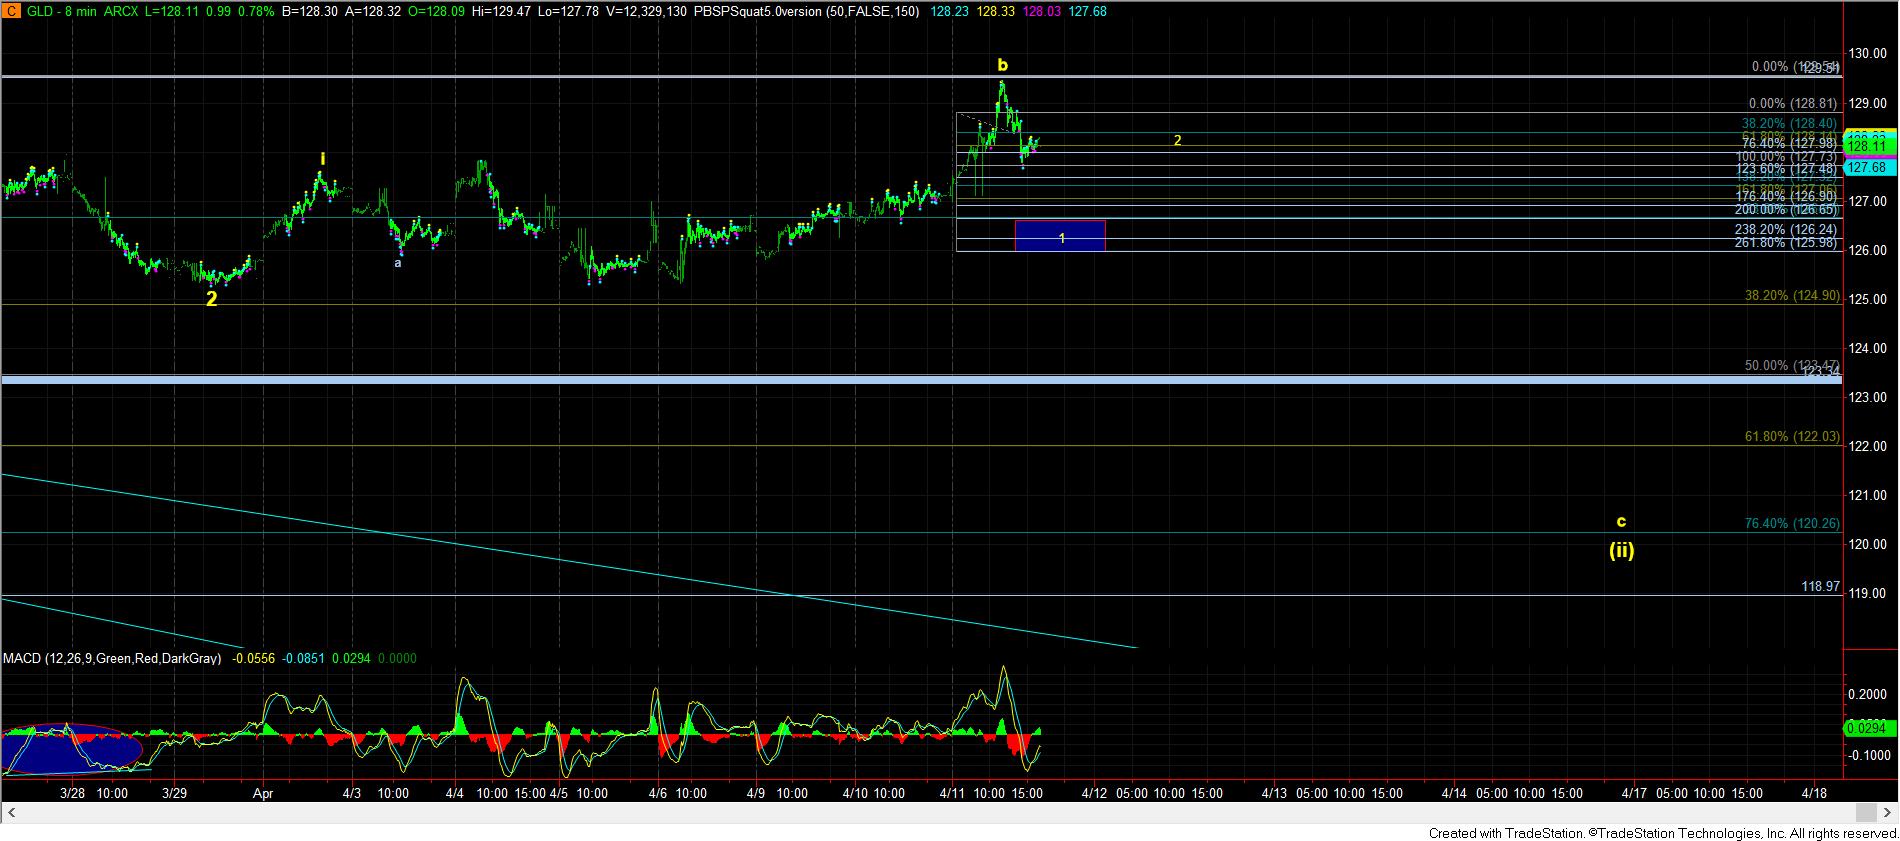
Most specifically, in the GLD, we MAY be on a break-out watch. But, I will tell you what will invalidate that break out watch, and turn it into a downside set up.
If you look at the attached 8-minute chart, I have highlighted what I would need to see for this to point us lower for a bigger wave (ii) flat. In summary, we would need some form of an impulsive 5-wave downside structure to suggest we are about to drop in a c-wave of wave (ii). Anything less than that can have us on “break-out” watch.
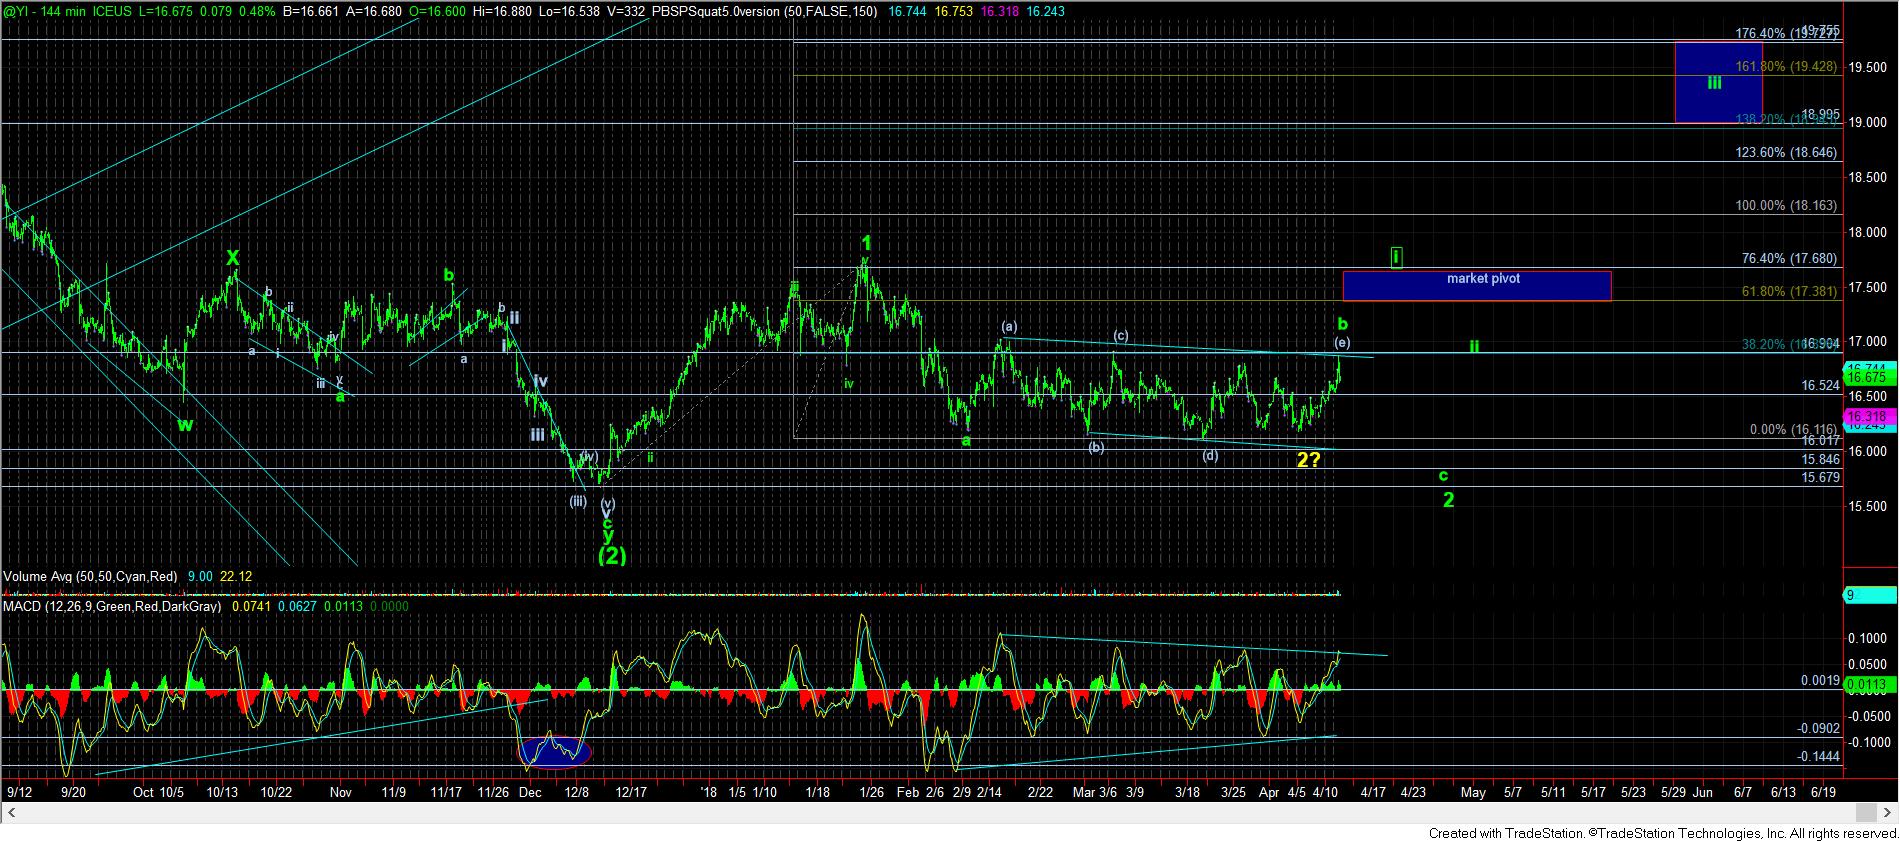
Moreover, silver can also be a strong clue. Today, we stopped right at the resistance I have been noting for several weeks – 16.90. If we can muster a more impulsive 5 wave structure through that resistance, we can begin to set up for a powerful move higher. However, the inability of the market to be able to complete a 5 wave structure for wave I of 3 towards the market pivot would suggest that we can still see that c-wave down to complete wave 2. Again, this pretty much aligns with the GLD scenario.
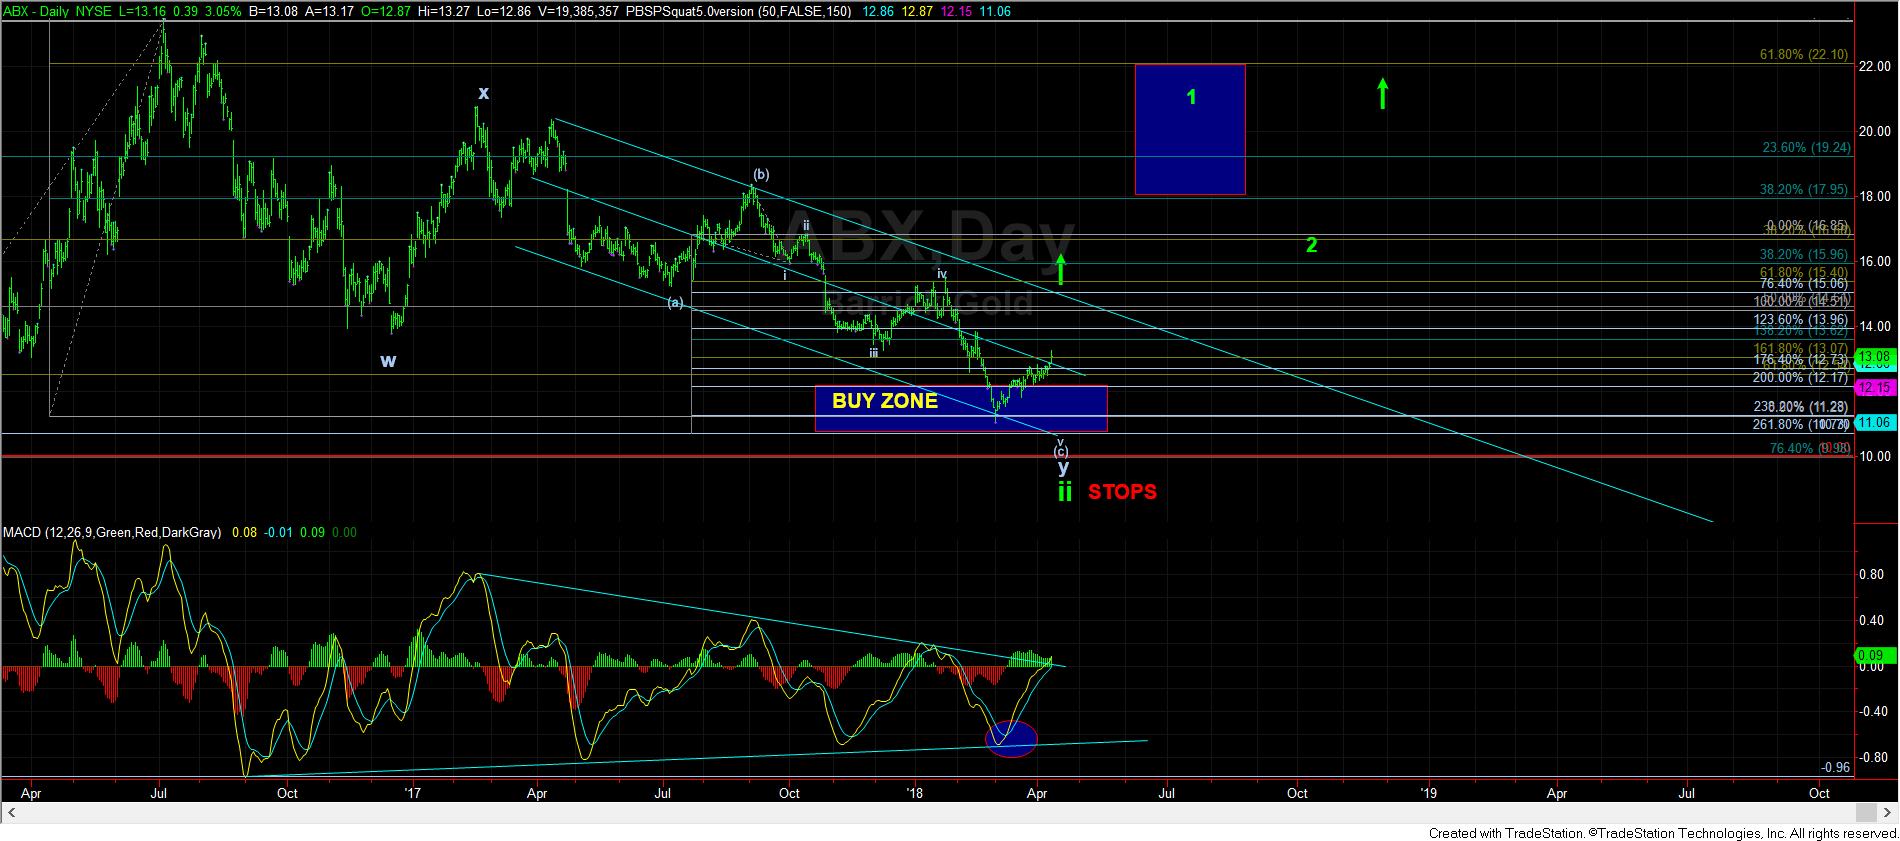
As far as the miners are concerned, well, allow me to reprint what I wrote today about ABX:
I would LOVE if the ABX would simply continue in a melt up here, but the micro pattern off the low is overlapping and unclear. So, I will have to abide by the daily chart until we see a first downside reaction. The daily chart is seeing price move through the middle trend line, and the MACD is certainly pressing on its longer term downtrend channel. Very interesting point indeed. It will really need a MAJOR price surge to continue this higher, or else we run the risk of a roll over again, just like GLD may be suggesting. But, this is a clear point of inflection across the complex.
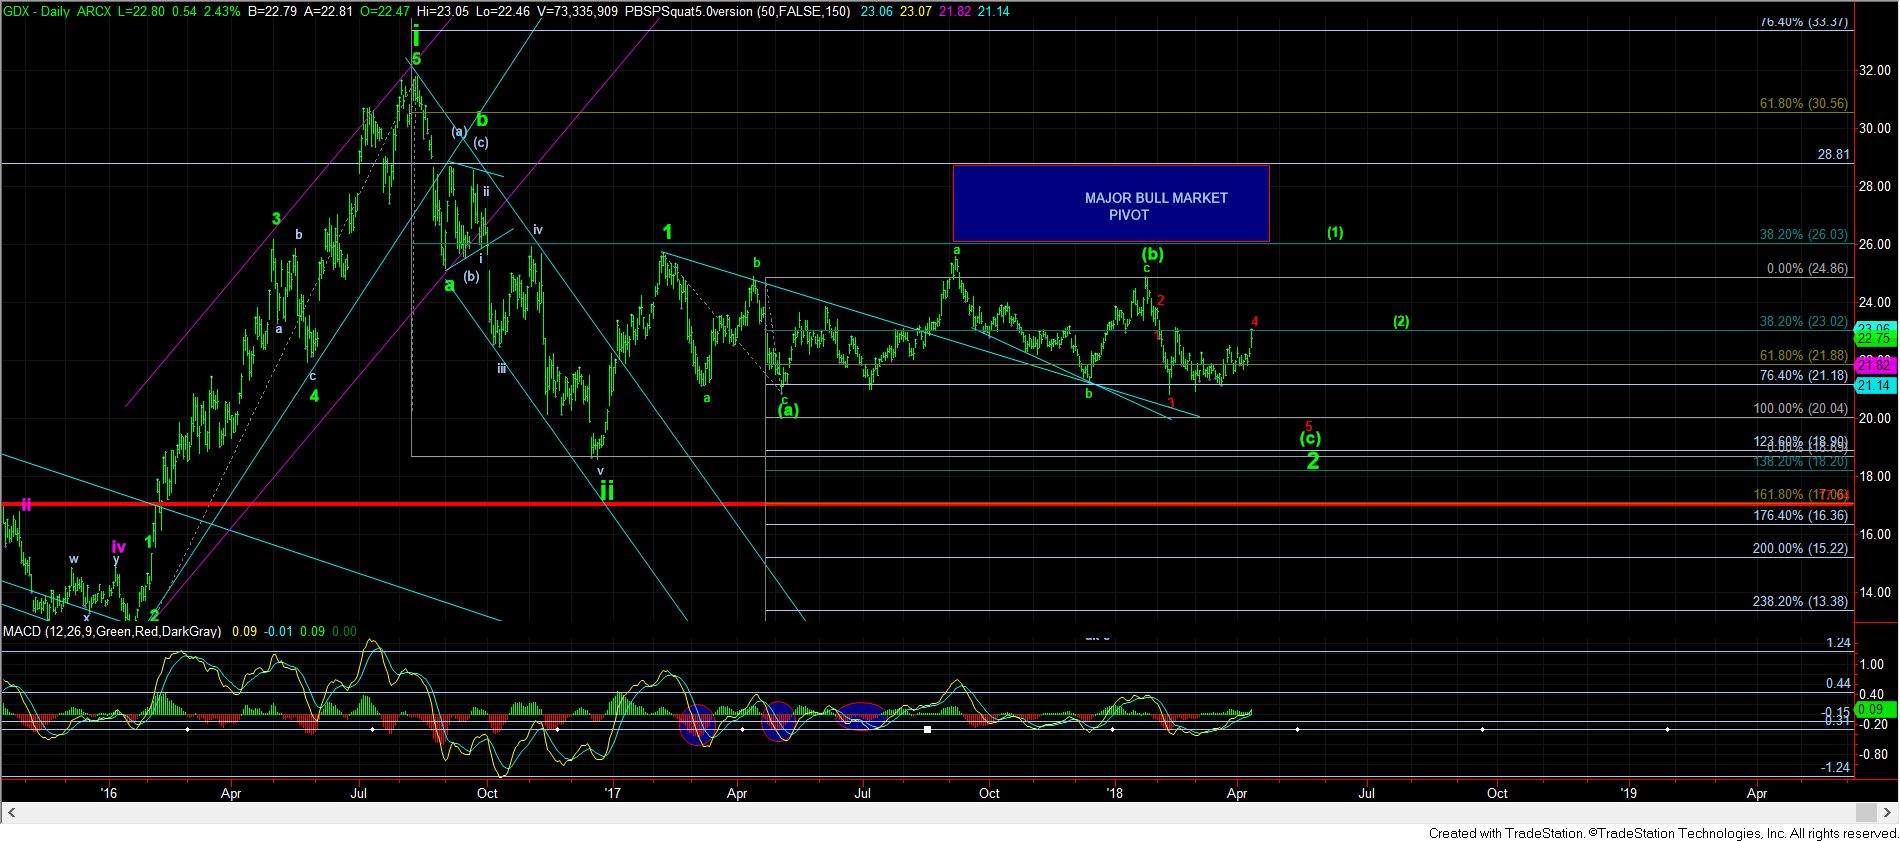
With regard to the GDX, today may have marked the high in a very expanded 4th wave for the (c) wave of 2. While it “looks” unusually large relative to the rest of the pattern, since wave 2 was almost non-existent, the theory of alternation makes me much more comfortable with the potential structure at this time.
Ultimately, it suggests that the highs struck today could mark the start to the last drop in the complex. However, if we are going to see continued strength over the highs struck today, then the market can certainly set up to break out much sooner than later.
Overall, I still think we need to be much more focused on the bigger wave degrees rather than the smaller movements, as it seems to frustrate too many of you. In fact, at the recent lows from which we began this recent rally, many were throwing their hands in the air in frustration, and complaining how this market will never break out. Oftentimes, that signals a bottoming of sorts in the market, especially when people post in such an emotional manner.
I know it has been a very long consolidation, and it still may take a bit more time, but there is nothing we are seeing on the bigger picture that suggests we should not continue to expect a massive move up in the complex this year. The question is when it will begin