Metals Complex Is Bifurcated
I am still struggling between the charts that still seem like they want run high (silver and ABX), and the others who are now hitting their resistances and can turn down. Unfortunately, nothing has really changed any of these perspectives for me since the weekend.
The main chart to highlight is silver. As I noted with regard to silver, its downside pattern is really full. While that does not mean it cannot go lower, it does mean that looking lower may cause you to miss out on the next run higher. As long as all pullbacks remain corrective, silver has a pattern in place to run towards the 16 region to complete 5 waves up off the lows. And, should we pullback correctively in a wave ii from that rally, and then move back over the top of wave i, that would be our strong confirmation that the bull market has resumed in silver, and I would even be considering leveraged long positions at that time.
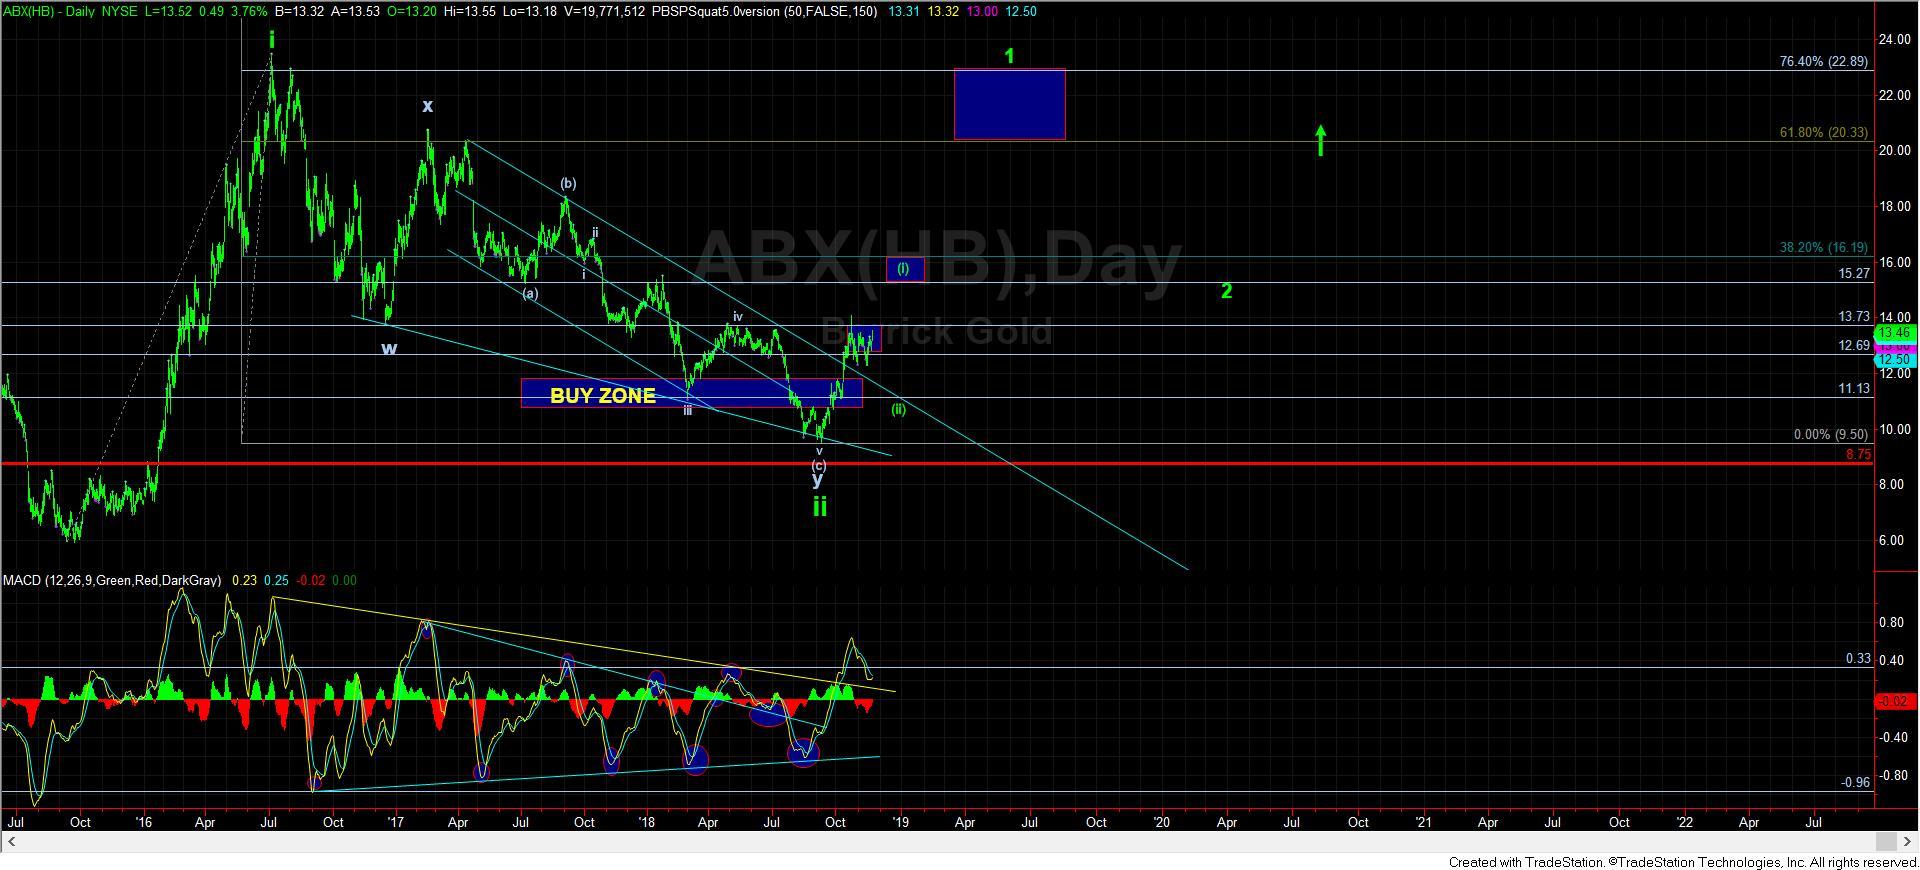
For those that have been following us for some time, you would know that we highlighted how ABX had a completed and very “fully cooked” downside count, and would likely lead the market off the lows. Thus far, that is what we have seen. Currently, ABX retains its potential to run to the 15 region in a more extended wave (i) off the lows. And, to be honest, if that consolidation was already all of wave (ii), and we rally through the 16.25 region, ABX may already be in its wave 1 targeting the blue box. Should that occur, and you want to add to you positions, you would use the 15 region for stops.
Keep in mind, when this market begins to run, they RARELY allow for a “gentleman’s entry,” as almost all pullbacks become quite shallow. So, clearly, I would not want to be shorting the ABX if I was looking for a hedge in this complex.
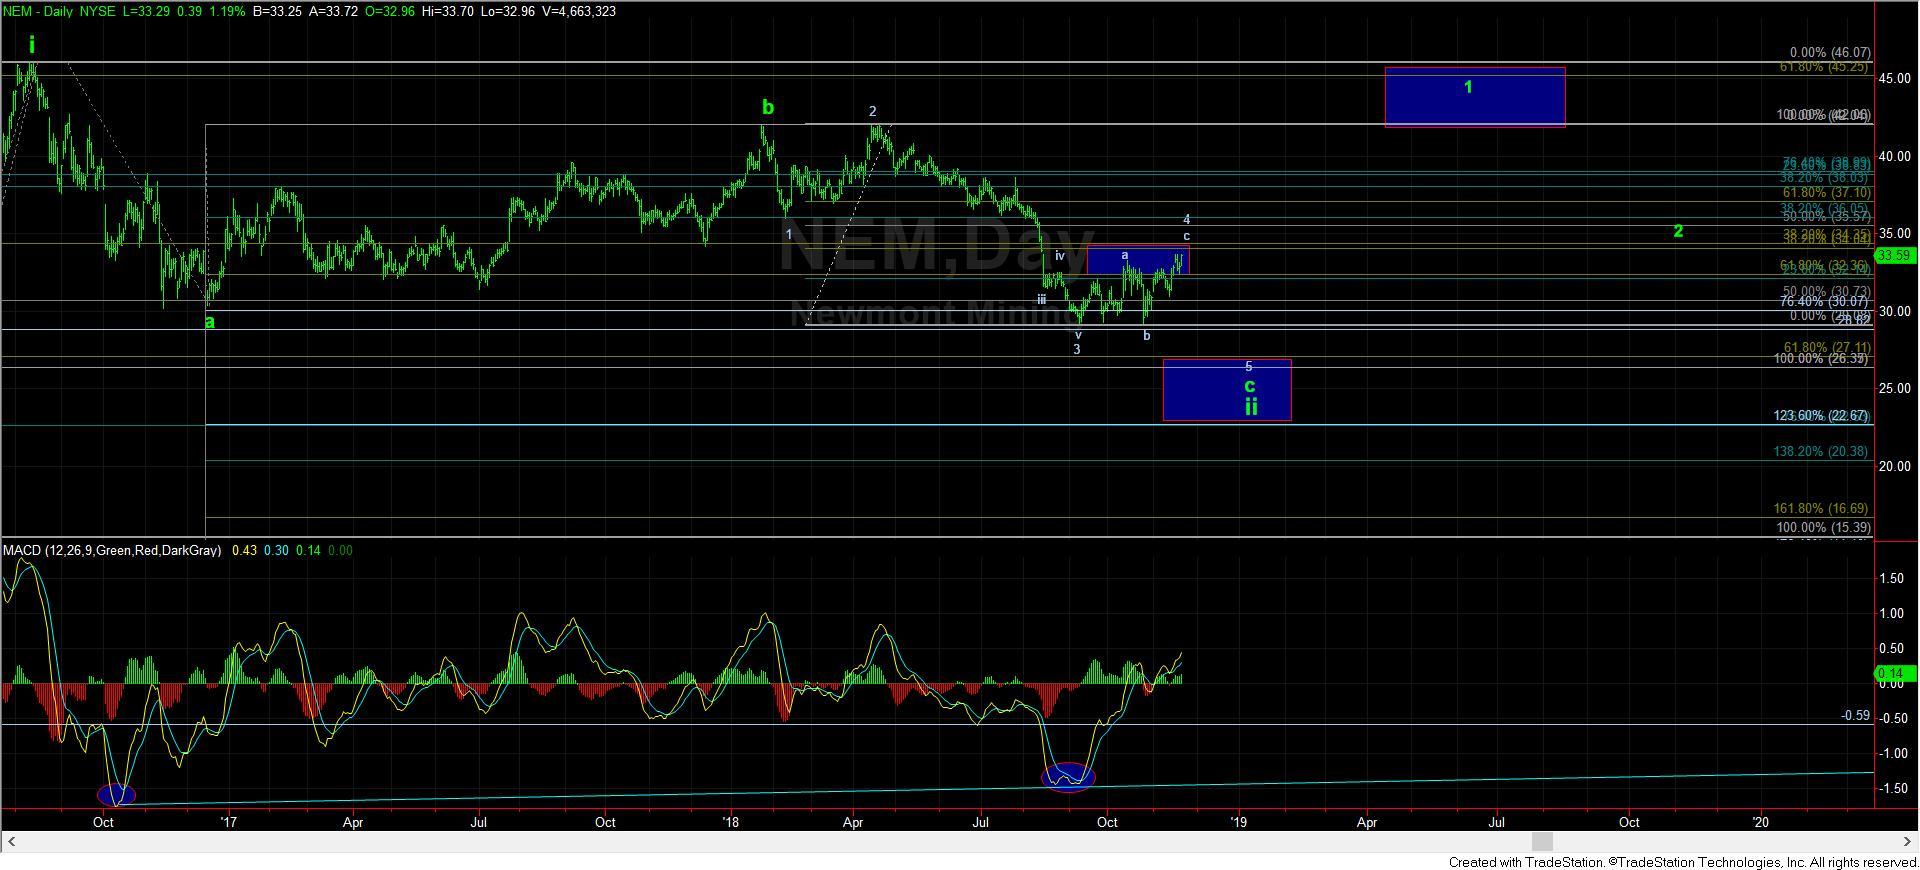
But, when I look at the NEM, I still have no satisfying bottoming structure, nor do I have a clearly impulsive structure that allows me to maintain a confident view that the bottom has been struck. The only clue that suggests a bottom may have been struck is that it hit the minimum target we had for this pullback in the 29 region (before I slightly lowered it based upon the micro structure I was following. The ideal target still remains in the 26-27 region.
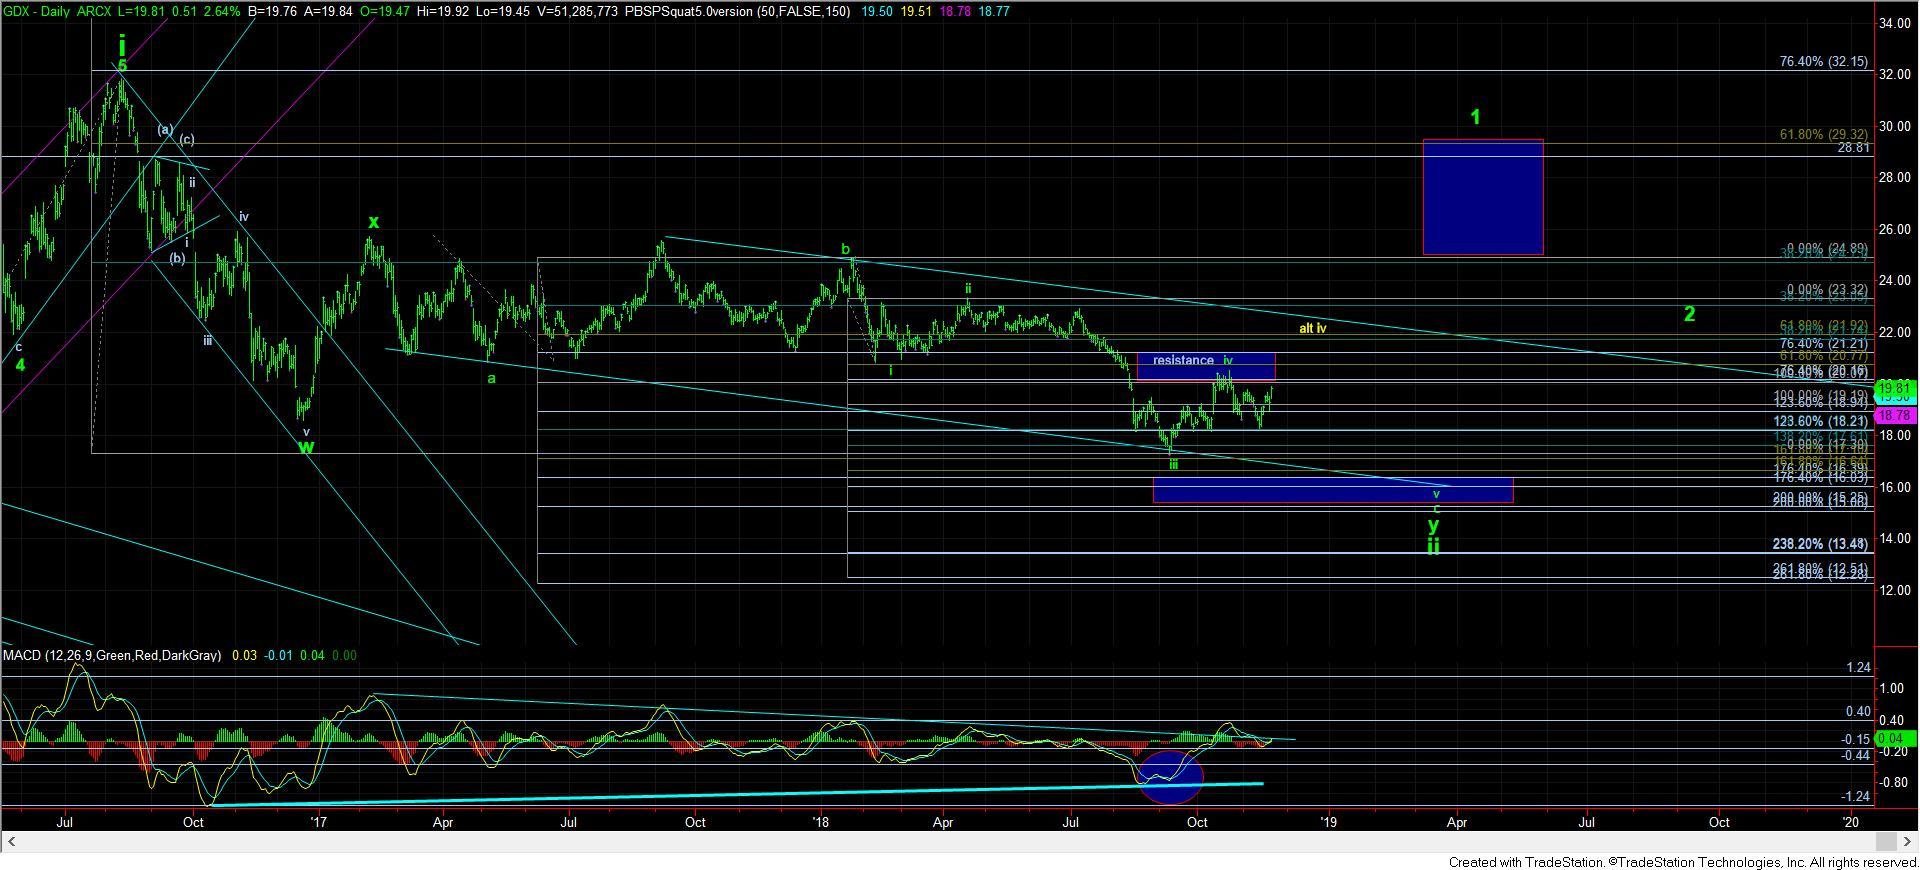
And, I would imagine that the GDX has now being pushed and pulled between these two potentials, which is likely why it, like NEM, as has presented no satisfying bottoming structure just yet. While I do maintain some hedges on GDX, I would stop out on a strong break out of 20.51, as that would suggest that ABX is pulling the market higher, with my next target on GDX being in the 21.90 region. That is where I would attempt to re-hedge should we get a completed pattern into that next resistance region.
Mind you, a rally towards 22 which then turns us down in the GDX suggests that this last segment of the bottoming structure in the GDX is actually an ending diagonal, which will lead us to another chopping 1-b-c to the downside towards the 16 region, and would likely push off the bottoming until the end of the 1st quarter of 2019, or early 2nd quarter of 2019. And, the main reason I cannot view the bottom as having been struck in GDX with any higher probability is due to the 3-wave structures with which we began this rally off the last lows, which do not lend themselves to a clean 1-2, i-ii count off the lows.
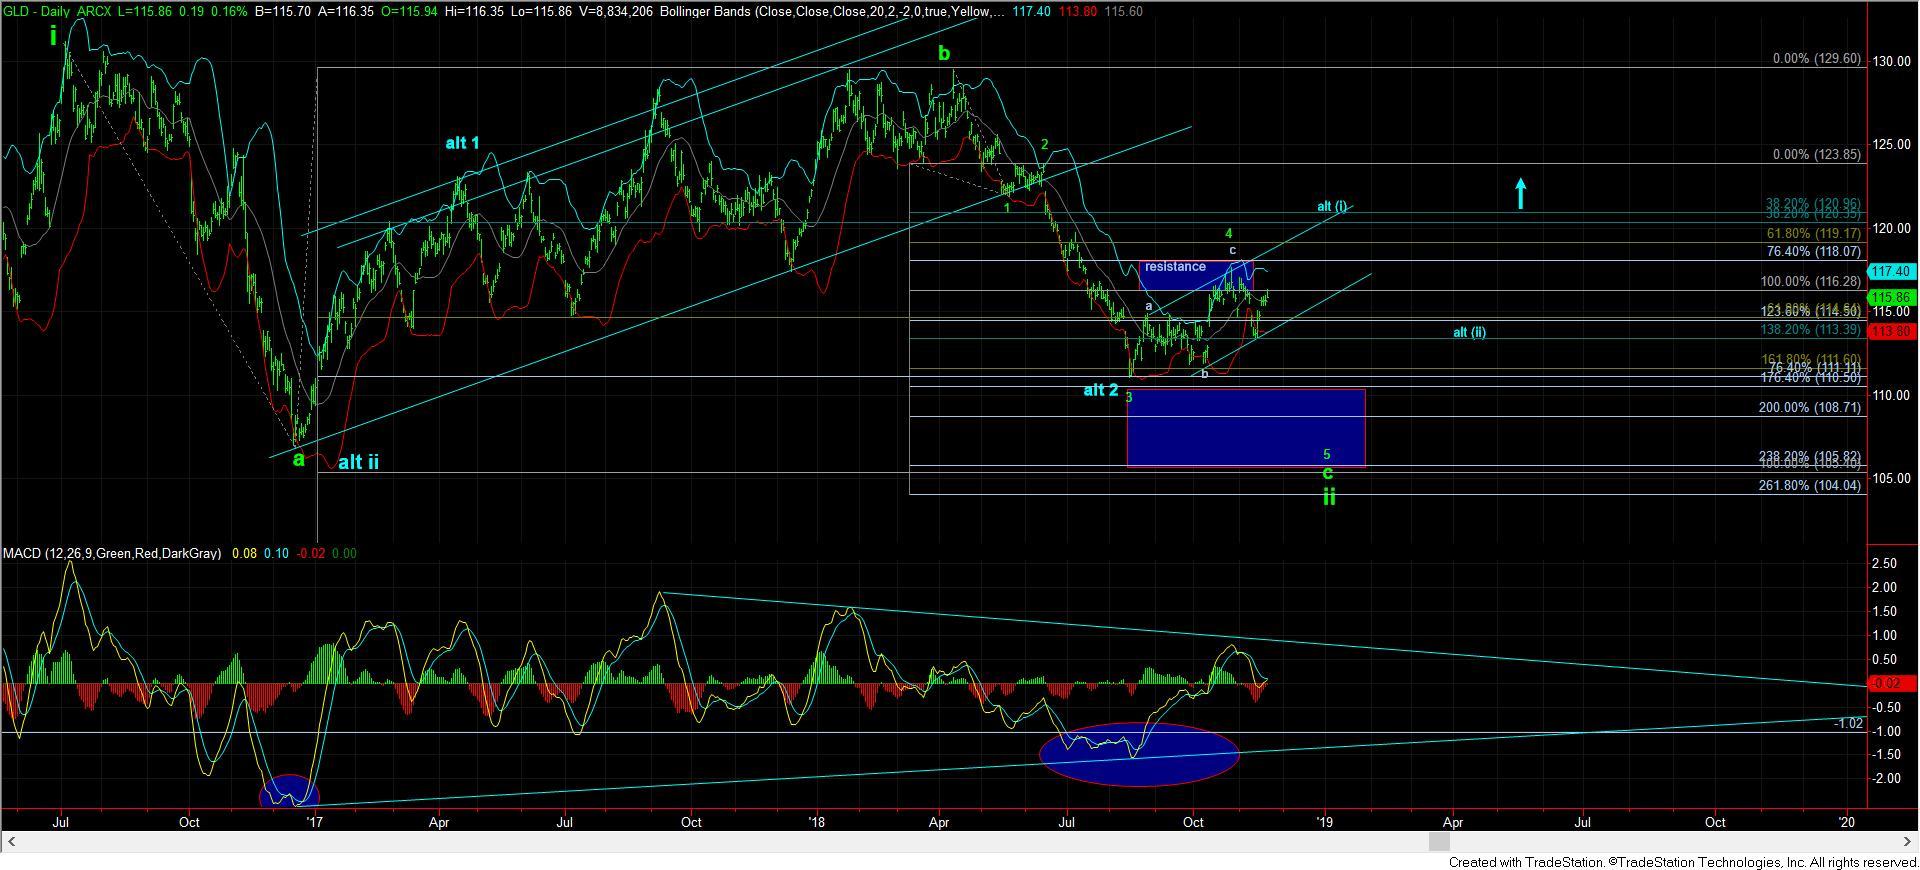
This brings me to GLD. It is now hovering below its resistance in the 117 region. And, it too presents as an ending diagonal to the downside. However, if we were to break out over the 117 region, and follow through over the high struck in October, I would have to strongly consider it as having bottomed, and developing a leading diagonal off the lows, as presented in blue on the daily chart. Should that occur, I would not be shorting GLD, and would only consider doing so if I saw a CLEAR 5 wave structure to the downside.
For those that have been following me closely in the room, and on my live video, you would know that I sold my shorter dated hedges as we approached the 1.236 extension down in GLD because I was expecting a wave iv bounce. While we certainly did see that bounce, it has left me well net long but with some hedges left in my pocket. As I noted, I will be exiting most of the remaining hedges (other than the insurance ones) should we see a break out in GDX over the 20.51 level and will re-strike if we see a completed pattern into the next resistance in the 22 region.
While I would love to confidently view this complex as having bottomed, I still have too many incomplete downside patterns, even though there are almost as many completed downside patterns. This is the push and pull we always see in the market as we develop a long term bottom. And, sometimes the completed downside patterns are so strong in their reversals, they simply pull the rest of the market up with them, as we saw in early 2016. So stay on your toes, as the next major bullish ride will likely be a wild one. But, should we see a bigger rally take hold, keep in mind that it is likely wave 1 of iii, as presented clearly on the daily ABX chart. That means that there will still be one more opportunity to get long during the bigger degree wave 2 pullback, as also shown on the daily chart. But, we are certainly getting closer and closer to a major bottom being struck in the complex.