Metals Charts Are All Over The Place
As I highlighted over the weekend, different charts in the metals complex are at different points of trend. As an example, silver recently hit multi-year lows, whereas GLD is approaching its all-time highs.
And the charts of various miners are in the same position.
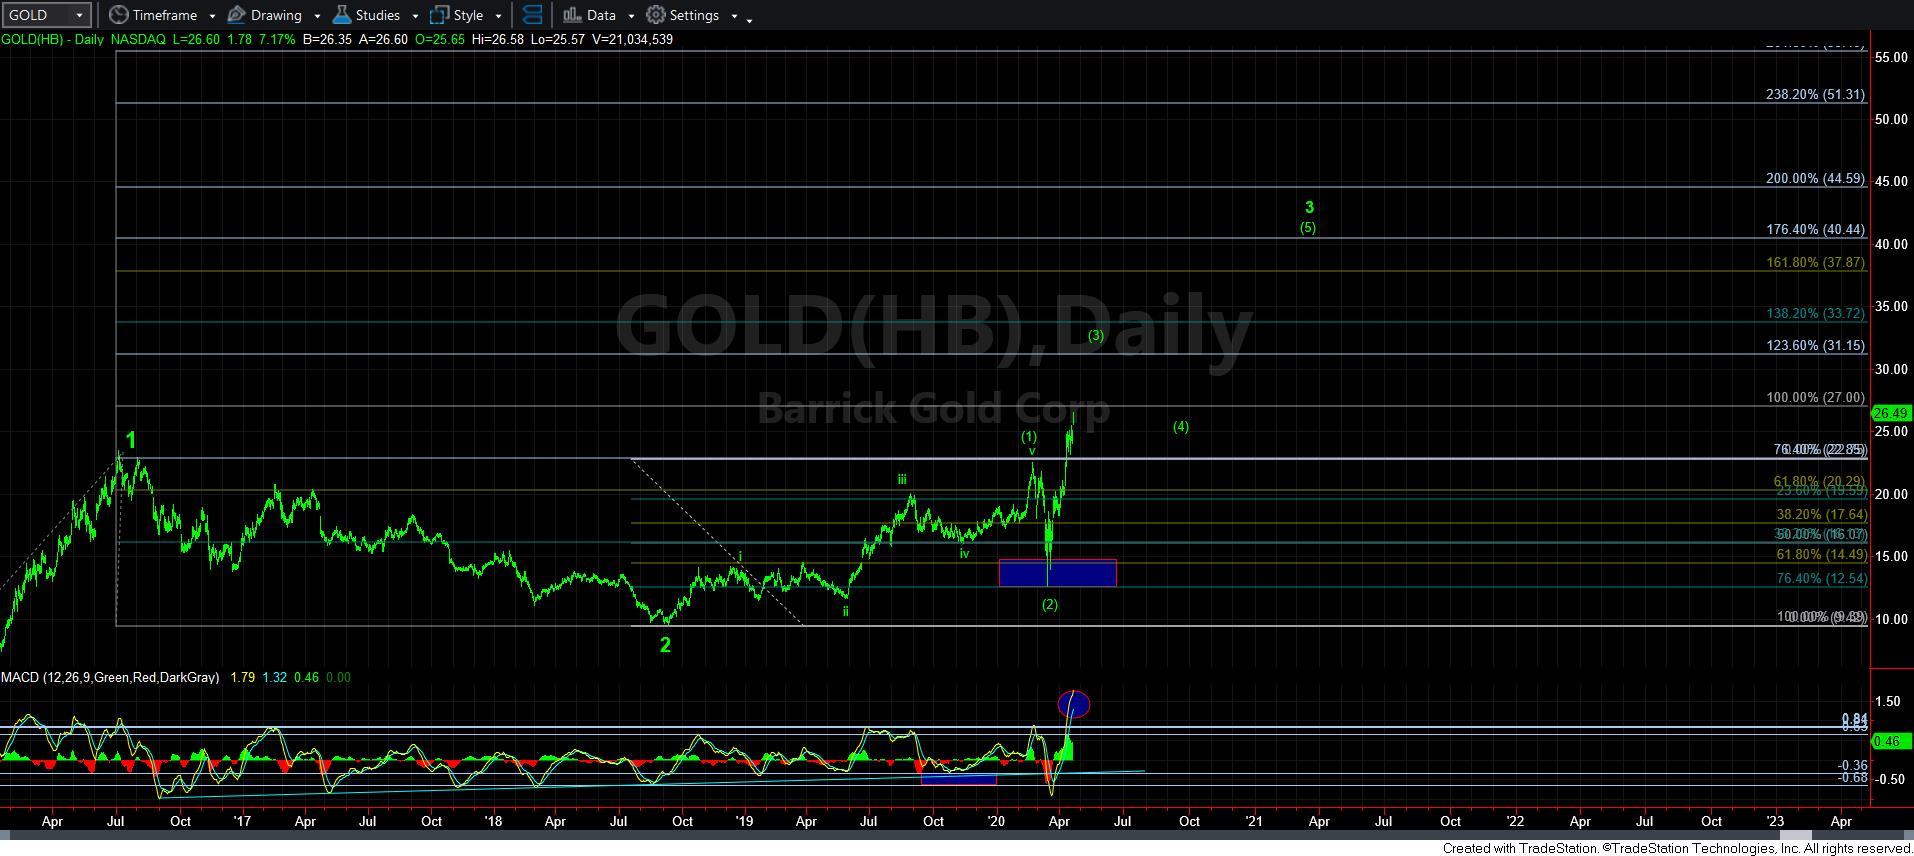
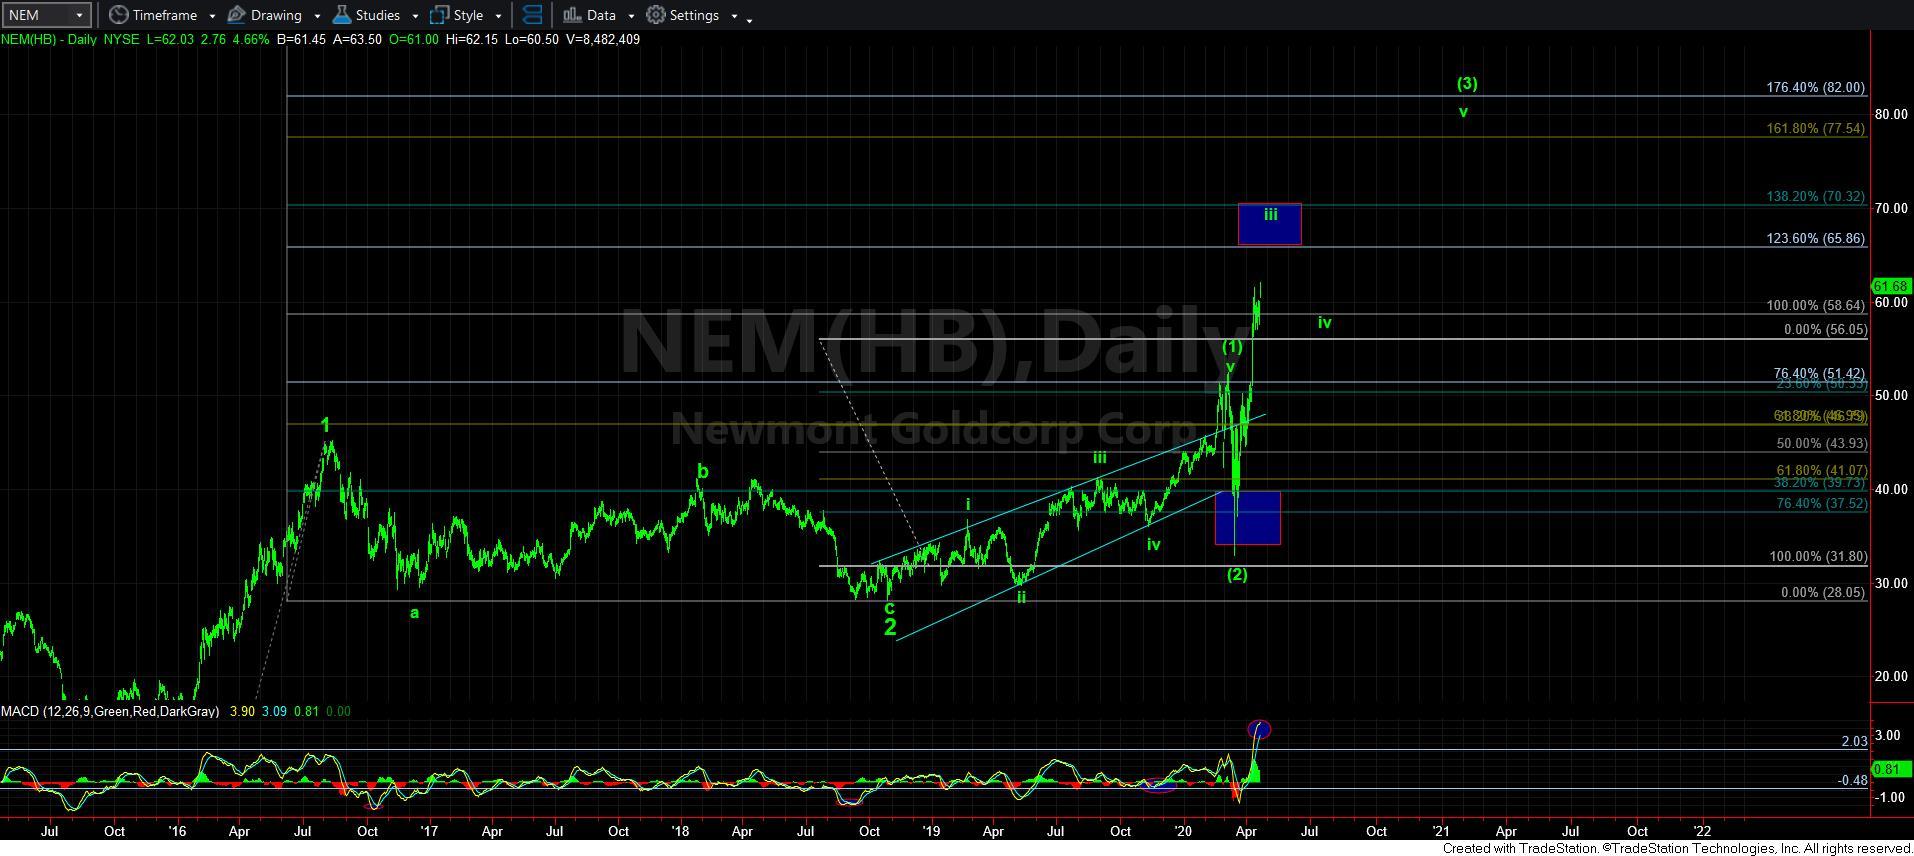
Yet, when I look at the NEM and GOLD charts, I simply cannot take any bearish case seriously as long as they continue to consolidate in a corrective manner over their recent break out points. Moreover, with their daily MACD’s hitting multi-year highs, this confirms the count that they are likely already in the heart of their respective 3rd waves. So, it is only a matter of time before the GDX follows along. Again, I want to stress that this applies for as long as they continue to remain over their recent break out points.
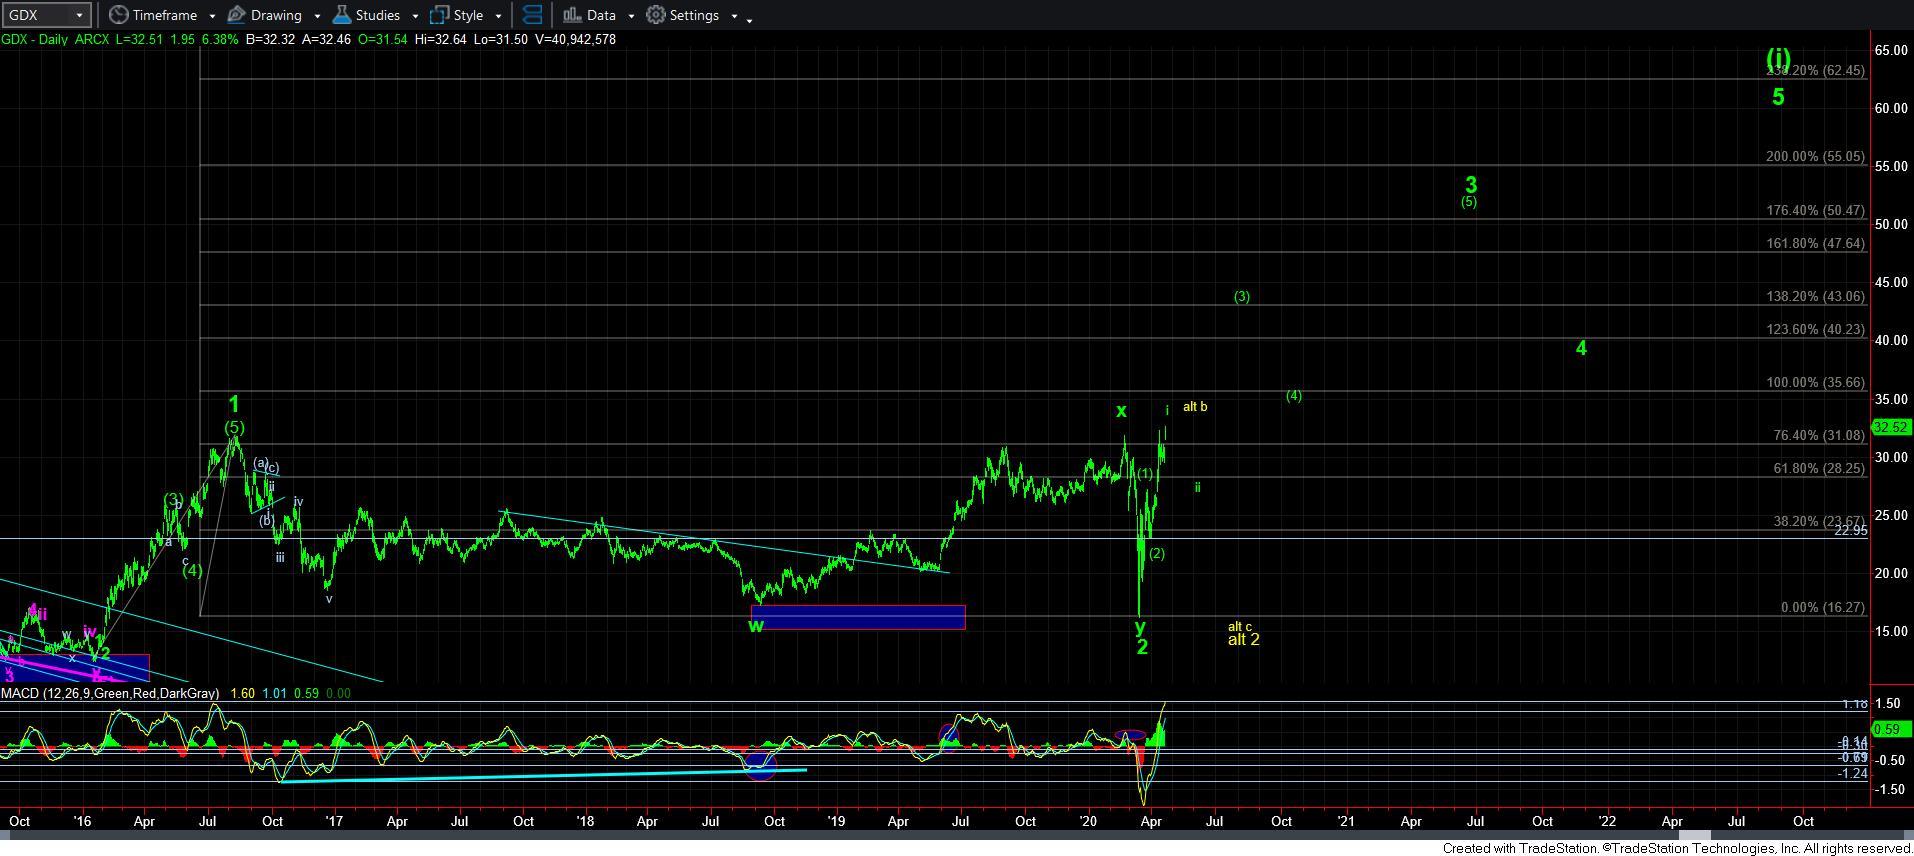
Therefore, while the GDX is still a bit of a question to me in its micro count, I have no serious bearish count to suggest for as long as its two largest holdings – NEM and GOLD – continue to consolidate and rally over their recent break out points. The most “bearish” count I can reasonably consider while NEM and GOLD maintain their current postures is the i-ii shown on my daily chart. And should GDX break out over the 35.60 region, it would confirm my bullish expectation presented on the daily chart, with a minimum target for the completed 5-wave structure off the early 2016 low in the 55 region, but with strong potential to see extension take it well past 60 before it completes this 5-wave structure off the early 2016 low.
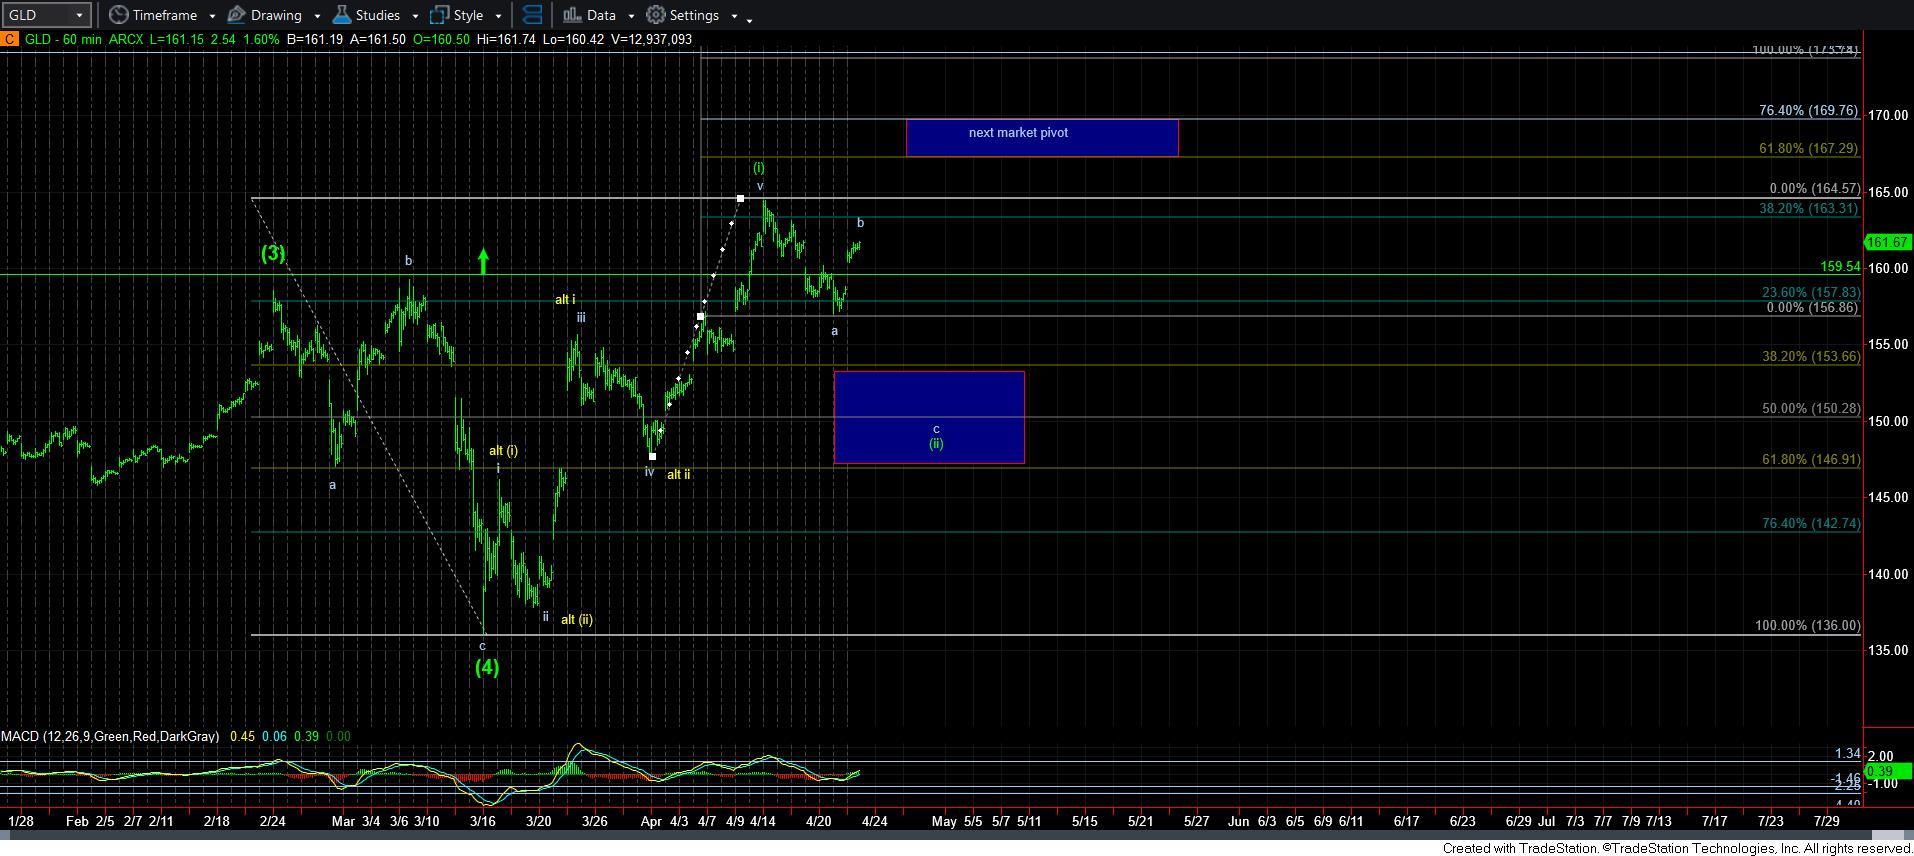
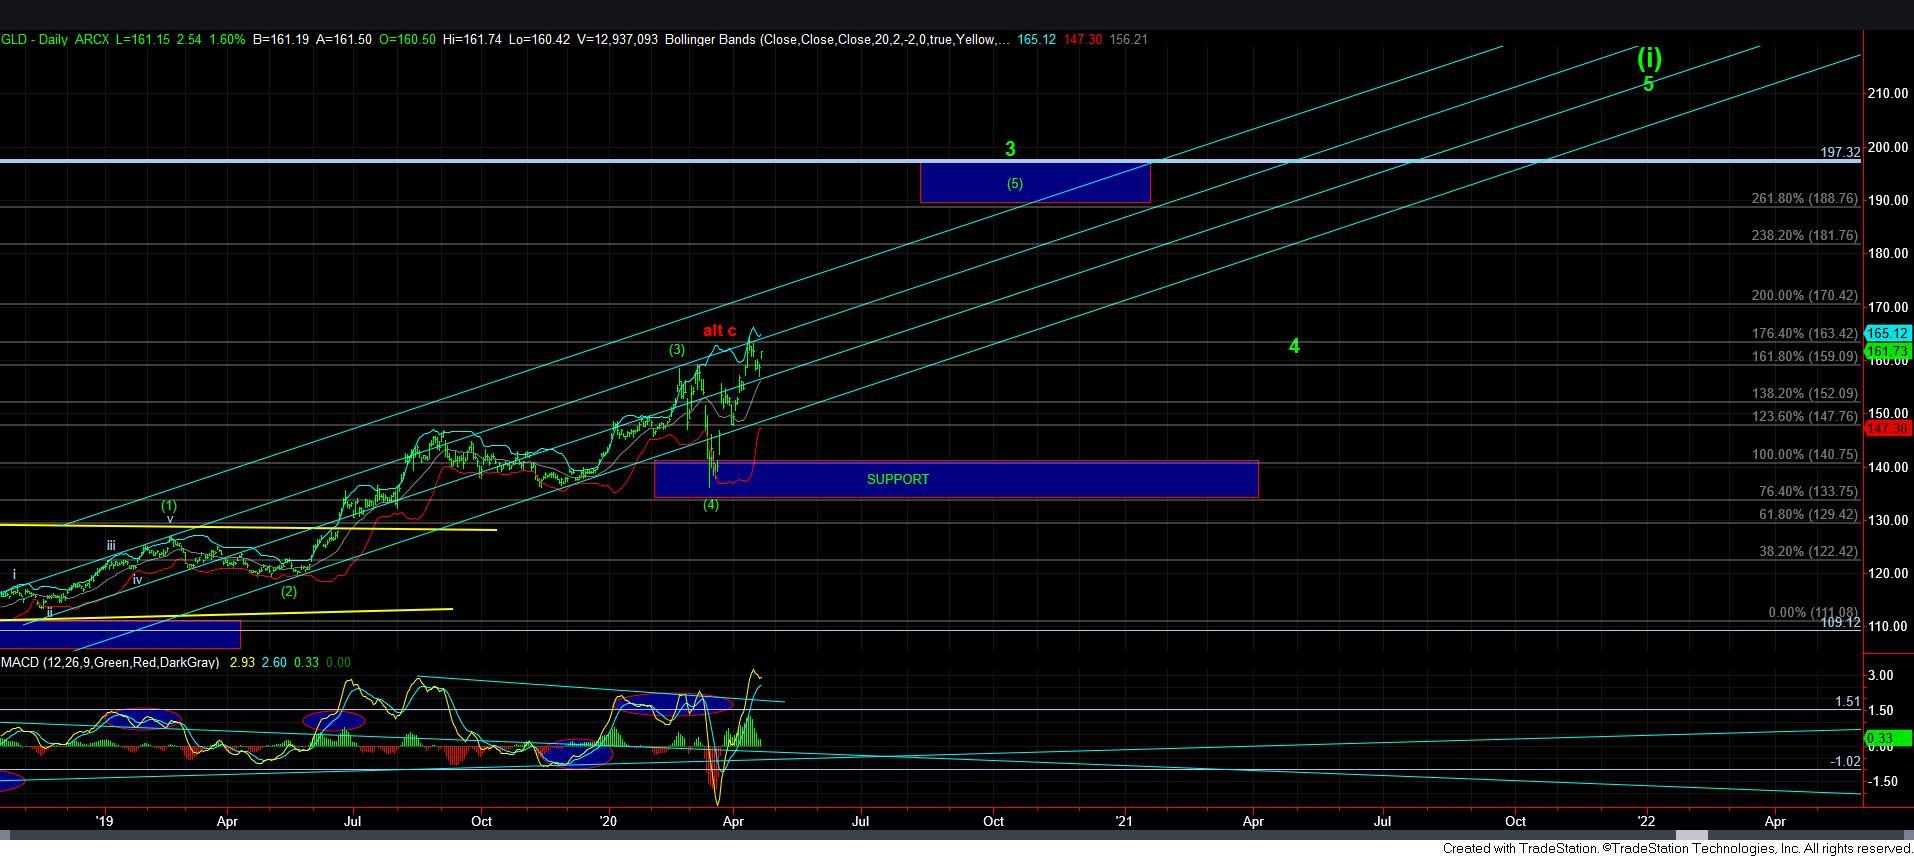
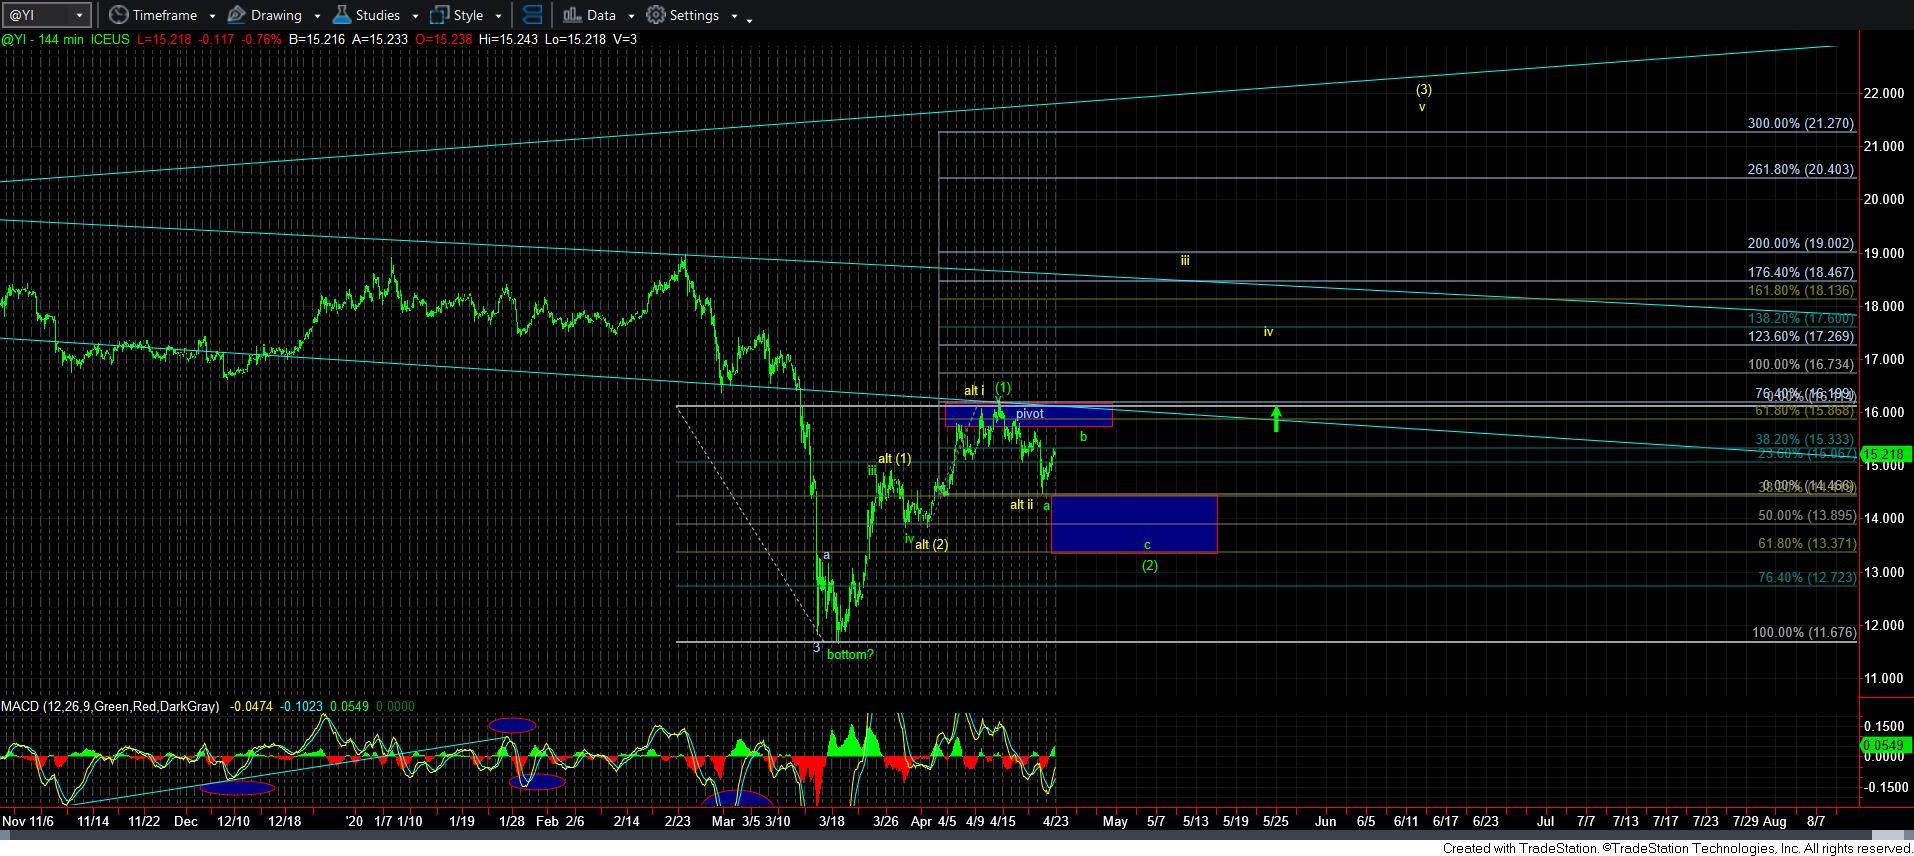
So, this now brings me to the GLD and silver charts. And, I think the micro structures are somewhat aligned. While GLD is much further along in its trend than silver, I think silver will catch up and rather quickly. But, first, their micro patterns would ideally suggest this move up today is a b-wave in an a-b-c corrective pullback. However, if their micro strength continues for the next few days, then this micro rally can complete 5 waves up off their last pullback lows, and they will set up for another rally phase in the coming weeks/months. While silver’s would likely be quite explosive, GLD would likely be targeting the 190+ region.
At the end of the day, I think silver will give us insight into the broader complex as a whole. You see, once silver completes this consolidation and follows through over the 17 region, I think that can unleash a melt-up in the market wherein all the other charts which have been underperforming the rest of the complex will come alive and play catch up in what may be a breathtaking rally throughout the complex. For this reason, silver will be my trade of choice once we get that confirmed break out structure.
In conclusion, the next few days will give us better insight into whether the move up in silver off the top of the support box is a b-wave, or if it will continue higher in a micro 5-wave structure back to the pivot. For now, I am treating it as a b-wave, but if we see further strength in the coming days which completes 5-waves into the pivot, then I will be placing us on BREAKOUT-ALERT!!