Metals Bulls, Don’t Give Up Yet
The “sentiment” in the metals complex now ranges from indifferent to very bearish. In fact, I am seeing many just posting how they are just fed up with the metals complex, and just want to move on. And, that is often the time when fireworks are seen. So, I think it is prudent that we remain on our toes right now, just as many seem to giving up.
With silver’s direct drop lower this week, along with the potential that the GDX may hold its 21 region support, we may be able to maintain a more immediate bullish perspective. However, I still want to note that it will still take several months until the next break out set up is ready to go. But, what I am about to present is the best-case scenario we can view on the charts at this time. And, they need some serious confirmation in the coming weeks.
First, I will go through the more immediate bullish potentials, as presented in silver, GDX and GLD. Then I will discuss the more bearish potential, and what can trigger that.
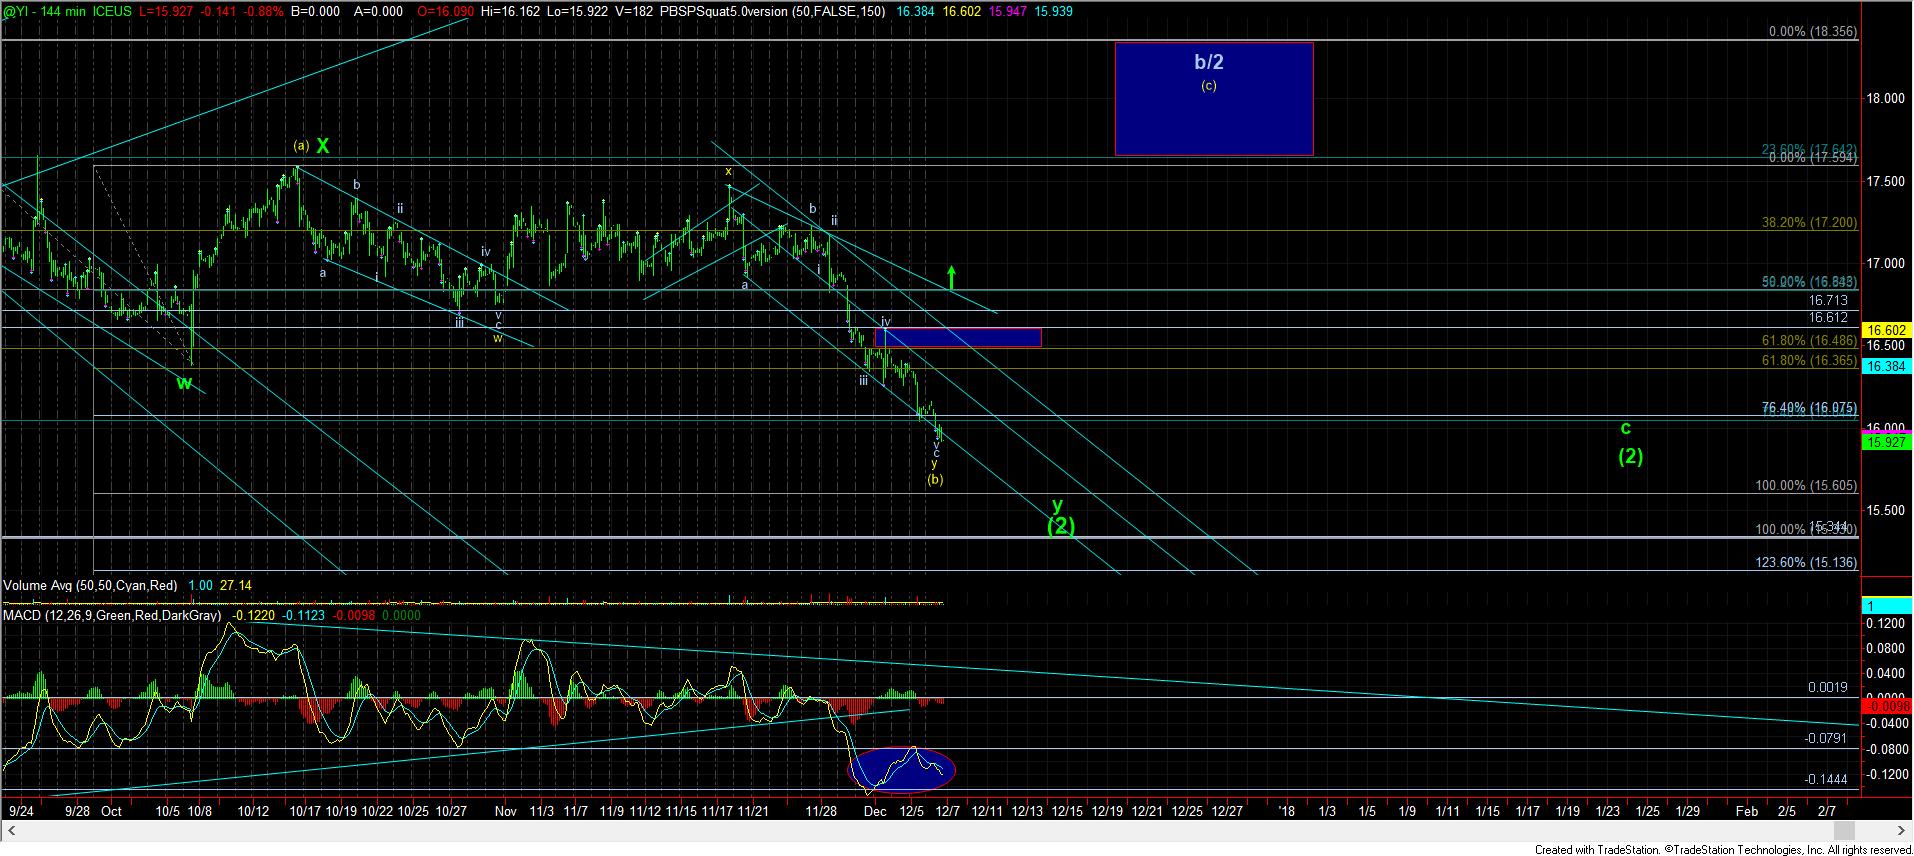
Starting with silver, the more direct drop this week in silver can actually complete all of wave (2) a bit sooner than I had initially expected. This is a very reasonable wave count, as long as we hold over the 15.60 level, where w=y.
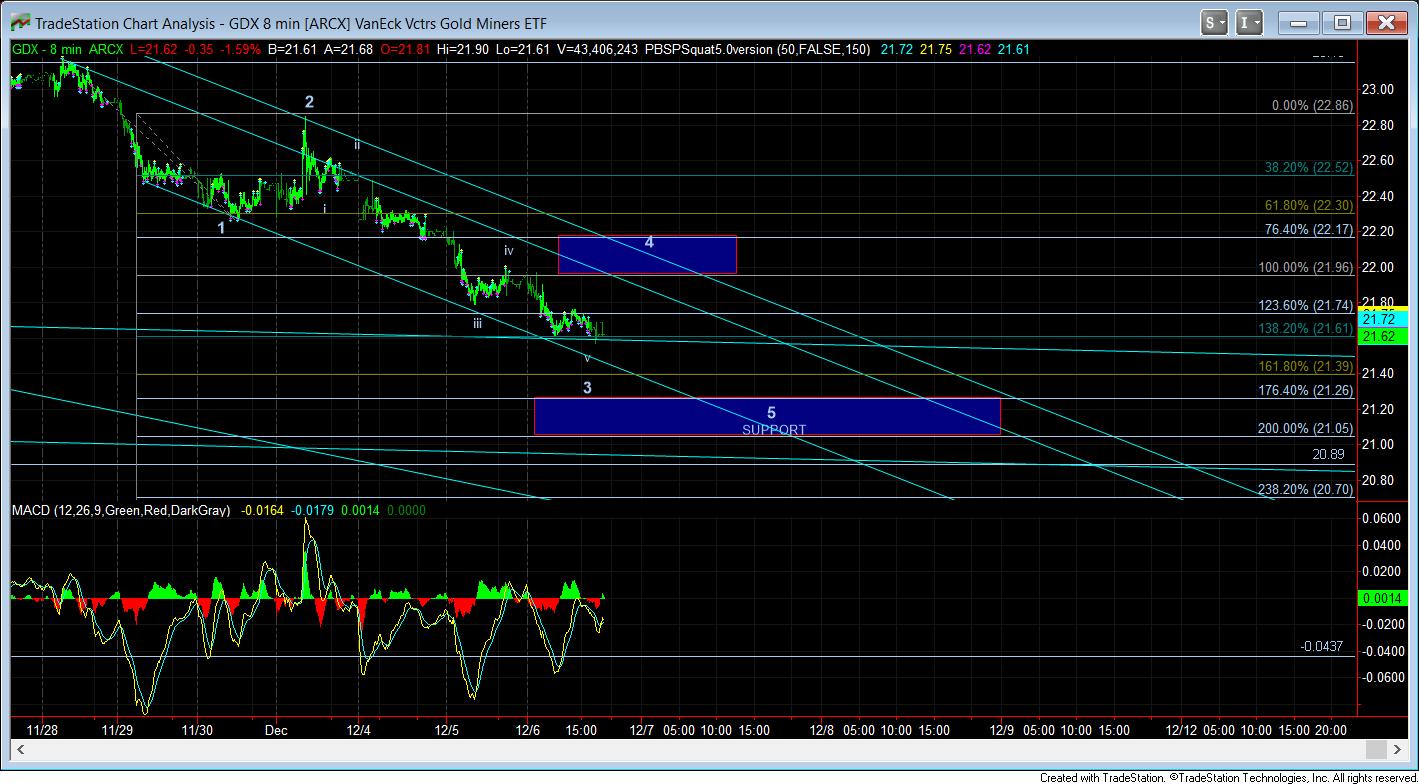
Next we can move to the GDX. As I have noted many times before, the more bullish count in yellow is a reasonable alternative ONLY IF GDX can maintain support over 21. As you can see from the attached 8-minute chart of the GDX, if we can hold the support noted on the chart between 21-21.25 in the coming week or so, we may be able to consider this pullback in the complex 2nd wave of the GDX as completed, which has been presented in yellow. The first indication will be a strong move through the 23.20 region, followed by a full 5 wave structure up towards the yellow wave (1) target region just below the prior rally high.
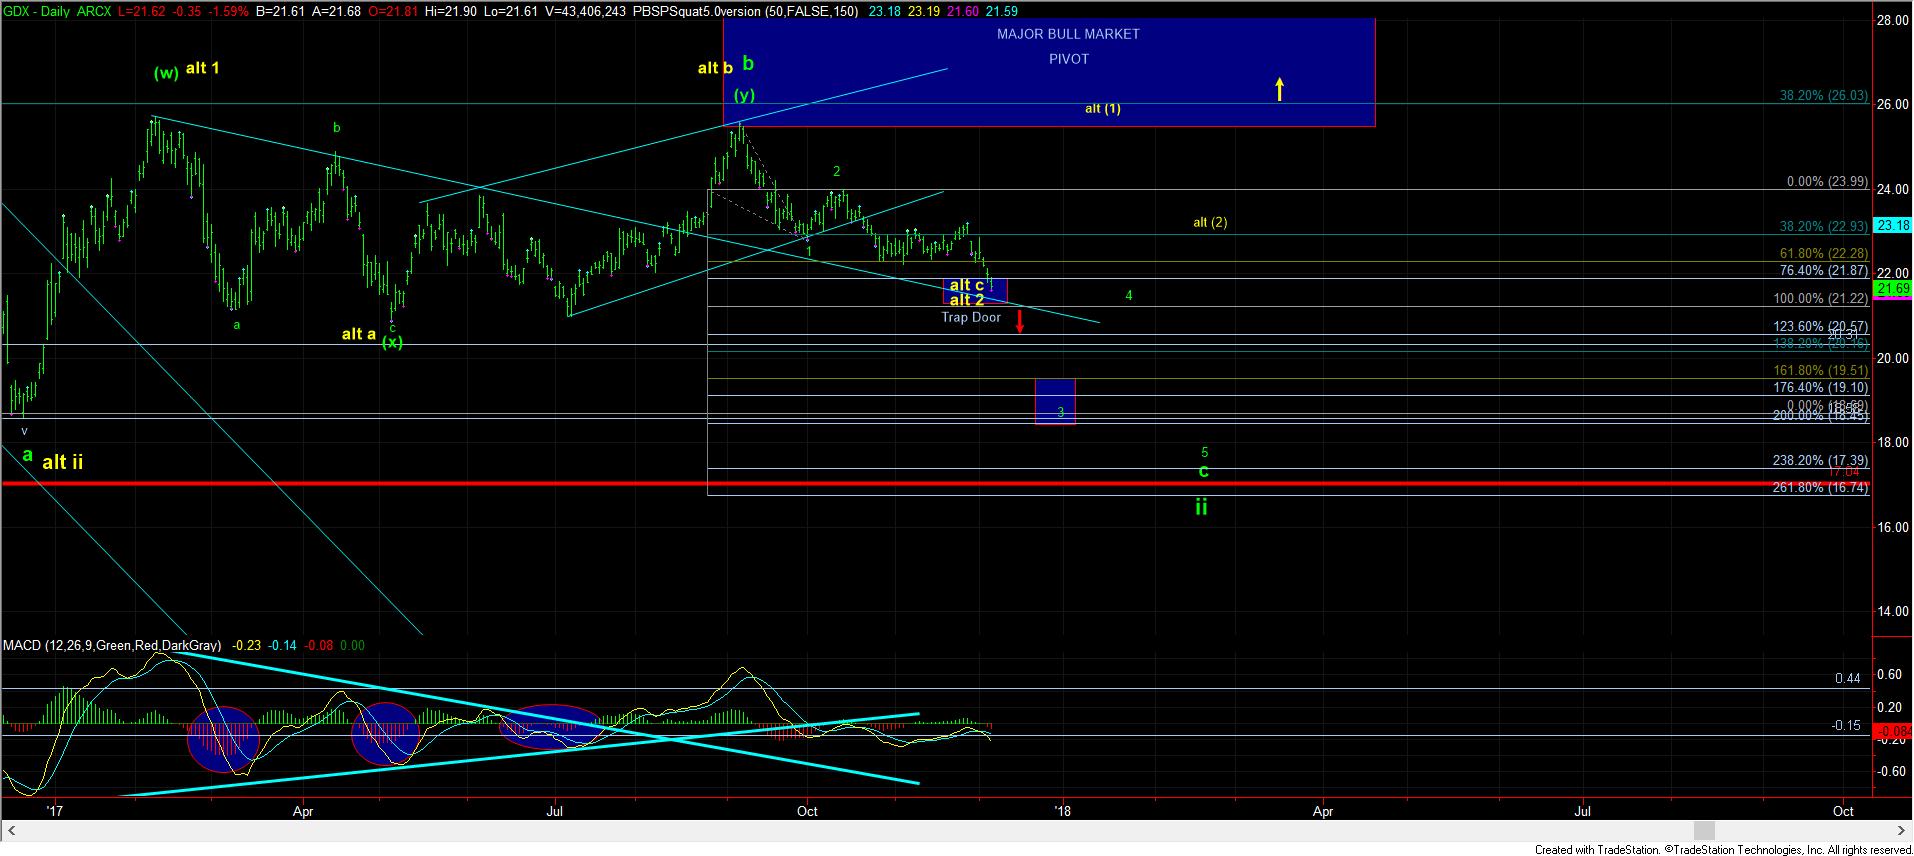
So, ultimately, as long as the GDX is still able to hold the 21 region – as we have been stating for the last several months, and begin a strong rally through the 23.20 region, we may have the makings of a higher level break out sooner rather than later, again, which has been presented in yellow.
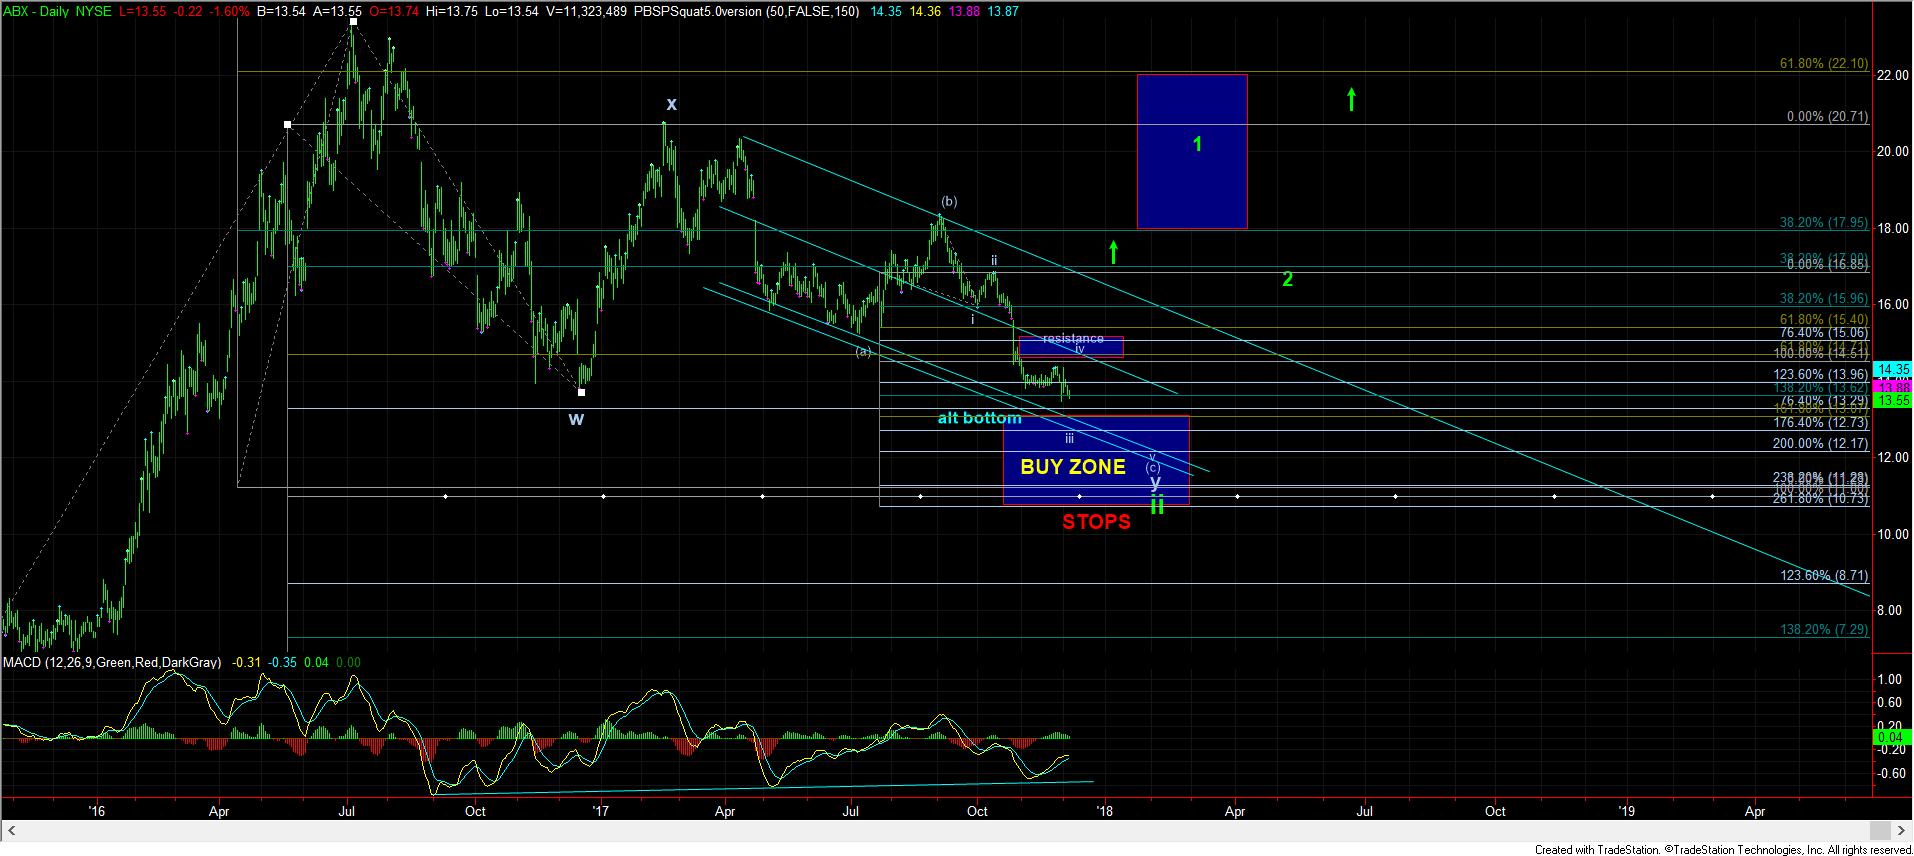
Now, let’s take a peek at the ABX and see if we can glean any new information from that chart. Currently, we are still in between two counts. We still have no confirmation that wave iii has concluded, as it takes a move over 14.38 to confirm that we are in wave iv. Yet, ABX came within 3 cents of that level, and turned back down. Until we are able to move through that level, the ABX can still see an extended wave iii down towards the 12.70 region. So, this too suggests we are at an inflection point which can either continue down in a sizeable drop, or turn back up to complete a 4th wave, or possibly even something more bullish. Unfortunately, this does not leave us with any further clues we can glean from the ABX chart, at least beyond what we are already seeing in the GDX chart.
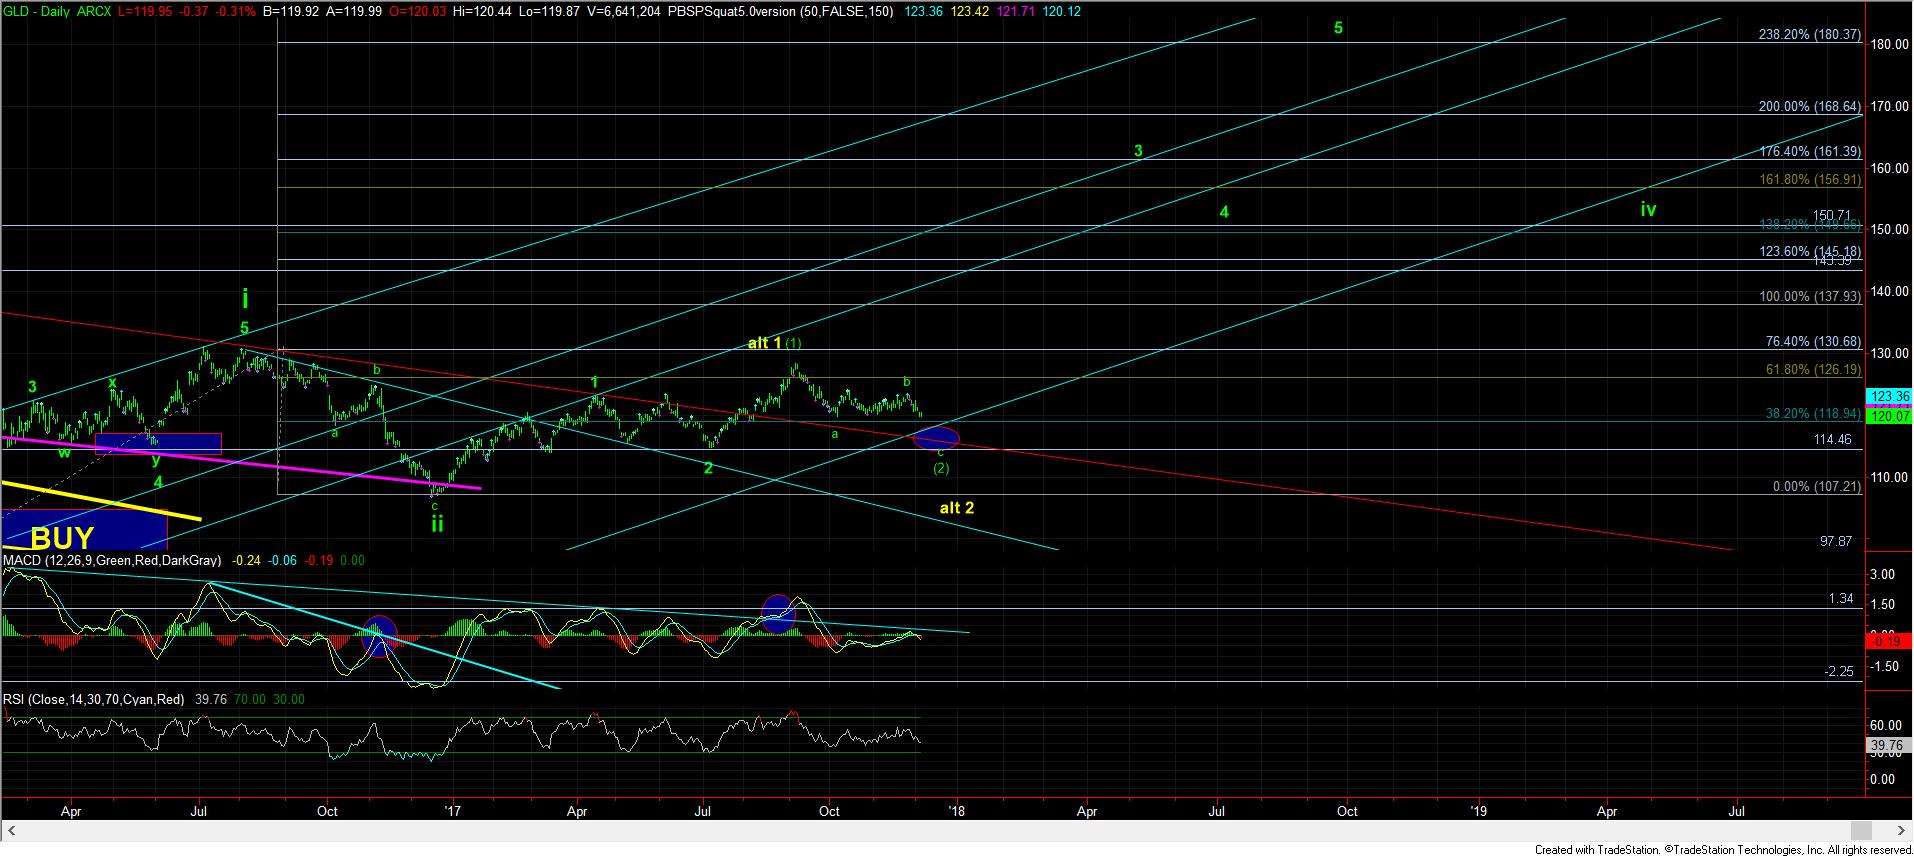
In the GLD, the same pattern is now presented as us being in the c-wave of wave, which means the GLD would need to hold over the 114.50 region, where c=a. Clearly, it does not have to drop that deeply, but that is the traditional target for this structure. Also, this does not align well with the extent of potential further downside in the GDX or in silver, so this does leave certain questions in my mind.
At the end of all of this, it tells us that the market is at an inflection point. If the market wants to maintain a higher-level consolidation, it has its opportunity to prove so over the next week. And, if wants to develop as a bigger pullback, it also has its opportunity over the next week or two. With the GDX 21 region as the dividing line, at least the market is providing us with a relatively clear line of demarcation at this point in time.
Now, should the market break down below 21, it will likely drop into the 20-20.50 region, and then likely come back into the region we now find ourselves within as a back-test. You can always wait for this back-test to short the market, with a stop just over the 22 level, with a target in the box marked with a 3 on the daily GDX chart. Again, this is simply a plan if we see a strong break of the 21 level. Remember, you need to have your plan in place before something occurs, and this is a very reasonable plan to have in the event we do see a break down.
But, until the GDX is able to break below 21, the bulls have an opportunity to prove themselves as we head into the end of 2017.

