Metals Are Still Being Stubborn
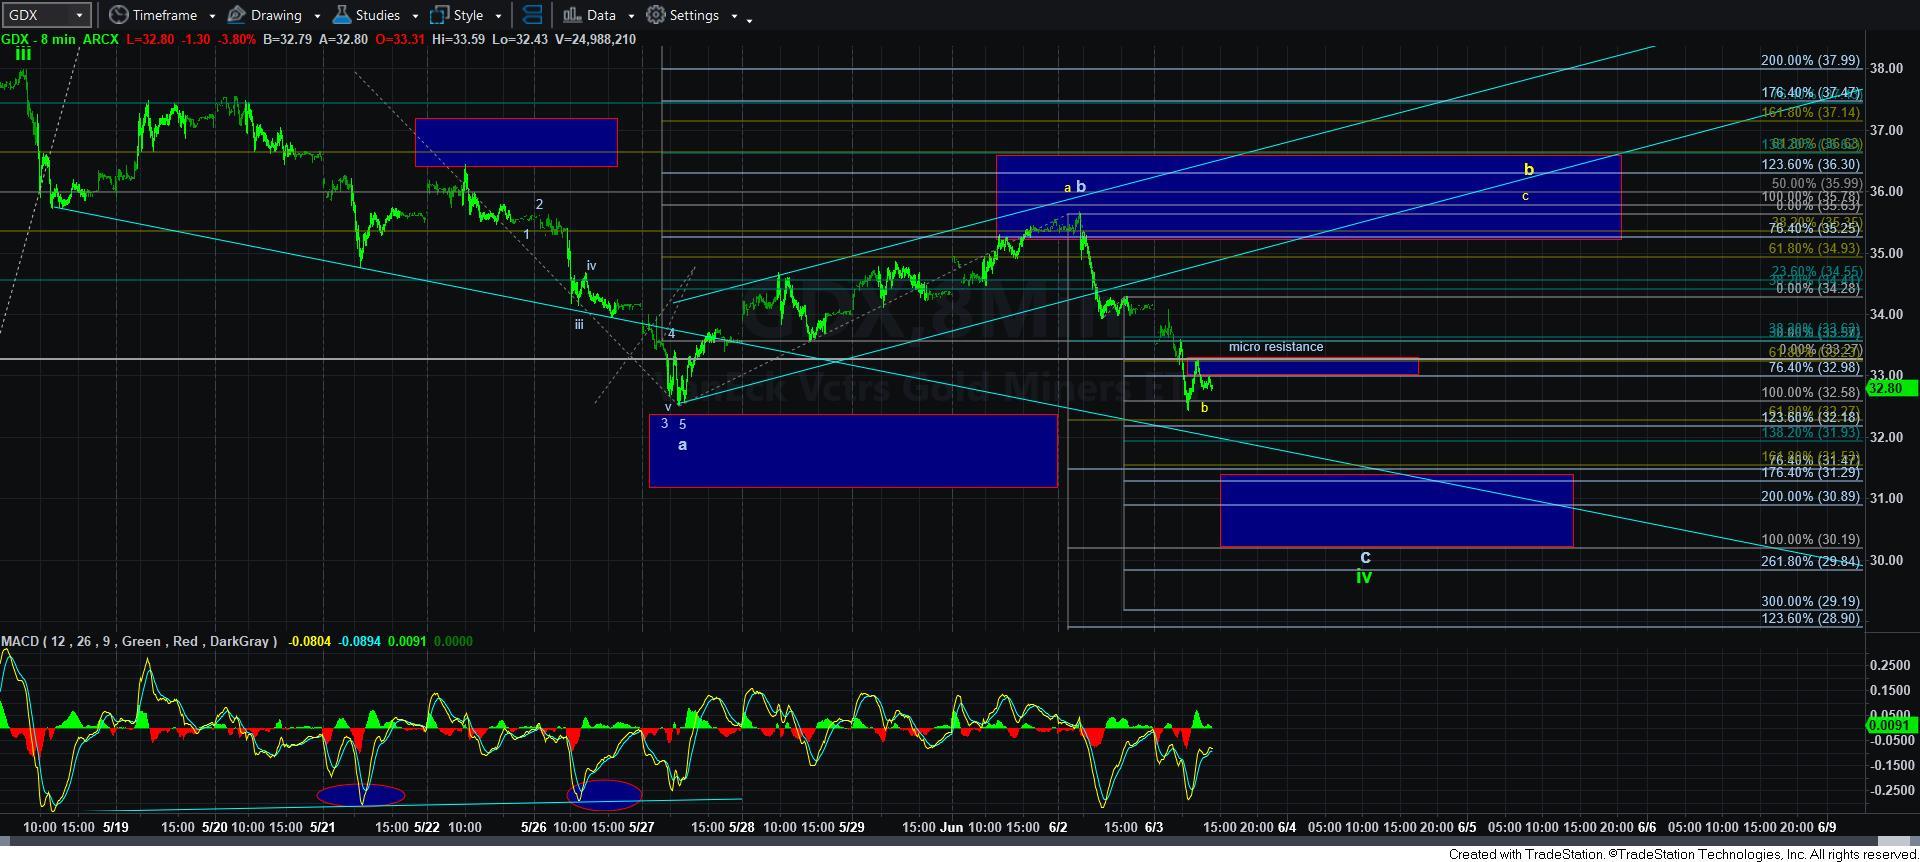
With the GDX having the minimum numbers of waves in place to consider wave iv as completed, we were looking for an impulsive 5-wave structure to suggest that wave v to 40+ has begun. Yet, as the market approached the resistance noted on my chart, I posted the following update on Monday:
“I wanted to send this update to the entire site, since we are approaching another inflection point. With the move up off the lows not looking terribly impulsive, I am getting very cautious and protective in the near term as long as are unable to exceed this resistance box on the GDX. It leaves the door wide open for another decline in a c-wave within a bigger wave iv structure in GDX.”
I followed that up with a post early on Tuesday morning (before the market open) reiterating my caution:
“I want to again highlight that the region between 35.70-36.70 can be a b-wave top in the GDX, pointing us back down to the 31 region, So, if you want to hedge or lighten your positions rather than riding a drop like that, then this is your opportunity.”
On Tuesday morning at the market open, GDX topped at 35.64, and proceeded to drop strongly. So, I hope those who are trading these smaller degree moves heeded my warning. \
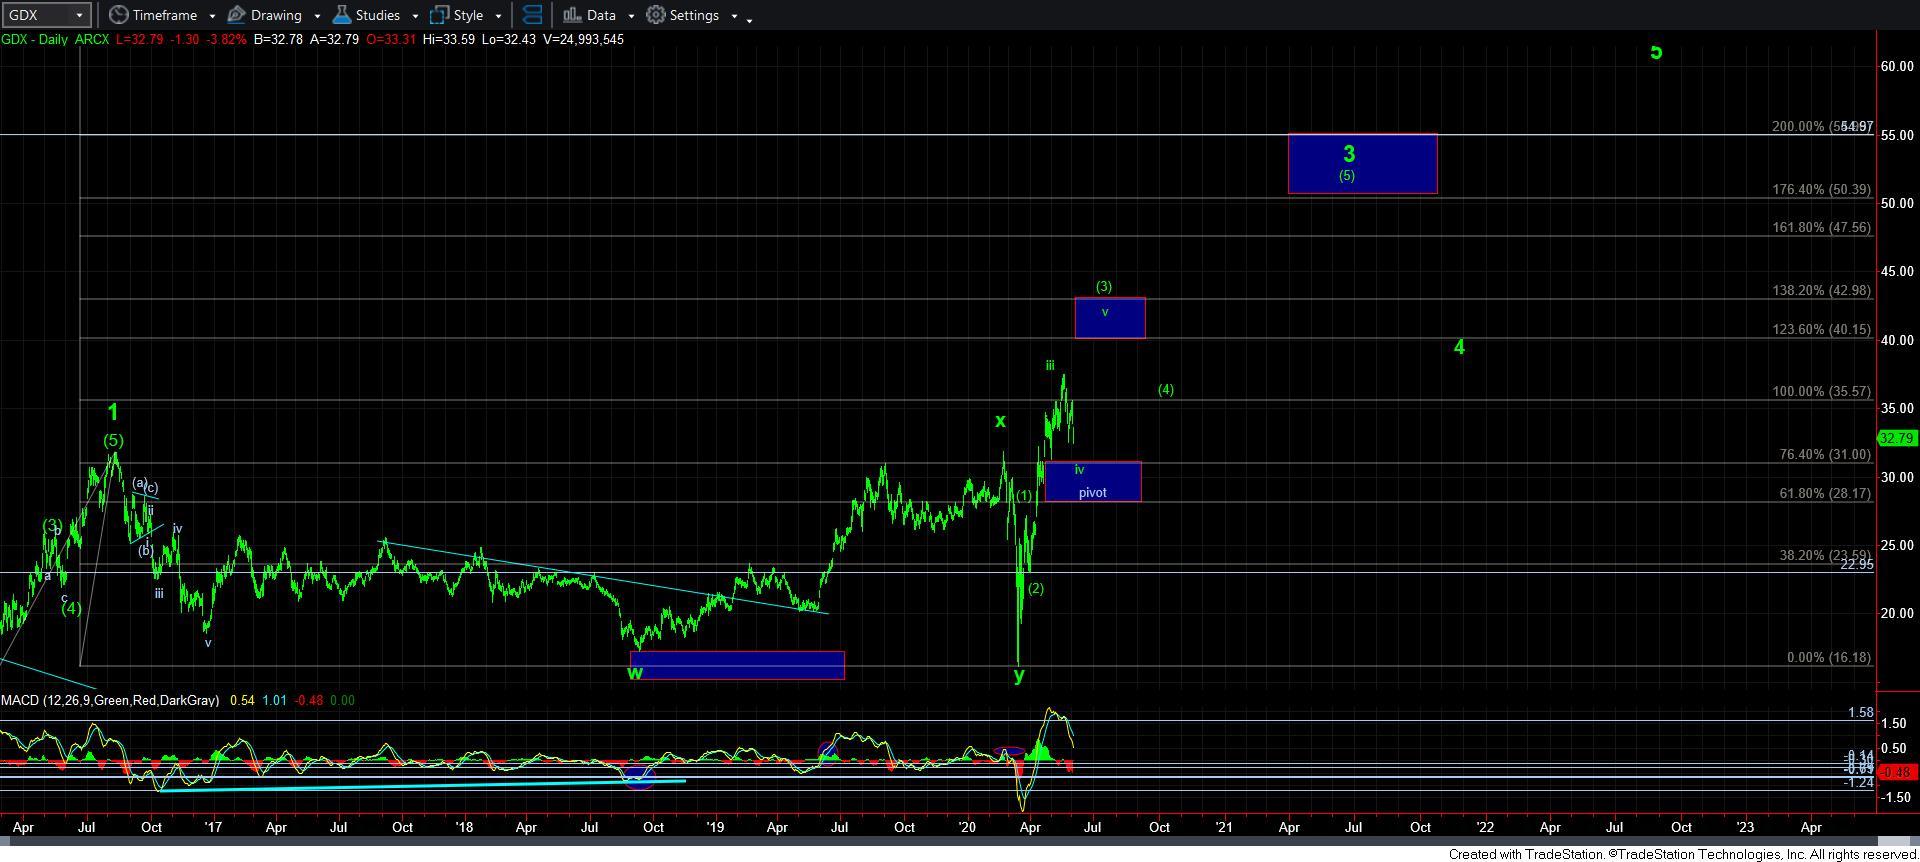
At this point in time, it is unlikely that wave iv has completed. In fact, I think we still have strong potential to drop to the 30-31.50 region in a c-wave of wave iv.
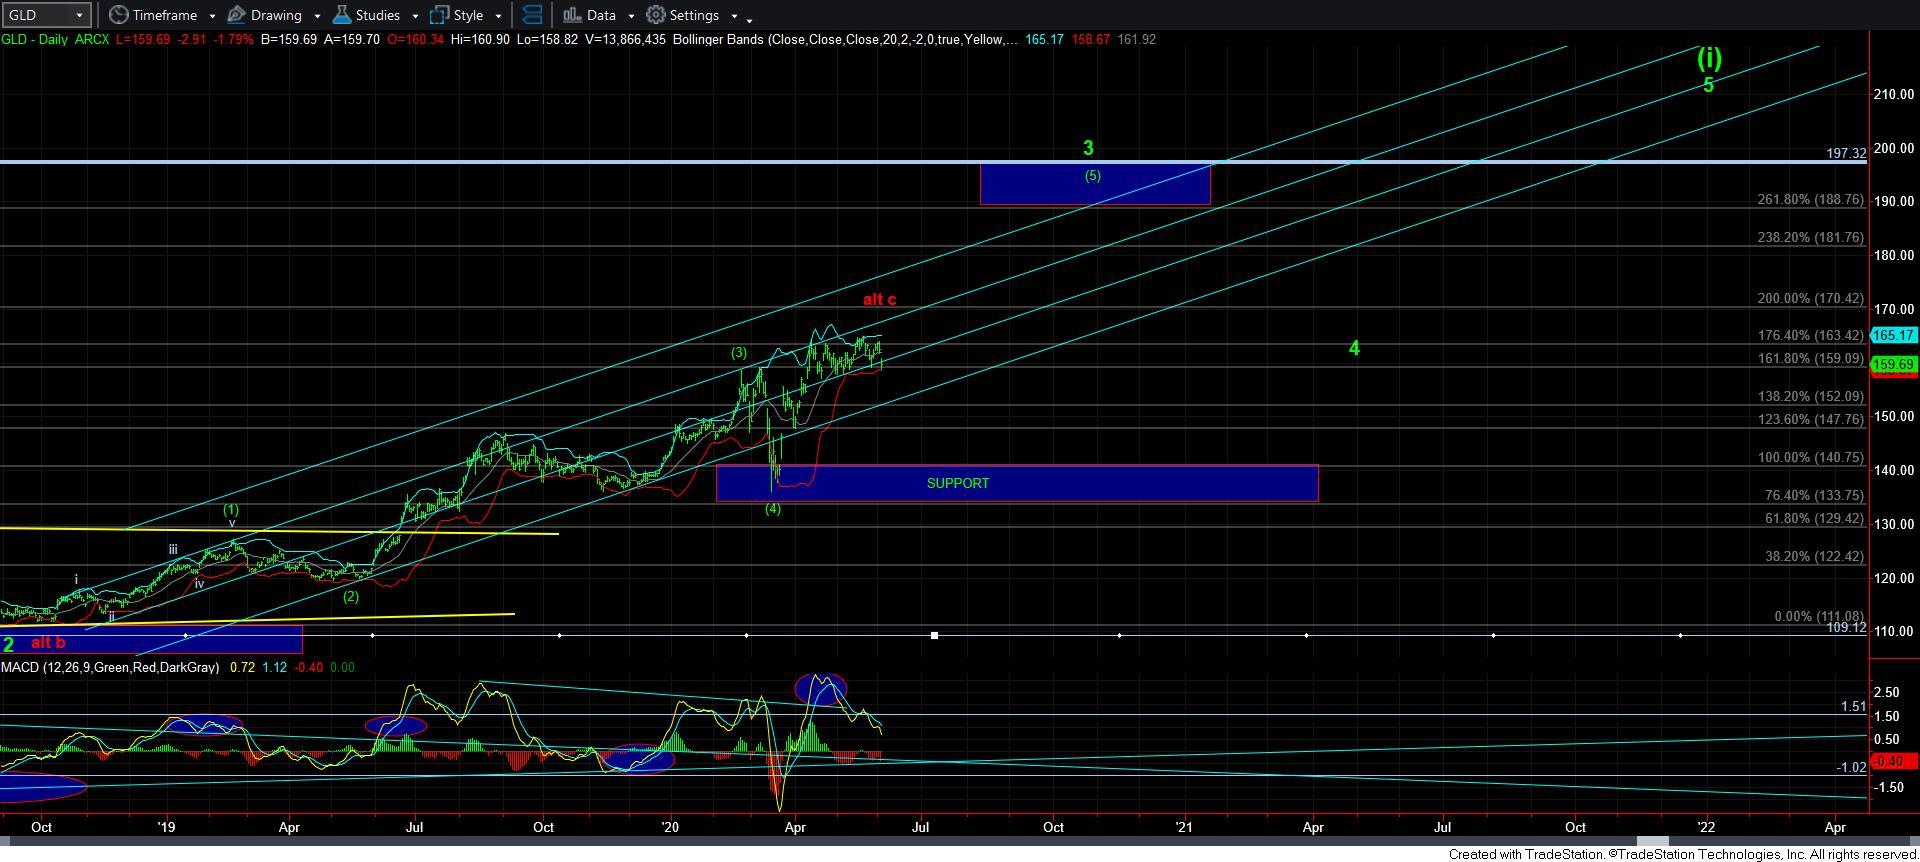
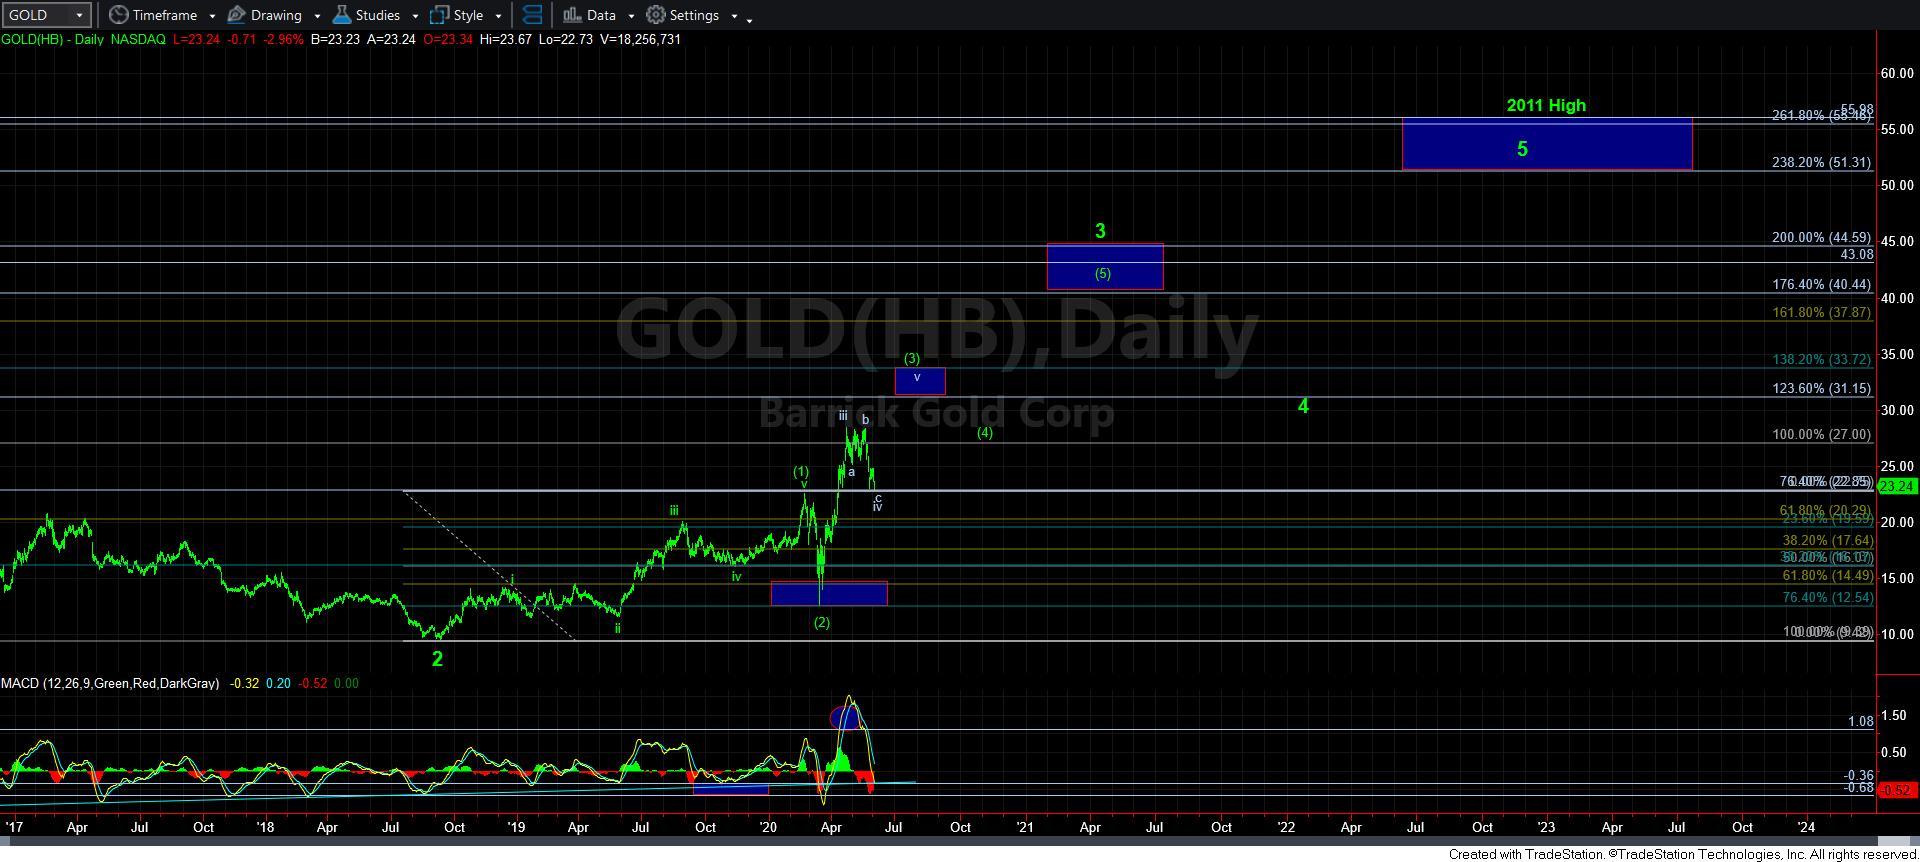
Now, for those of you asking about the individual miner charts, they support the same count presenting us in a wave iv pullback within wave 3. I have included the GOLD chart for this update for you to see. In fact, take note that the MACD is now as oversold as it has been at prior bottoms before rally’s took hold in the past.
So, as you can see, this is the same count I am maintaining in the GDX on the daily chart. As long as we hold the 30-31.50 ideal support for this pullback, then this is the count I am maintaining. Moreover, I am going to await the next 5-wave rally structure off support before I turn bullish again in the near term.
In the micro structure for GDX, as long as we hold the low we struck today, then there is some potential for a more expanded b-wave structure as shown in yellow on the 8-minute GDX chart. But, based upon the micro structure off the lows today, I am not seeing that as the higher probability at this time. Rather, I think we are heading more directly to the 30-31.50 region. But, if we see continued strength through 33.50, I would have to reconsider that larger b-wave structure. A follow through below today’s low will likely take us to our c-wave of wave iv target box below.
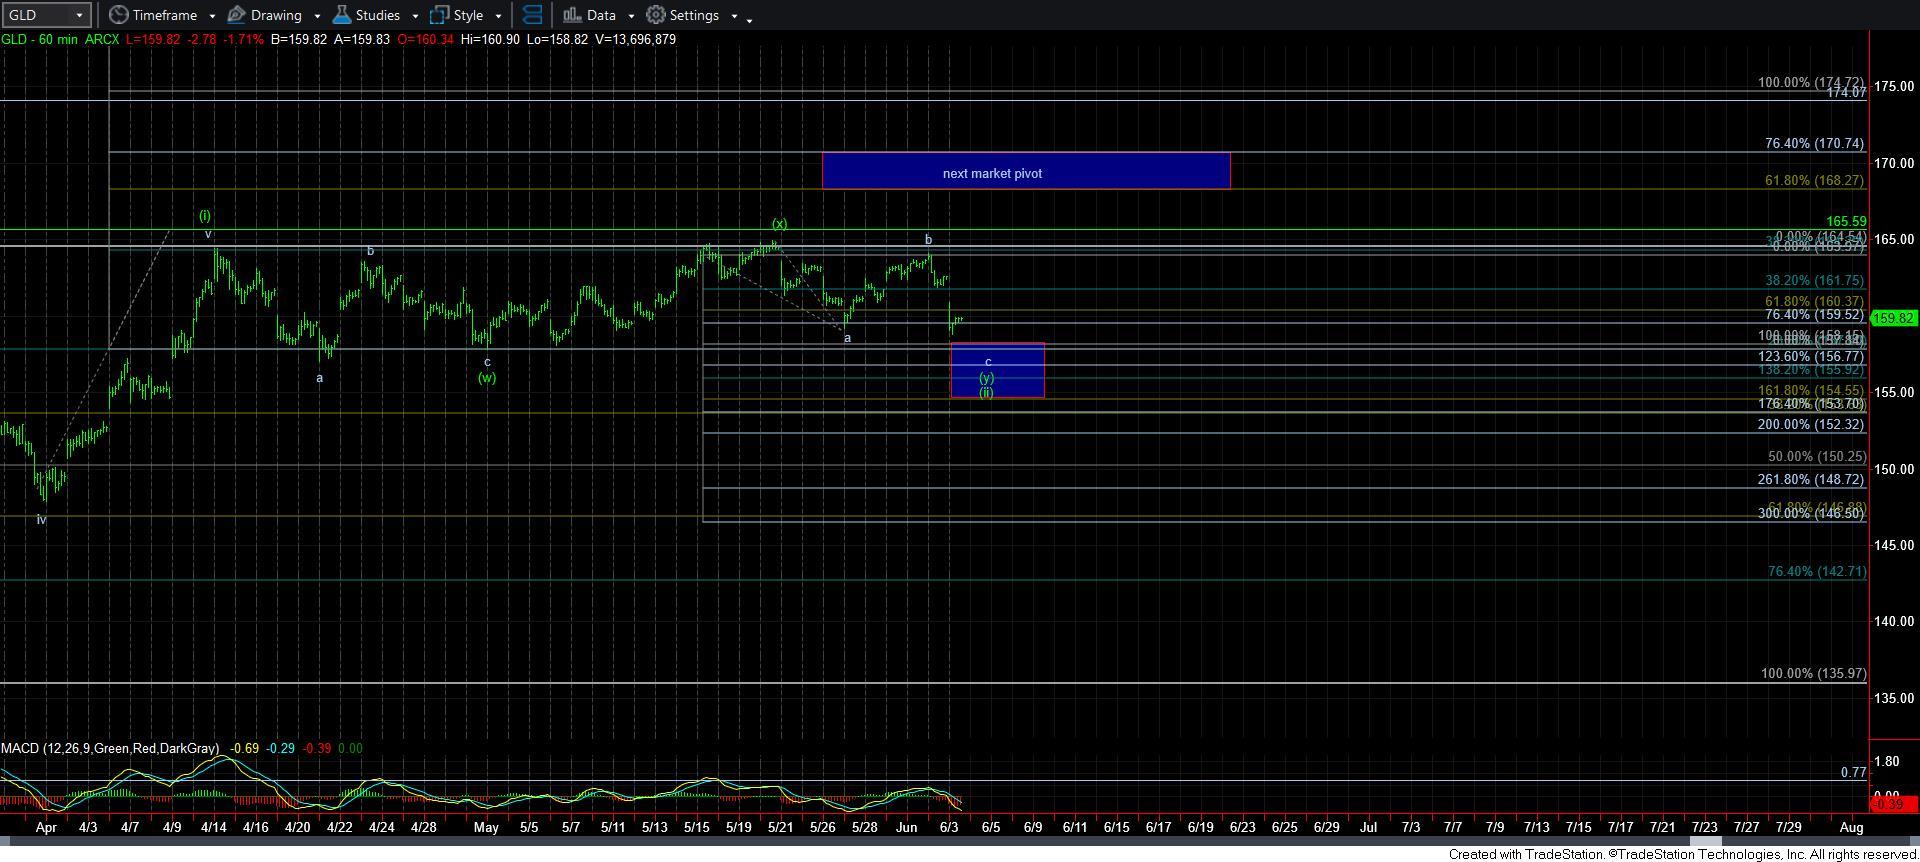
GLD is now finally providing us a more appropriate pullback for a wave [ii]. Keep in mind that I had wanted to see a drop to the 156-158 region for a more appropriate wave [ii], but the structure has turned out much more complex than I had initially expected.
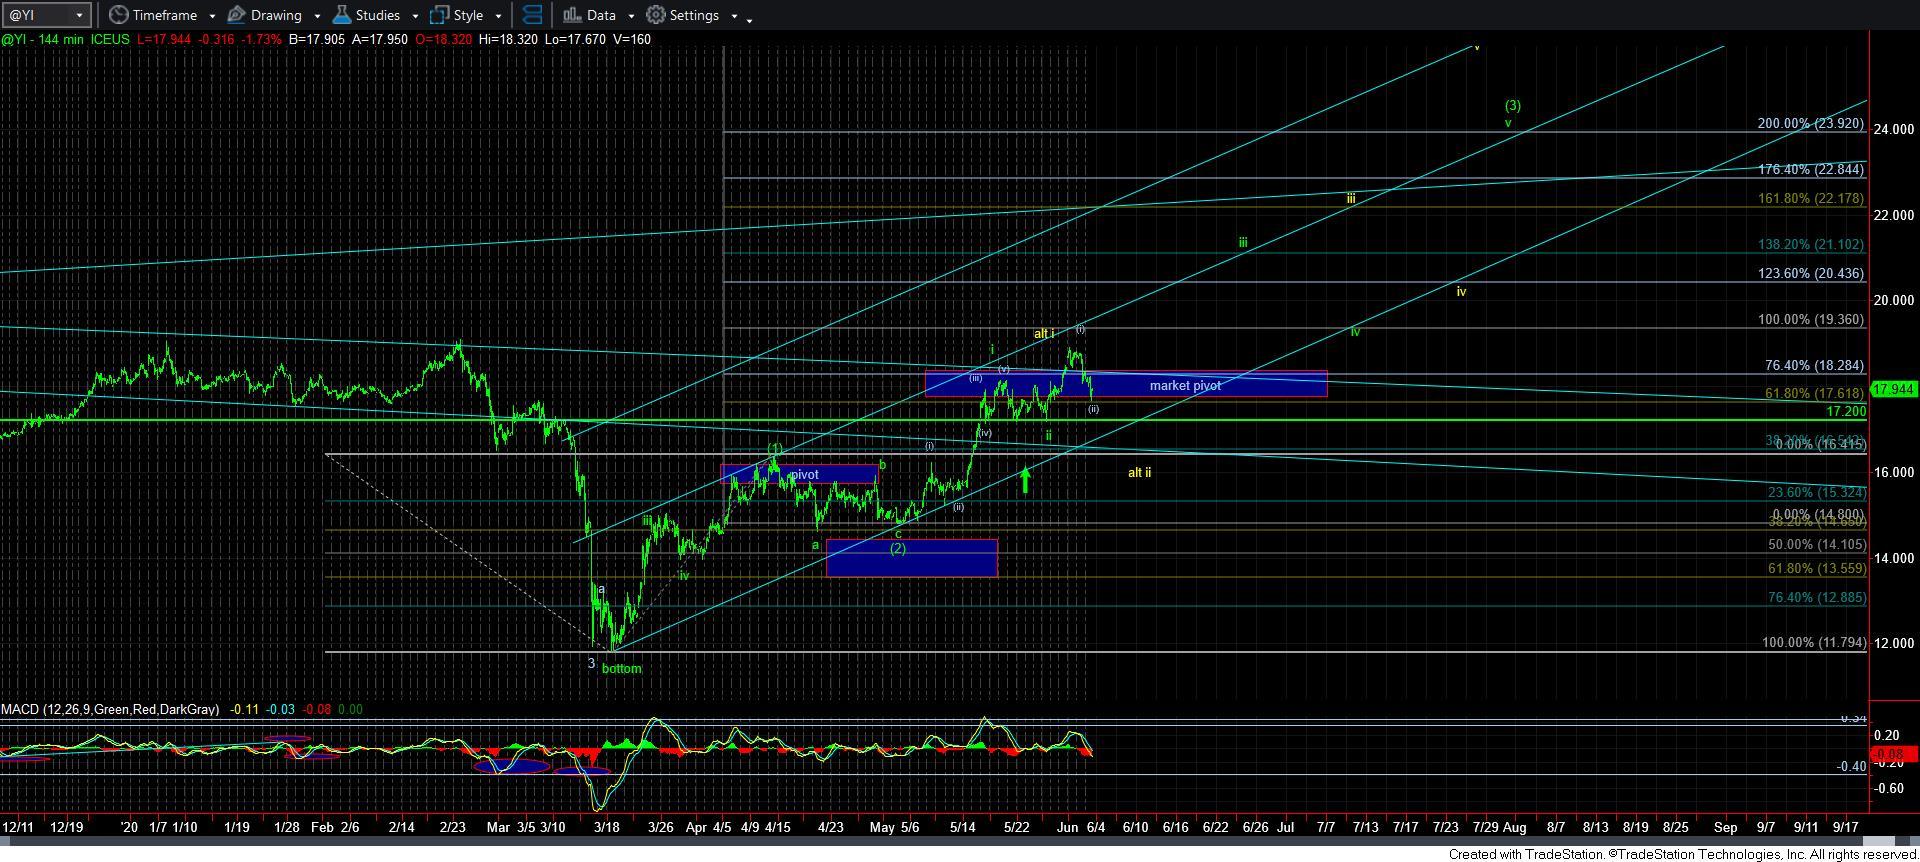
The one question I have is silver. It really has topped in a very unusual place. The most aggressively bullish count I have presented on the chart suggests that we should not break below 17.20, and see a strong break out over 19.40 to take us upwards in the heart of a 3rd wave.
Yet, we will need to begin that rally post haste to support that potential. But, the incomplete structures in GDX and GLD make me question that immediate potential.
So, I am going to provide my support levels to you. Clearly, the 17.20 region is important support for any immediate bullish potential. A break of that support will have me focus upon the 16-16.40 region for the alt i-ii in yellow. But, the problem with that count is that it is quite rare to see wave i of [3] top out just below the 1.00 extension of waves [1] and [2]. But, at the same time, it is hard to me to classify this entire rally as an a-b-c rally since we did not strike the 1.00 extension, and came up well short of that ideal target.
Ultimately, it means that silver is in an unusual posture and in between several potentials. But, if we break below the 16 support region, I have to then consider the potential that the rally off the lows is an a-b-c structure, with increased potential to spike below the low struck in March. Again, this is NOT my expectation, but if we do break below 16, it does make me consider this potential. For now, I retain a bullish bias in the larger degree structure.
So, in the near term, as long as we hold over 17.20, and can proceed through 19.40, I remain in the green count. However, if we break below 17.20, then we will need to see another 5-wave rally develop off the 16-16.40 region to get me near term bullish again, with the yellow count being applicable, with potentially higher extensions which can be seen, as you can see from the attached 144-minute chart.
Overall, my preference is to see a near term bottoming in the complex over the next week or so, with the next bullish set up developing off the lows I would like to see struck in the cited support regions noted above.