Metals Are Still A Bit Of A Question
Over the weekend, I said that it may take a week or two until the structures in the complex tipped their hand as to whether they have completed their perspective downside moves. And, I am still seeking a bit more evidence and confirmation.
Now, I have to begin by explaining that each of the three charts I am about to analyze are at different wave degrees. And, while that is not really an issue, it will cause a bit of complexity.
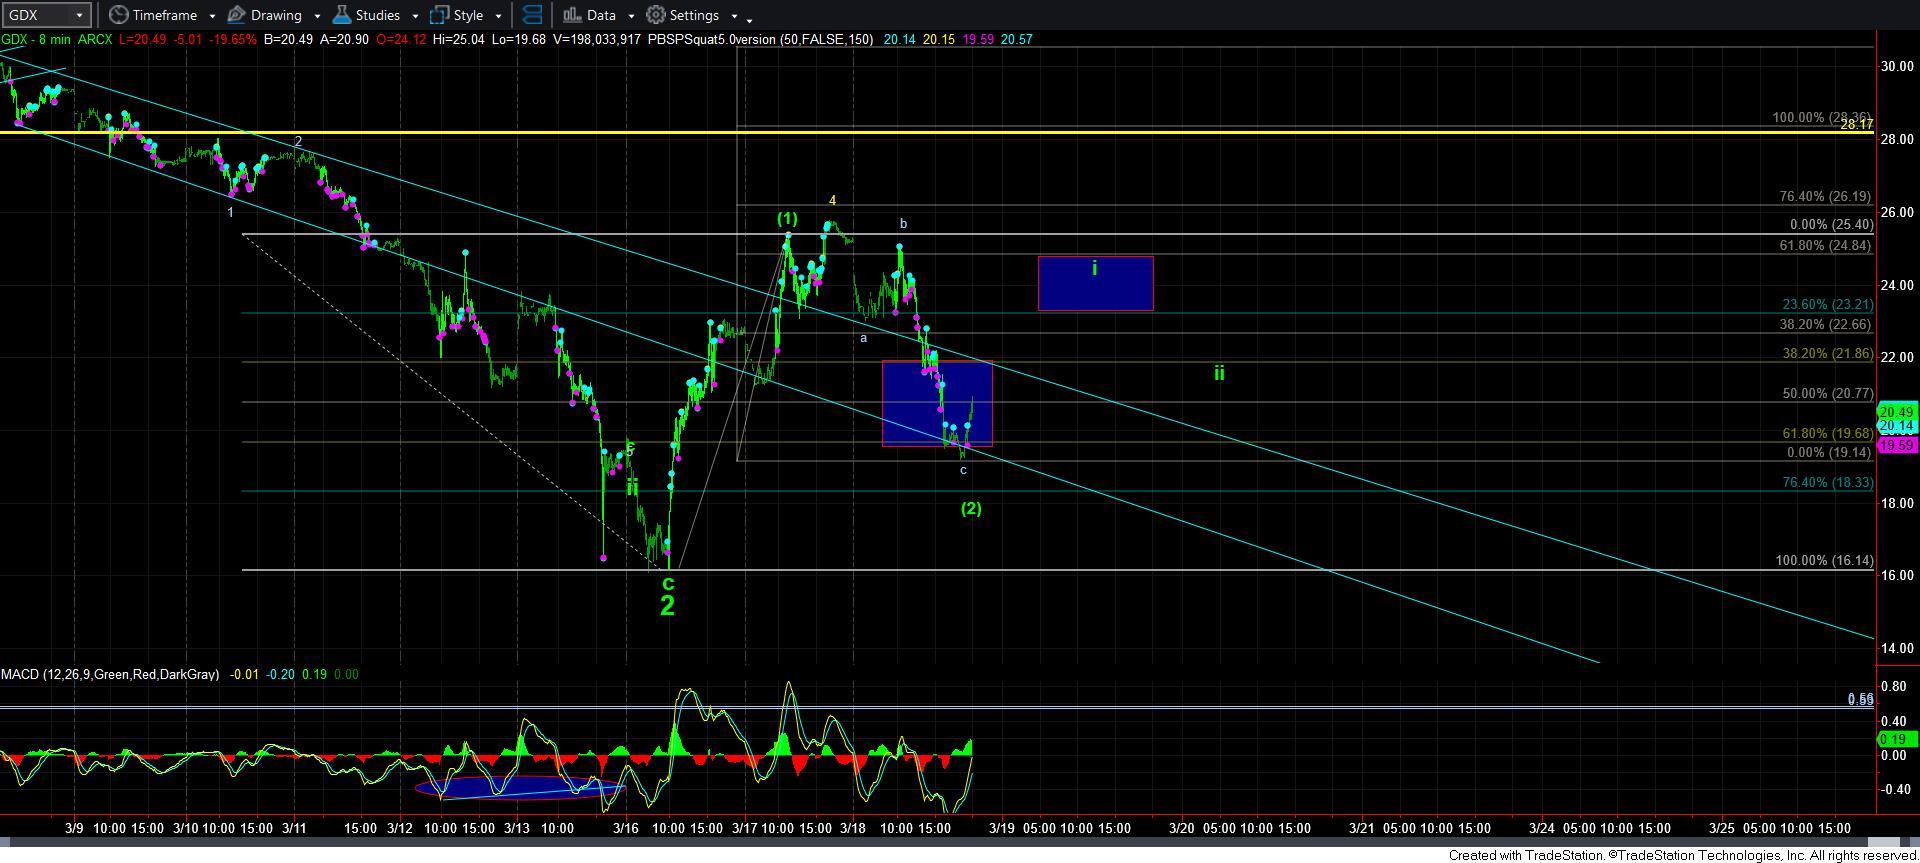
Starting with the GDX, we have seen a spike down into support, with a potential 5-wave rally off those lows having developed. And, as I outlined in an update I posted yesterday as we were approaching the 25.50 level in the GDX, we had enough waves in place to consider the rally as being 5 waves up off the lows. And, as long as the market respected the resistance box I provided, then I expected at least a wave [2] retracement, and possibly even a lower low in a 5th wave, as you can see from the attached 8-minute chart. In fact, I even noted that I was going to grab some lotto-type of hedges for the drop I was expecting.
As we know, the market topped out exactly at resistance, and has seen a nice turn down during the market hours. And, during that drop, I noted in the trading room that I was selling some of my lotto-type hedges. At this point in time, I have about 40% left for the potential that we see a lower low.
My preference was for the GDX to hold over the .618 retracement, with the market closing around the .500 retracement. but with the after-hours shenanigans we saw again, we have dropped directly to that .618 extension. So, whether this holds tomorrow I really cannot say.
If the market is able to hold this pullback low, then we have the potential to rally next to the next major test in the 28 region. You see, that region can still be a bigger corrective rally, setting up yet another c-wave back down into the 16 region. So, being able to exceed the 28.50 region is going to be very important if the bullish patterns are going to take off. And, if we can exceed that 28 region, then it will be pointing to the 40’s next.
However, if the market is not able to develop an impulsive move off the .618 retracement region, then we likely have a lower low sitting out there for the c-wave of 2.
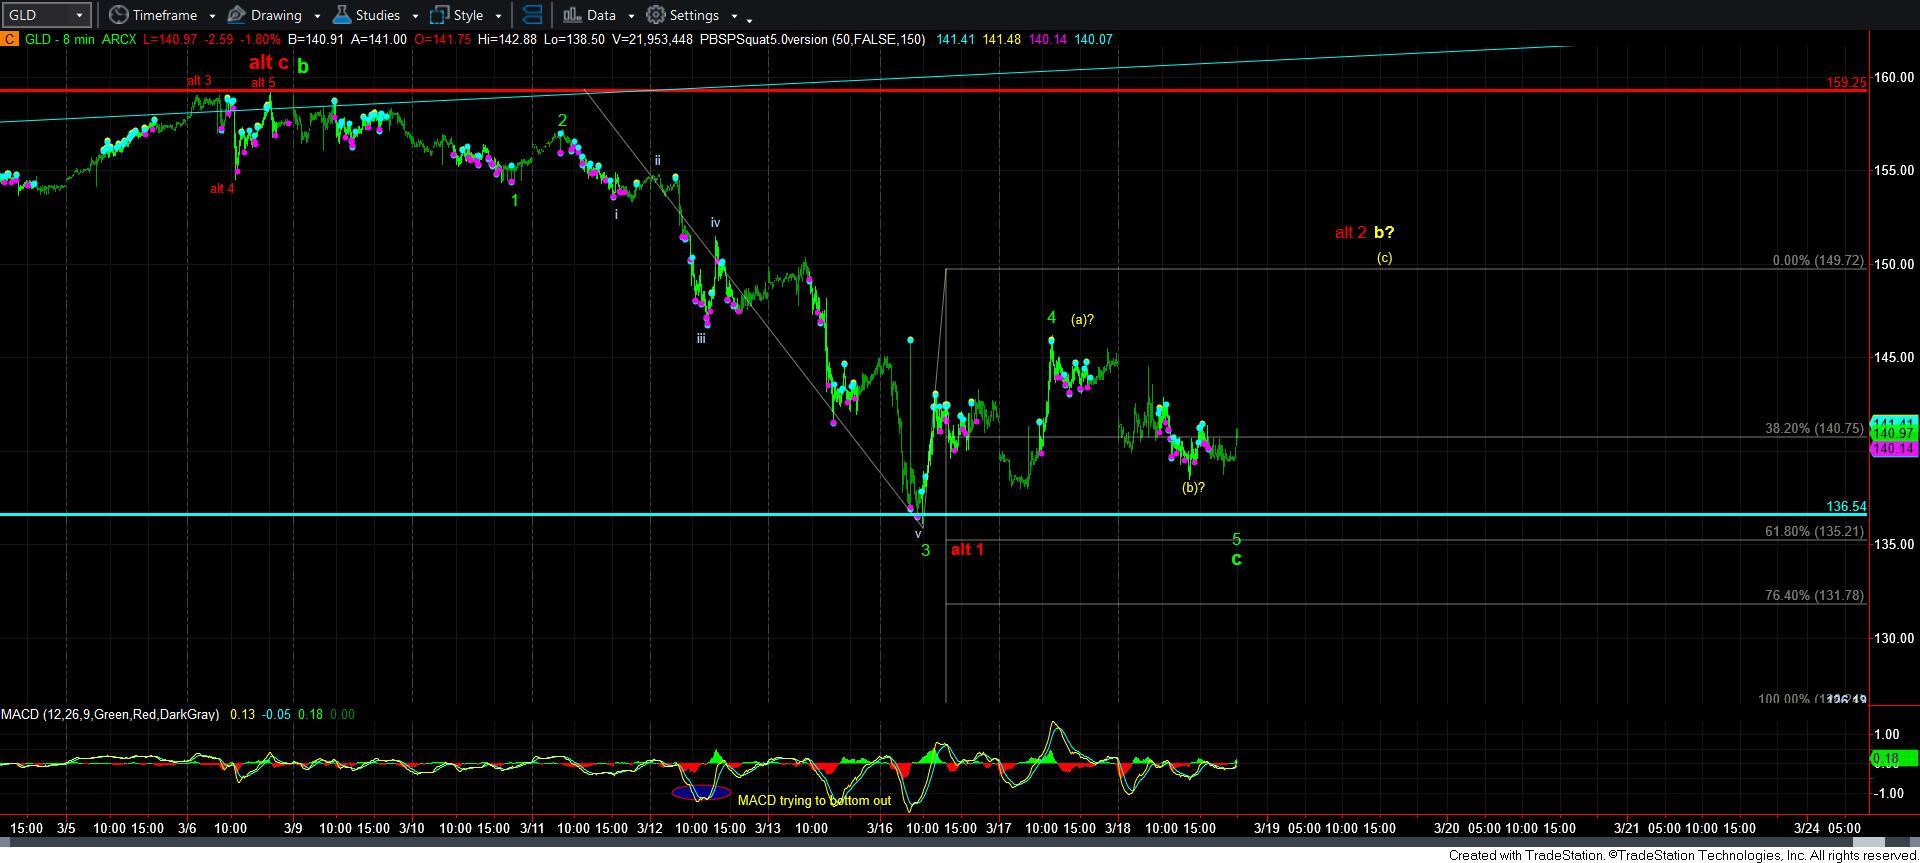
That now brings me to GLD. And, to be honest, this one is a bit of a micro-conundrum. The rally off the low struck on Monday is a rather clear 3-wave move. Therefore, it is either a wave 4 in the c-wave or we are about to continue rallying in a b-wave or a much more bearish wave 2 in red. However, if the market can drop just a bit lower, I may even consider a truncated 5th wave bottom to the c-wave. Yet, right now, I only have 3 waves down after the 3-wave rally. And, if the market continues higher in the [c] wave as outlined, then I would have no choice but to hedge my long positions with GLD puts as long as we remain below the 159 region. If that pattern does play out, then the minimal expectation I would have would be the 127/128 region in a yellow c-wave, with the red count taking us much lower than that.
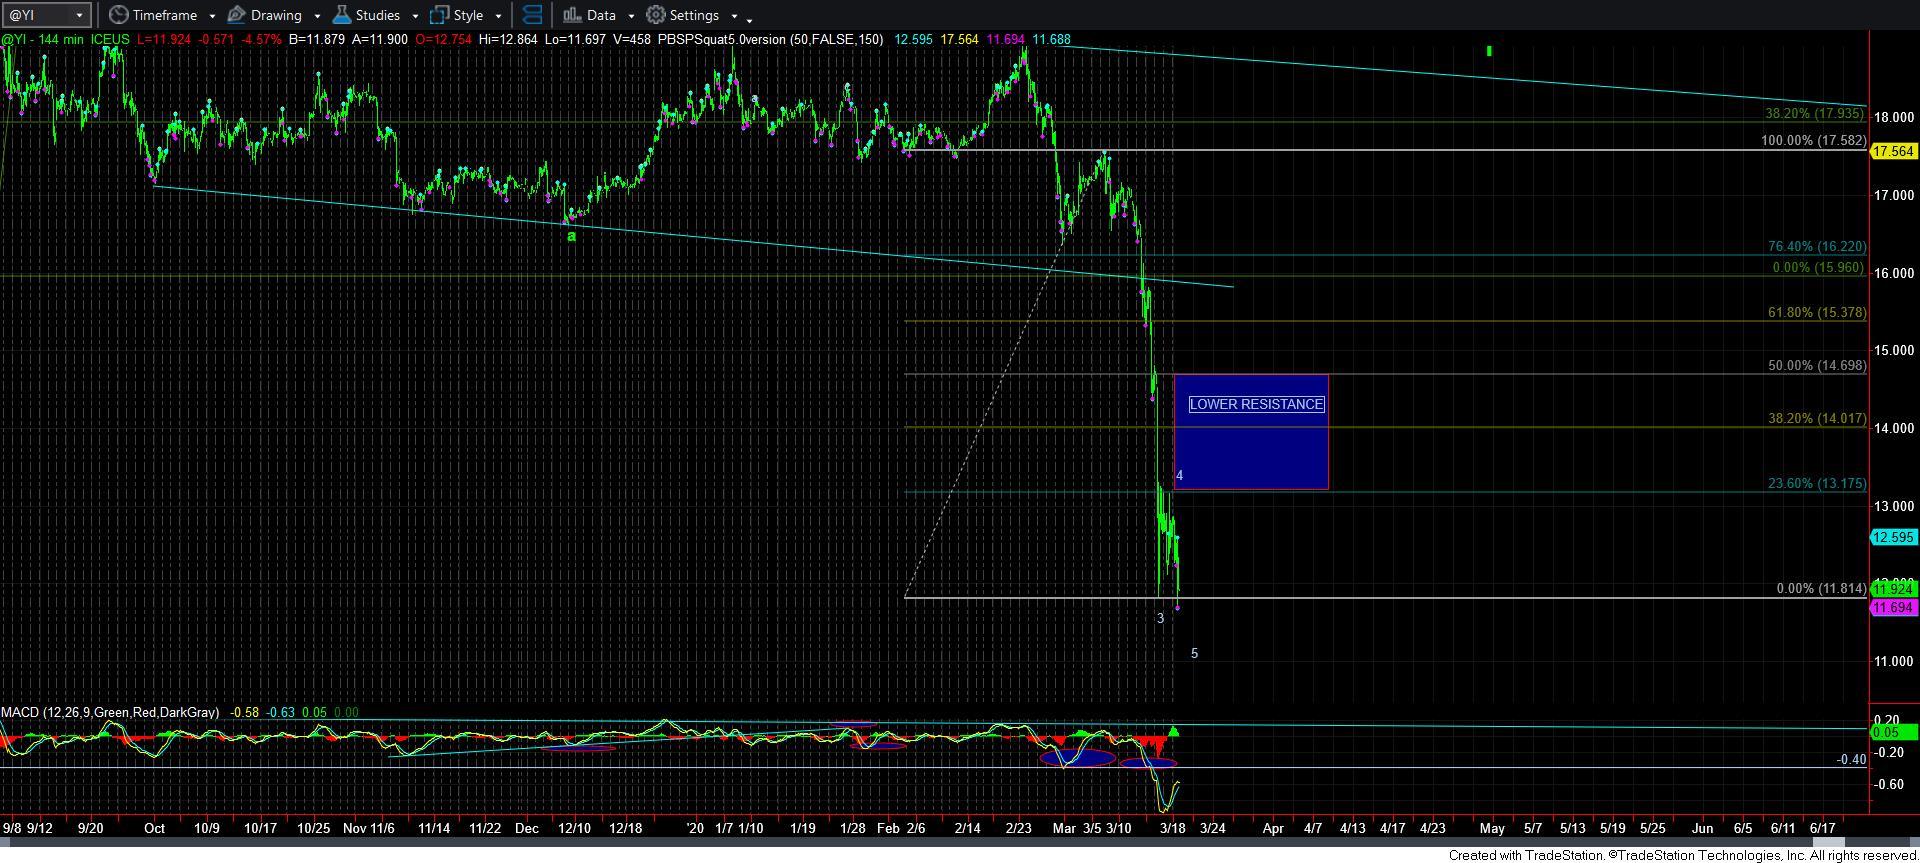
Now, we can move to everyone’s favorite – silver. Silver has made a lower low relative to 2015 and it seems we are now only completing the longer-term c-wave decline which began in 2011. I know that sounds absolutely amazing, but when silver broke below support last week, this was the inevitable conclusion.
The question now is if silver has bottomed?
Well, if you look at the 144-minute chart, you will clear see that we have that bottoming set up in the MACD. Yet, the question is if that lower low we struck today was all of the 5th wave we will see. And, I have a hard time thinking it is.
It is entirely within reason that the lower low was actually a b-wave in wave 4, setting up a c-wave into the resistance overhead. For now, I am viewing that as my primary count. However, I would quite glad to be proven wrong with an impulsive move through the resistance box.
So, as I said on the weekend, I am just not completely confident yet that silver has bottomed, but the set up is certainly in place. Moreover, GLD can prove a lot to us in the coming week if it can muster a i-ii break out as shown on the 8-minute chart. Yet, GLD is still meandering within a strong indication that this weakness has concluded.


