Metals Are Pushing The Envelope
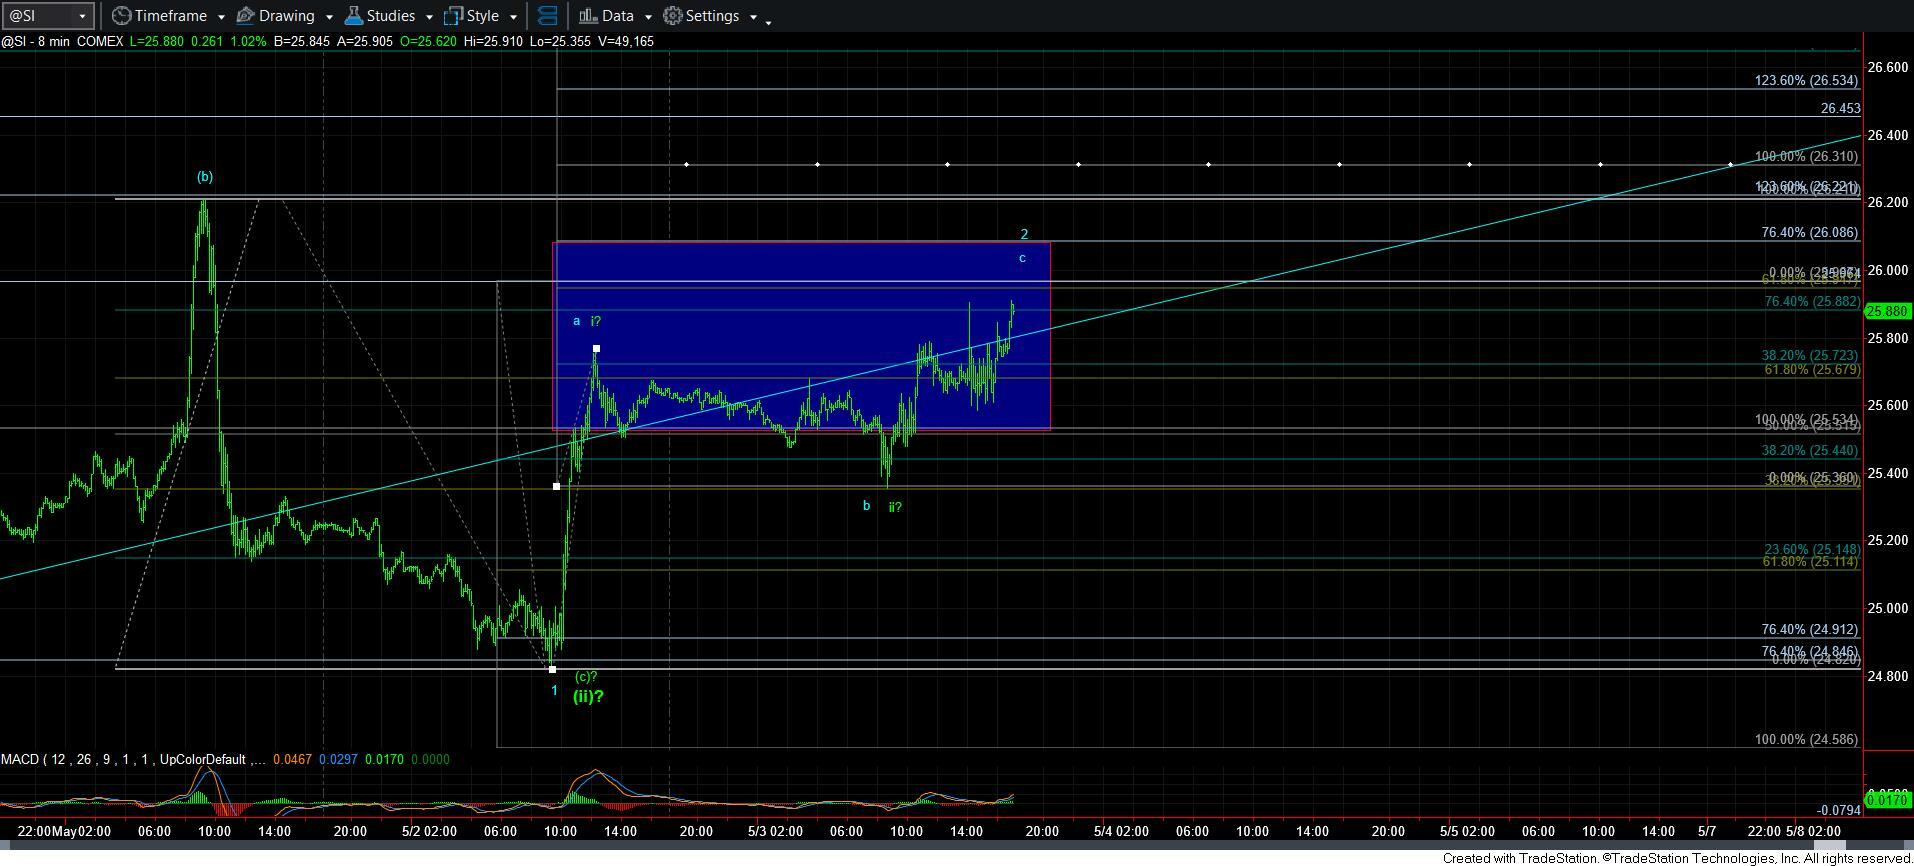
So, after putting you on HIGH ALERT as we were striking the bottom to the last drop yesterday morning, the metals are now pushing against resistance once again. The question is if they will be able to take out resistance sooner rather than later, or if we get the c-wave down before we begin the next rally we expect this year?
In starting with silver, which is the main reason I put you on HIGH ALERT, it is now pushing against the .764 retracement of the decline we began on Monday. As I explained in the live video this morning, both the options on silver are very reasonable interpretations. You see, the decline we experienced on Monday and Tuesday count best as a 5-wave decline. Either that is the [c] wave of the green wave [ii] (with the question mark), or it is just wave 1 of a deeper [c] wave decline in the blue count. Again, both are very reasonable interpretations, with the green count suggesting we see a break out in the heart of a 3rd wave sooner rather than later, whereas the blue count suggests we get more of a 2nd wave pullback.
The initial rally off the Tuesday low can also be considered a 5-wave rally, which still leaves both options open, as we can classify them as either wave i in green, or the a-wave of an a-b-c wave 2 in blue. The rally which began today has certainly left a lot to be desired from an impulsive structure standpoint. It looks more like a diagonal.
So, due to the additional move higher we experienced today in silver, I have to modify a few things from my discussion in the live video.
First, I am slightly modifying my resistance for wave 2 in blue to the point at which the c-wave would be equal to .764 the size of the a-wave, which makes the upper end of our resistance for a potential 1-2 downside structure the 26.10 region. If the market holds that resistance, and then breaks down below today’s low, that confirms the wave 3 down in the blue [c] wave.
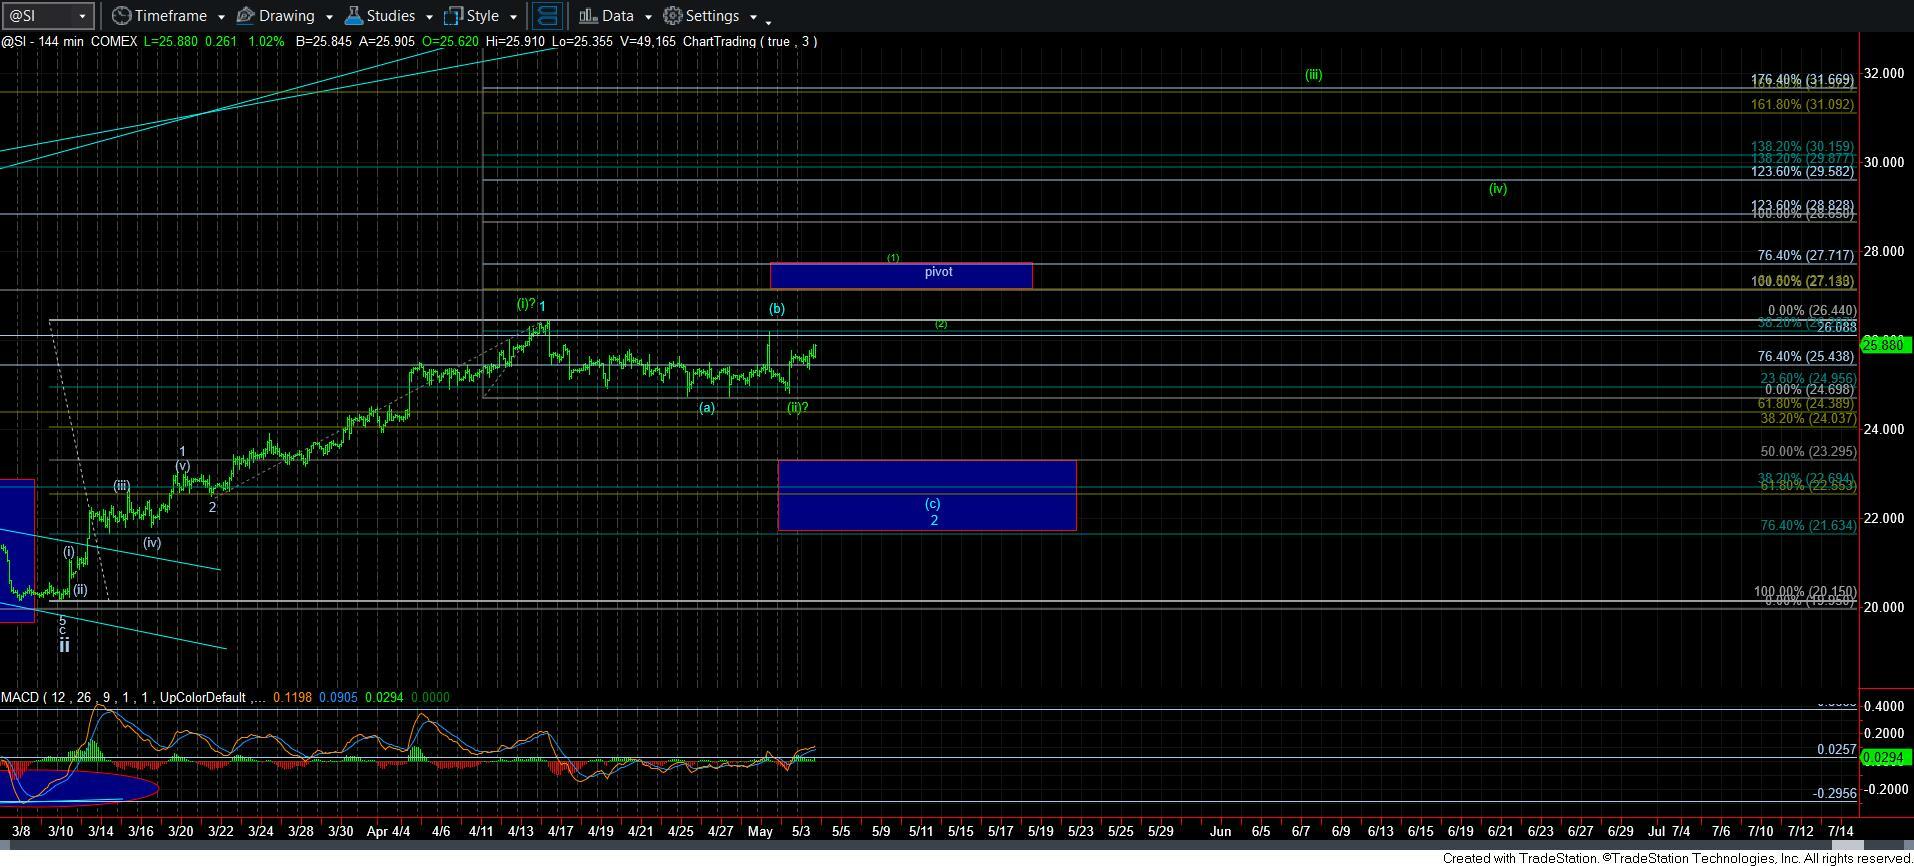
The second modification I have to make is the target for the blue [c] wave. My initial expectation was that we could drop to the bottom half of the support box on the 144-minute chart. However, due to the higher than expected potential blue wave 2, the downside target for the [c] wave is more likely in the 22.30-23.20 region, which is more in line with the top half of the support box. Should we see a break down, then we can better gauge which is the better target for this [c] wave decline.
However, if we are able to take out the blue wave 2 resistance, and then break out over the [b] wave high, then I have to assume that we are in the green count, and heading to the top of the overhead pivot noted on the 144-minute silver chart to complete wave [1] of wave [iii]. I would then think we would come back and test the break out point from above in a wave [2] pullback, thereafter beginning a strong rally pointing us north of 31 and starting the heart of a 3rd wave in earnest.
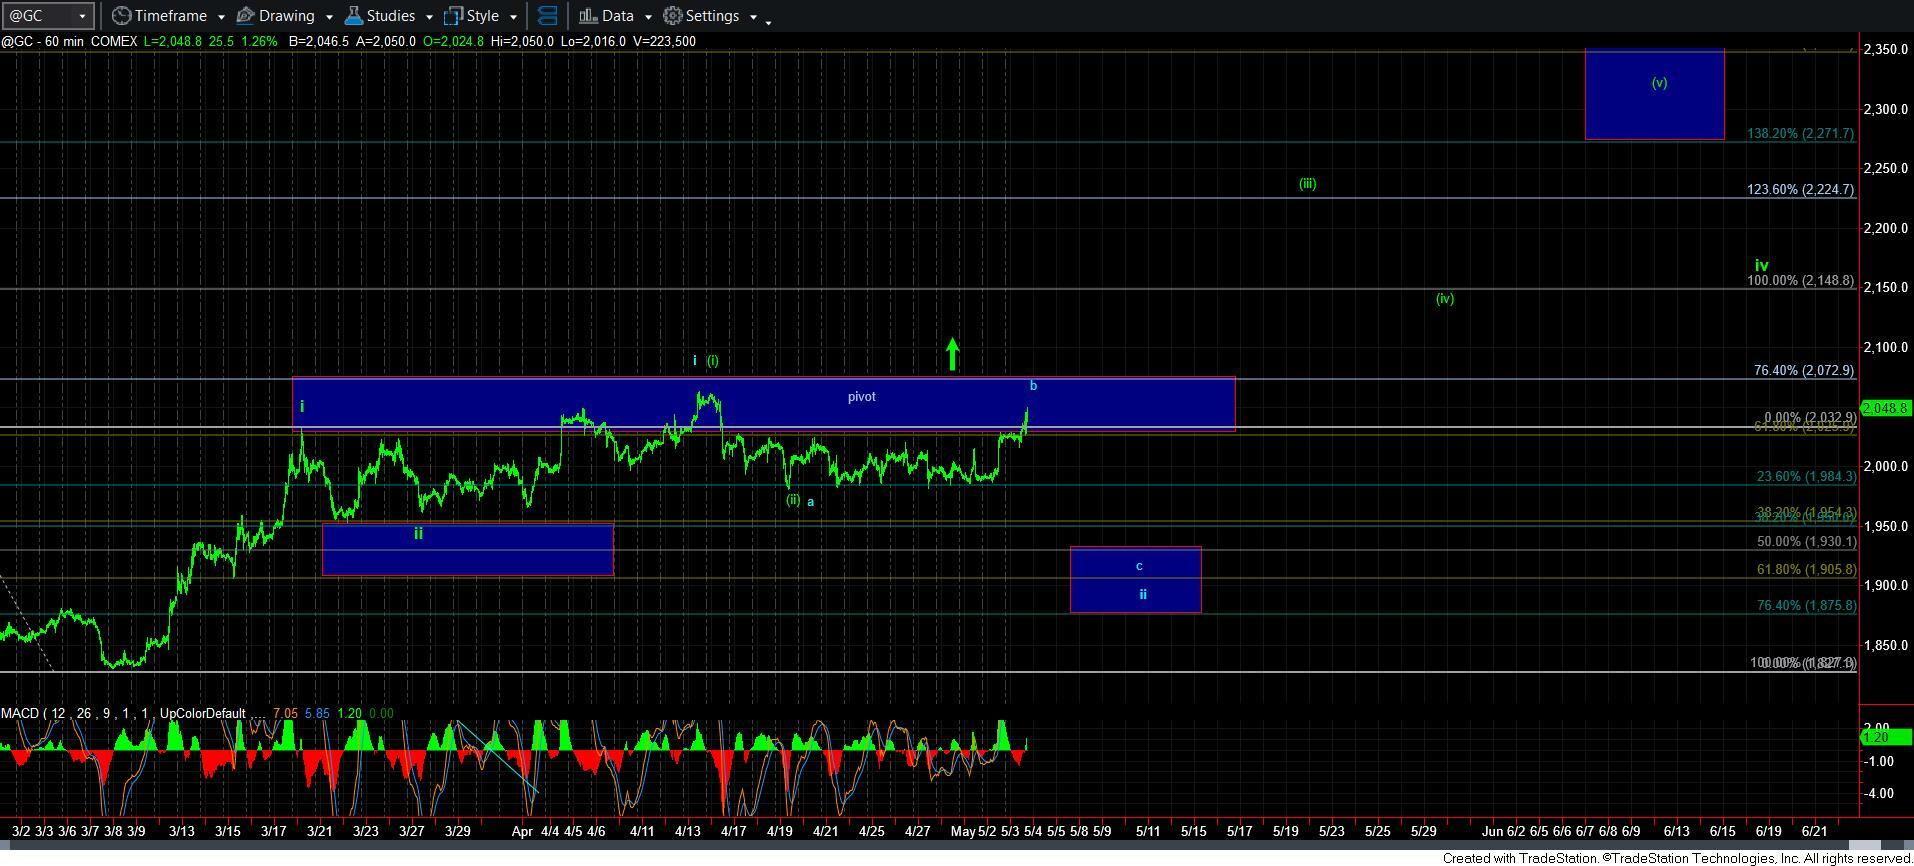
As far as gold is concerned, should silver see a break out, and GC break out over its pivot, then I have to also assume that gold is breaking out in the heart of its 3rd wave a bit sooner than I have initially expected as well.
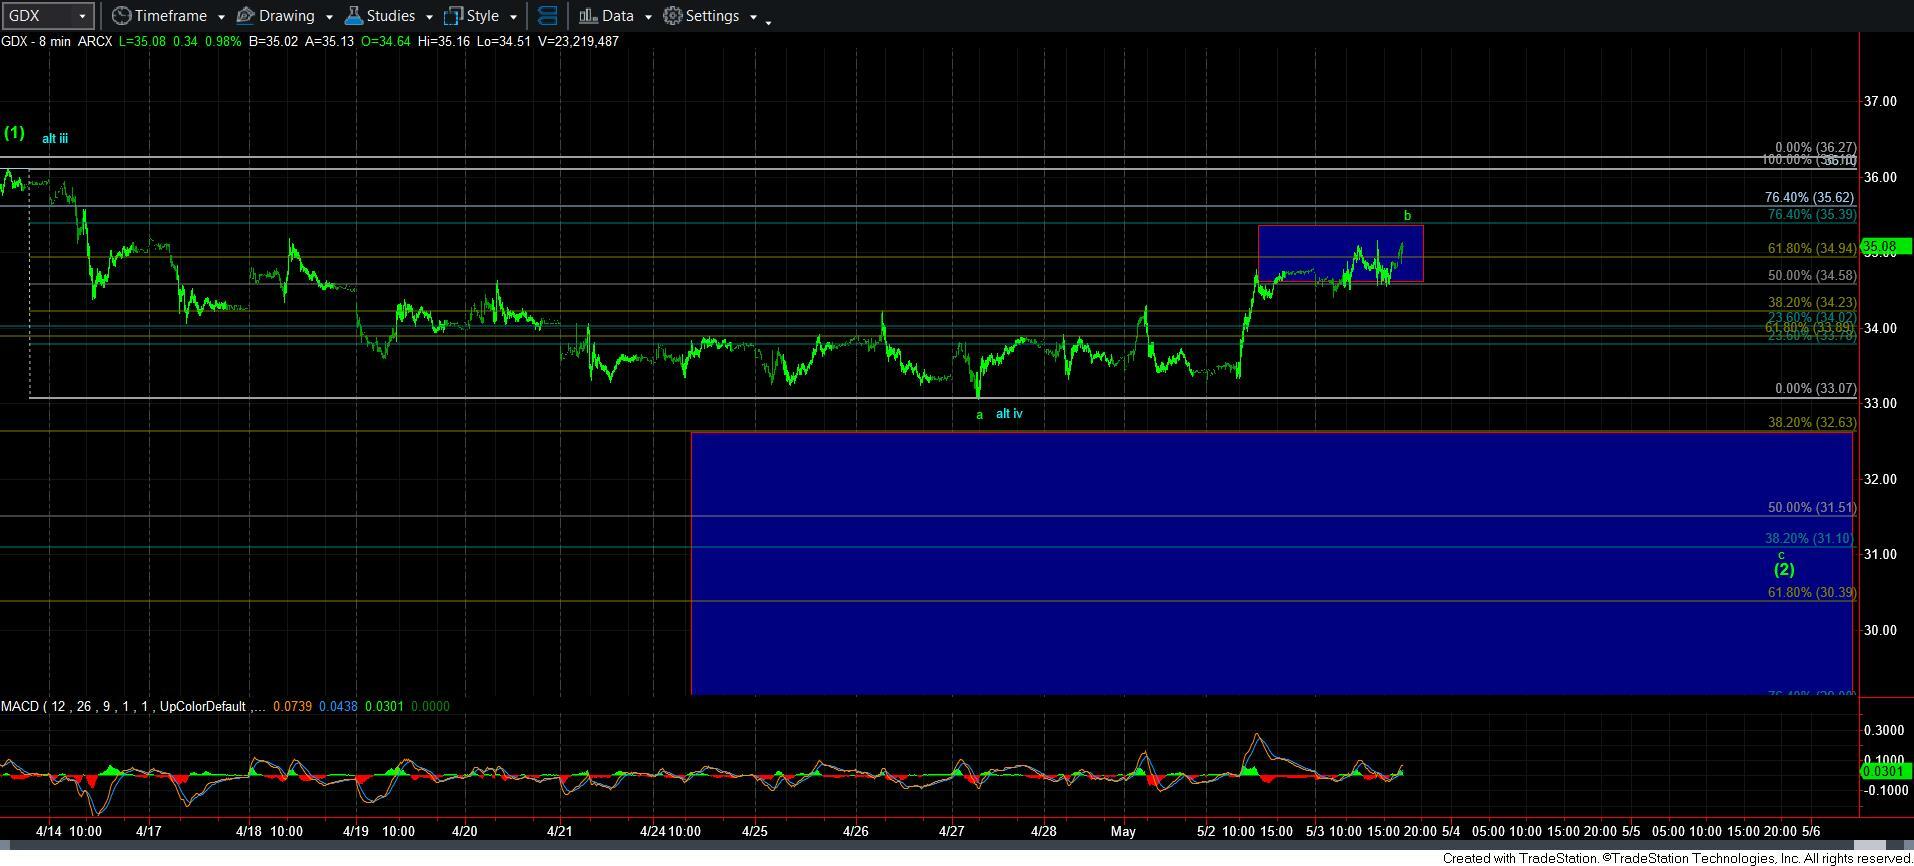
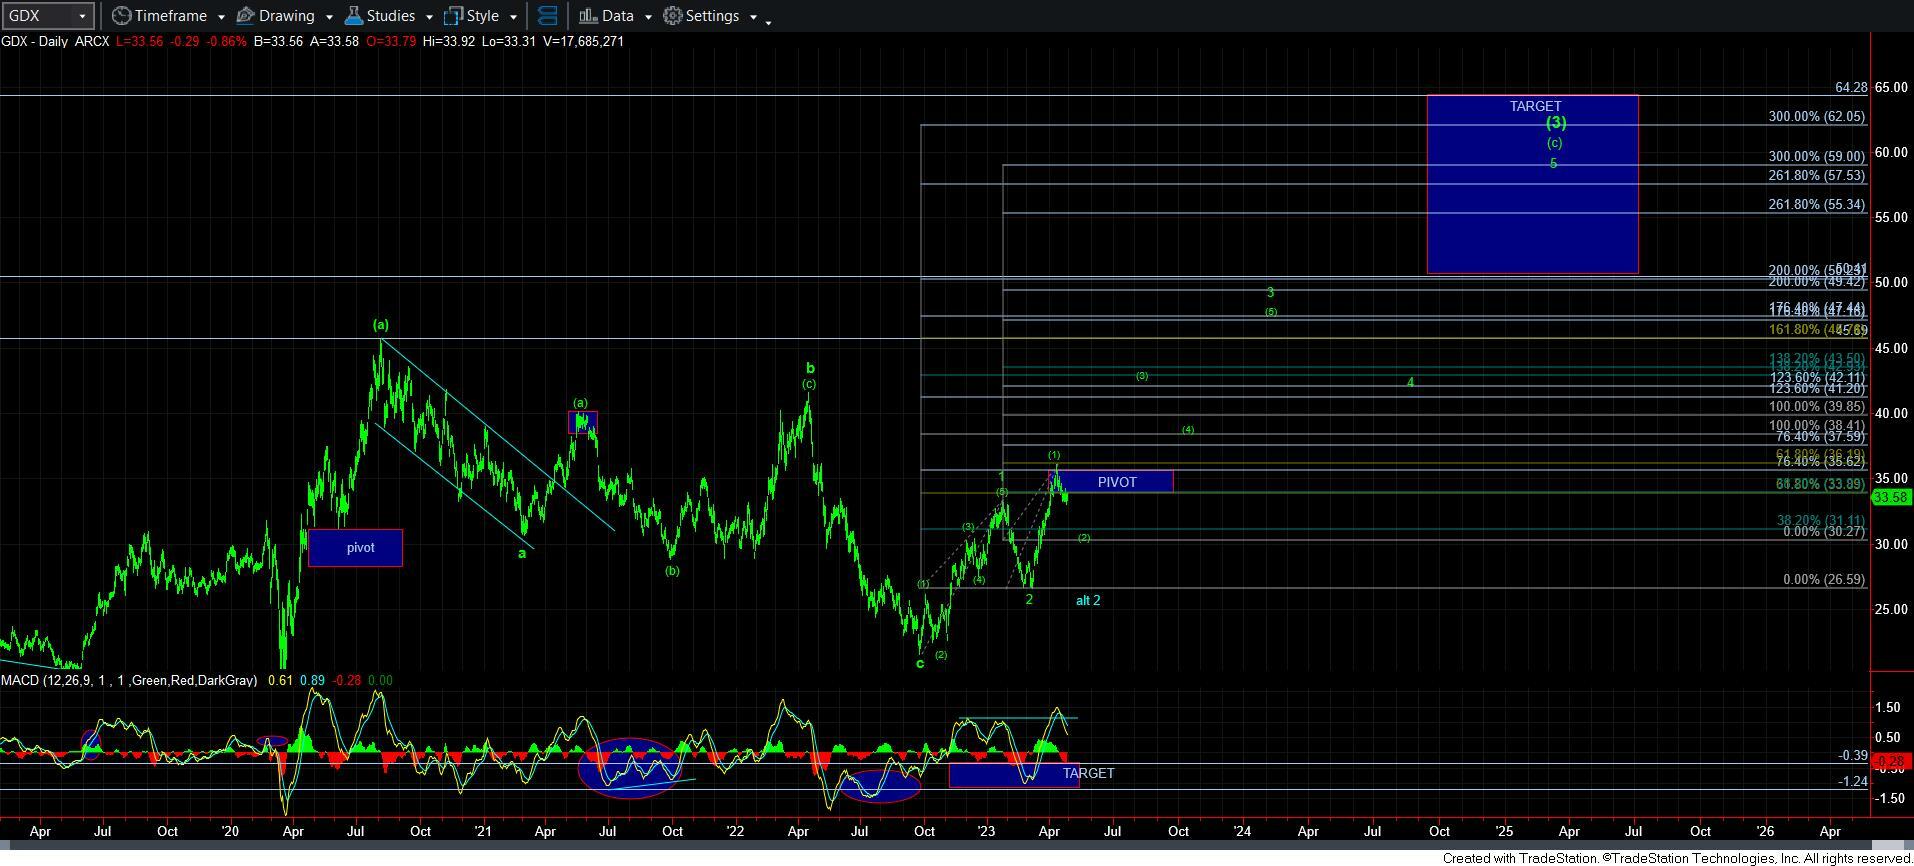
But, I have to add that GDX really counts best as setting up for a c-wave down. Yet, clearly, if we take out the recent high, I have to change perspectives, and would view us as in wave v of [3], which would likely target the 41 region.
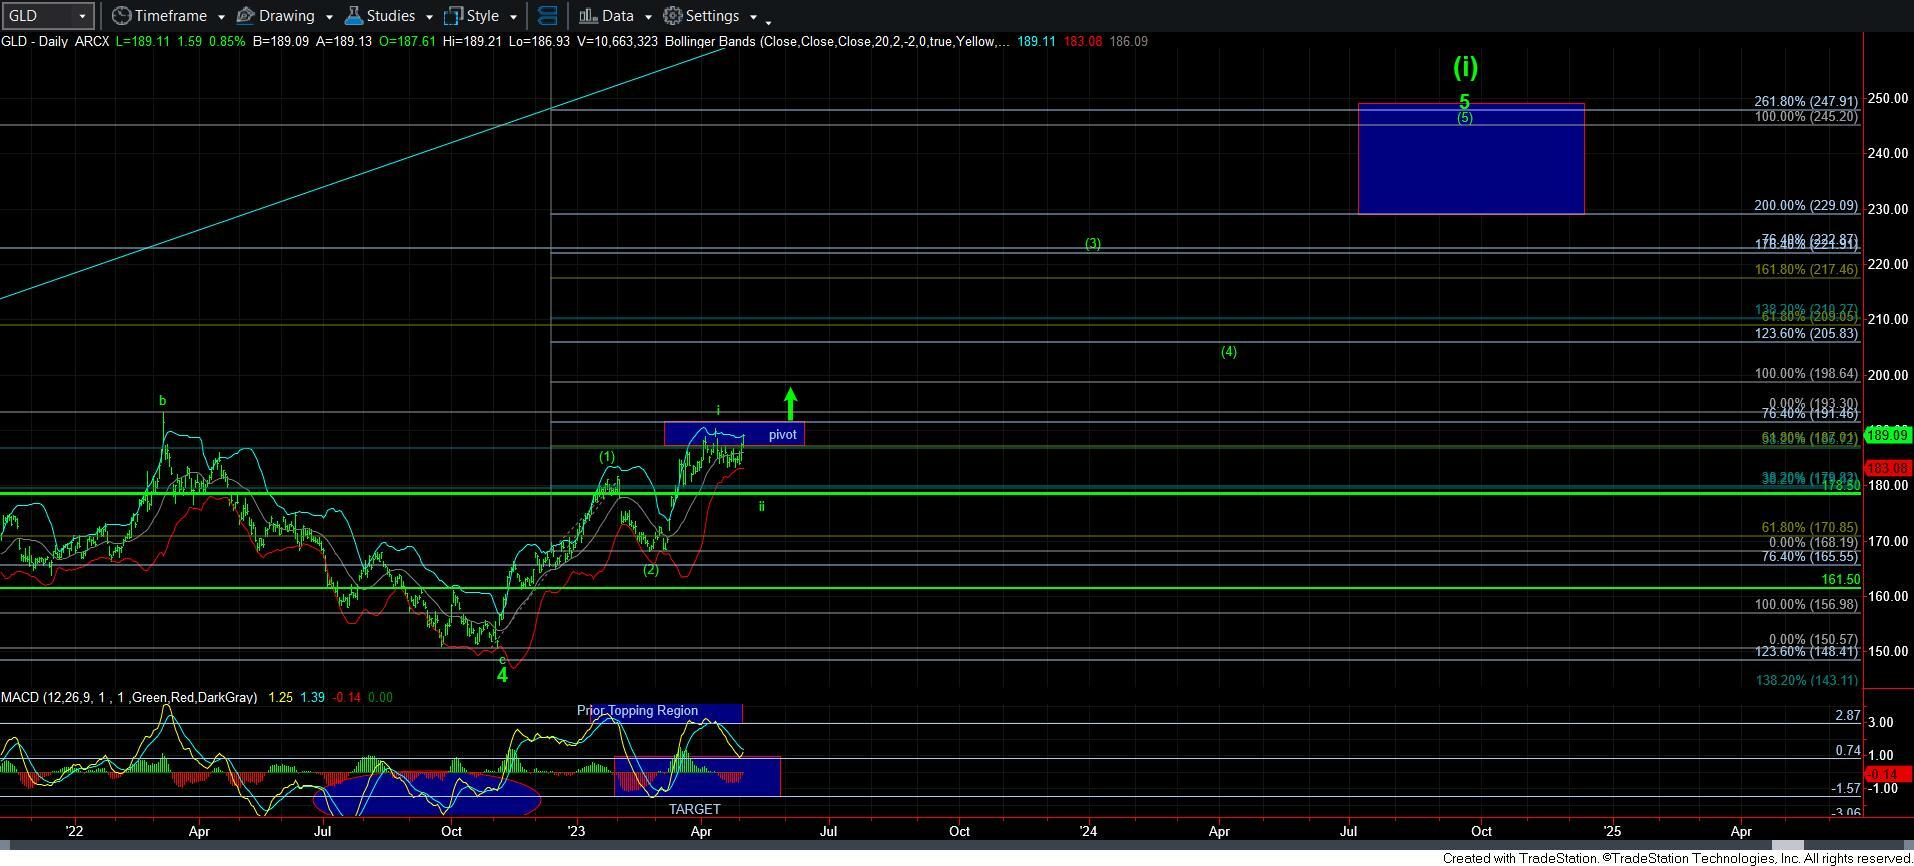
As we expected 2023 to be a strong year for the metals complex, I am still very much of that opinion. The only question we were trying to resolve is if we see more of a 2nd wave pullback across the board before the heart of a 3rd wave begins in earnest. Yet, silver MAY be leading us up and out sooner than I had initially expected, and will likely give us strong direction over the next few days.