Metals Are Certainly Trying
 By
Avi Gilburt
By
Avi Gilburt
While the metals have certainly provided us with a nice pullback thus far, I do not yet have enough evidence to strongly suggest that the pullback is complete and a 3rd wave rally has yet begun.
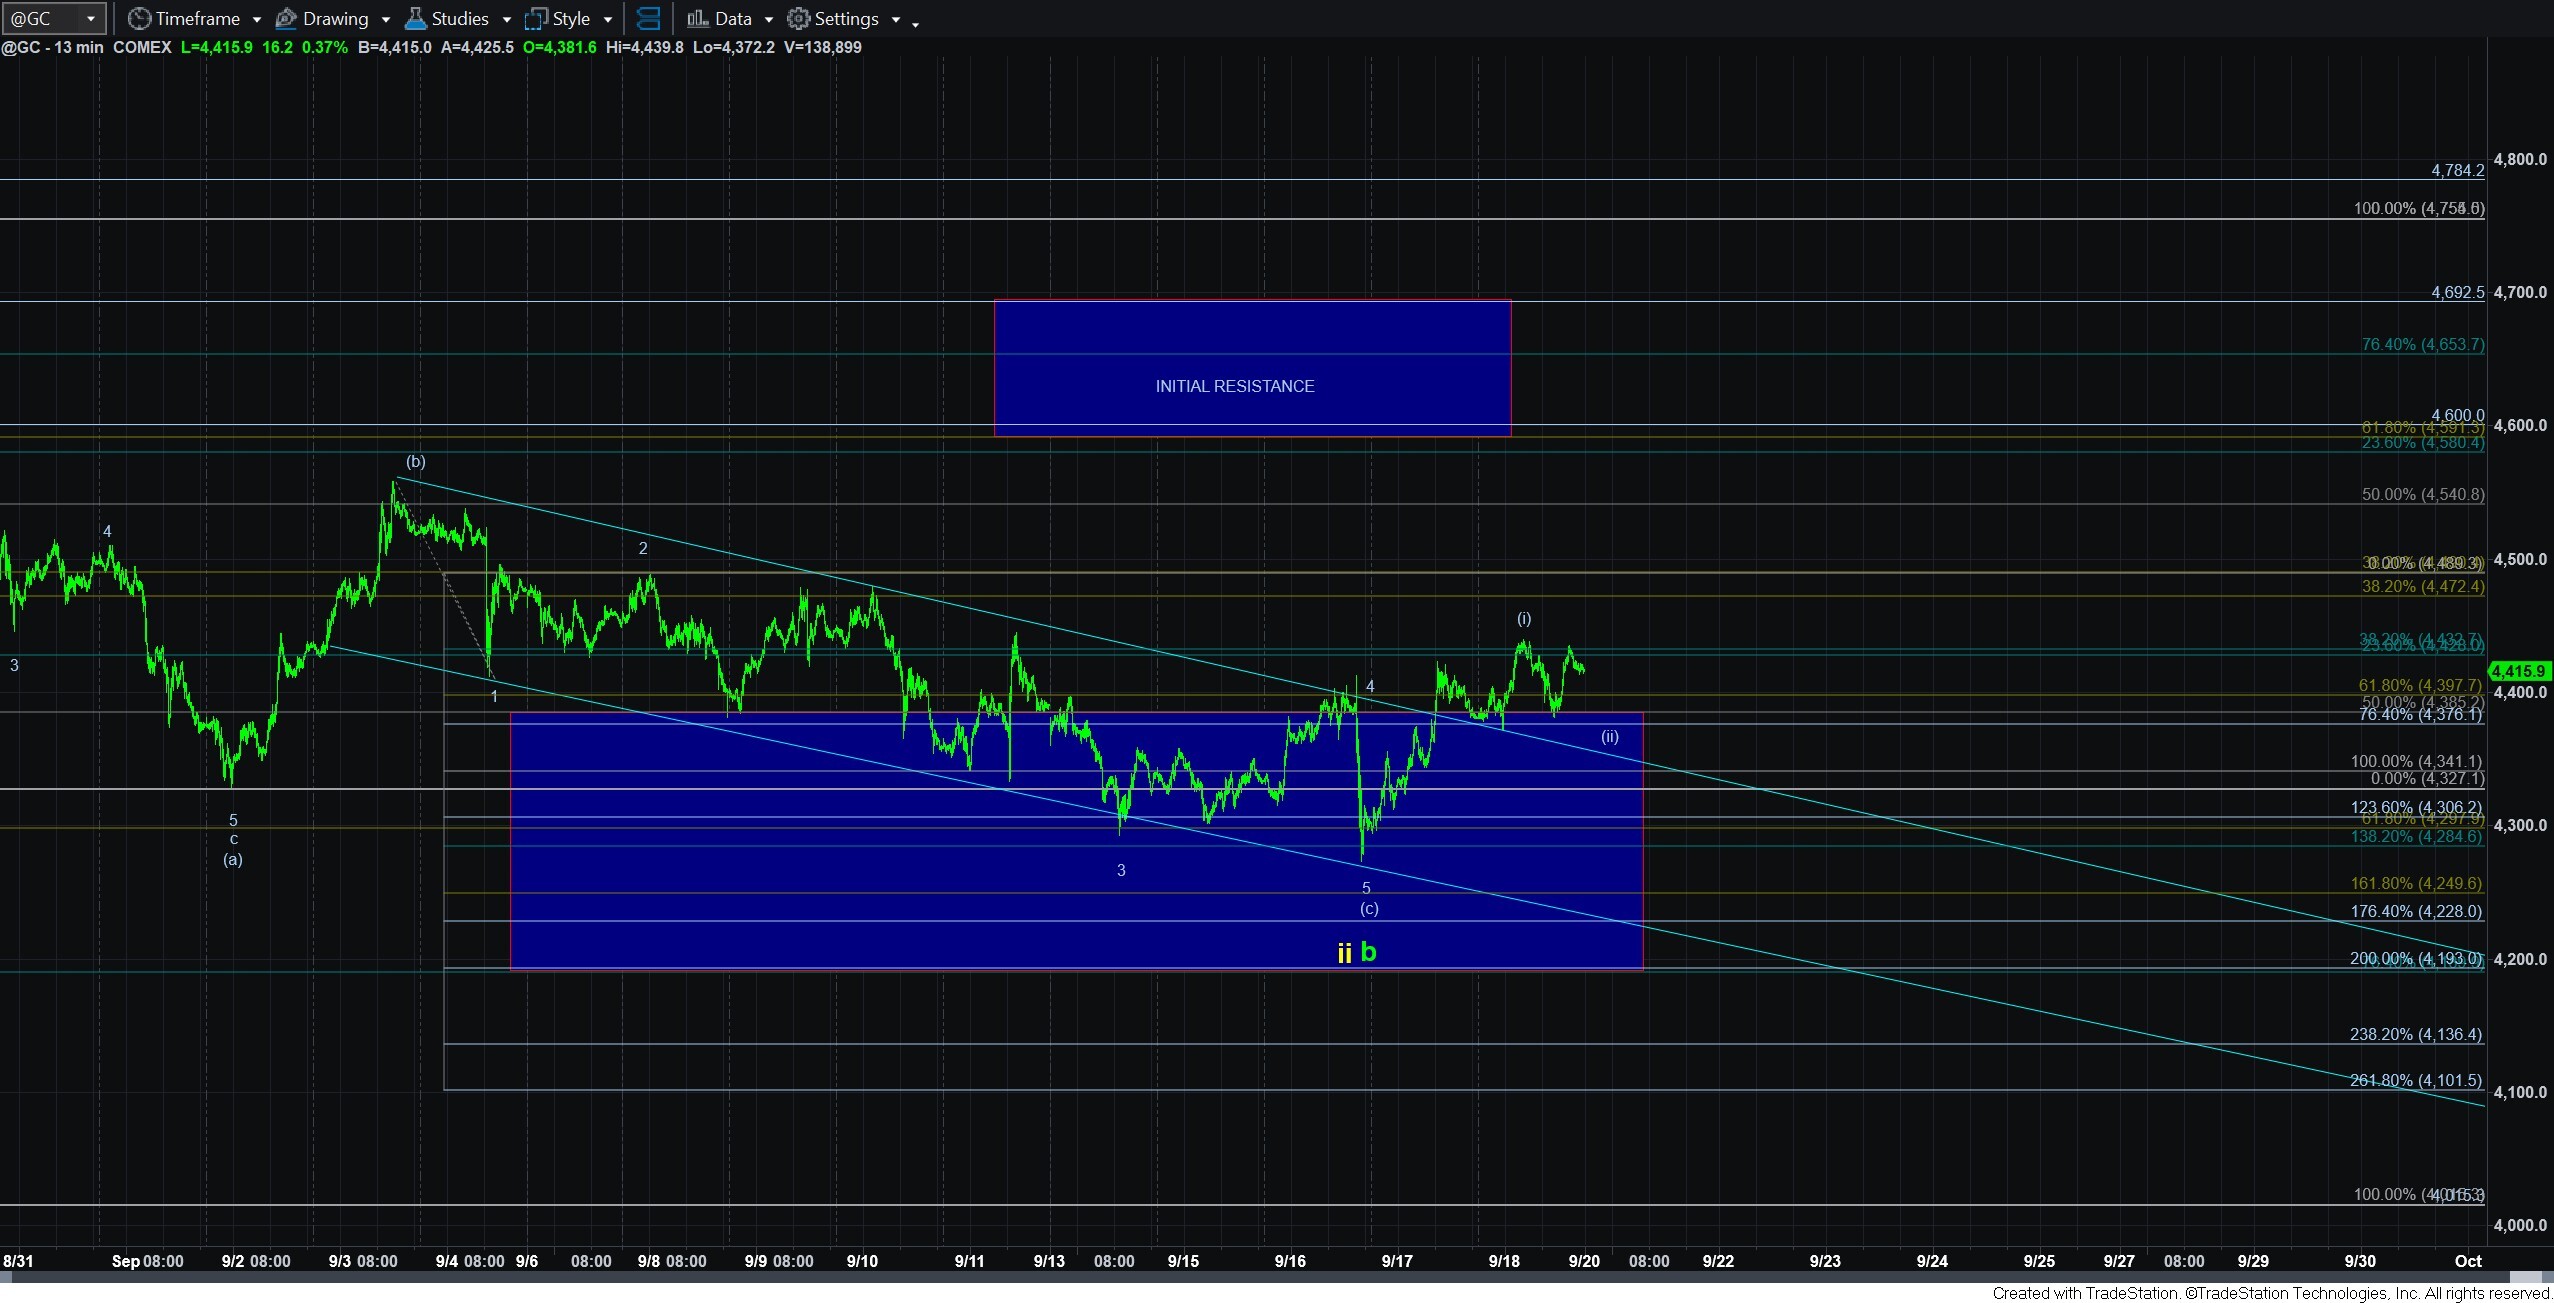
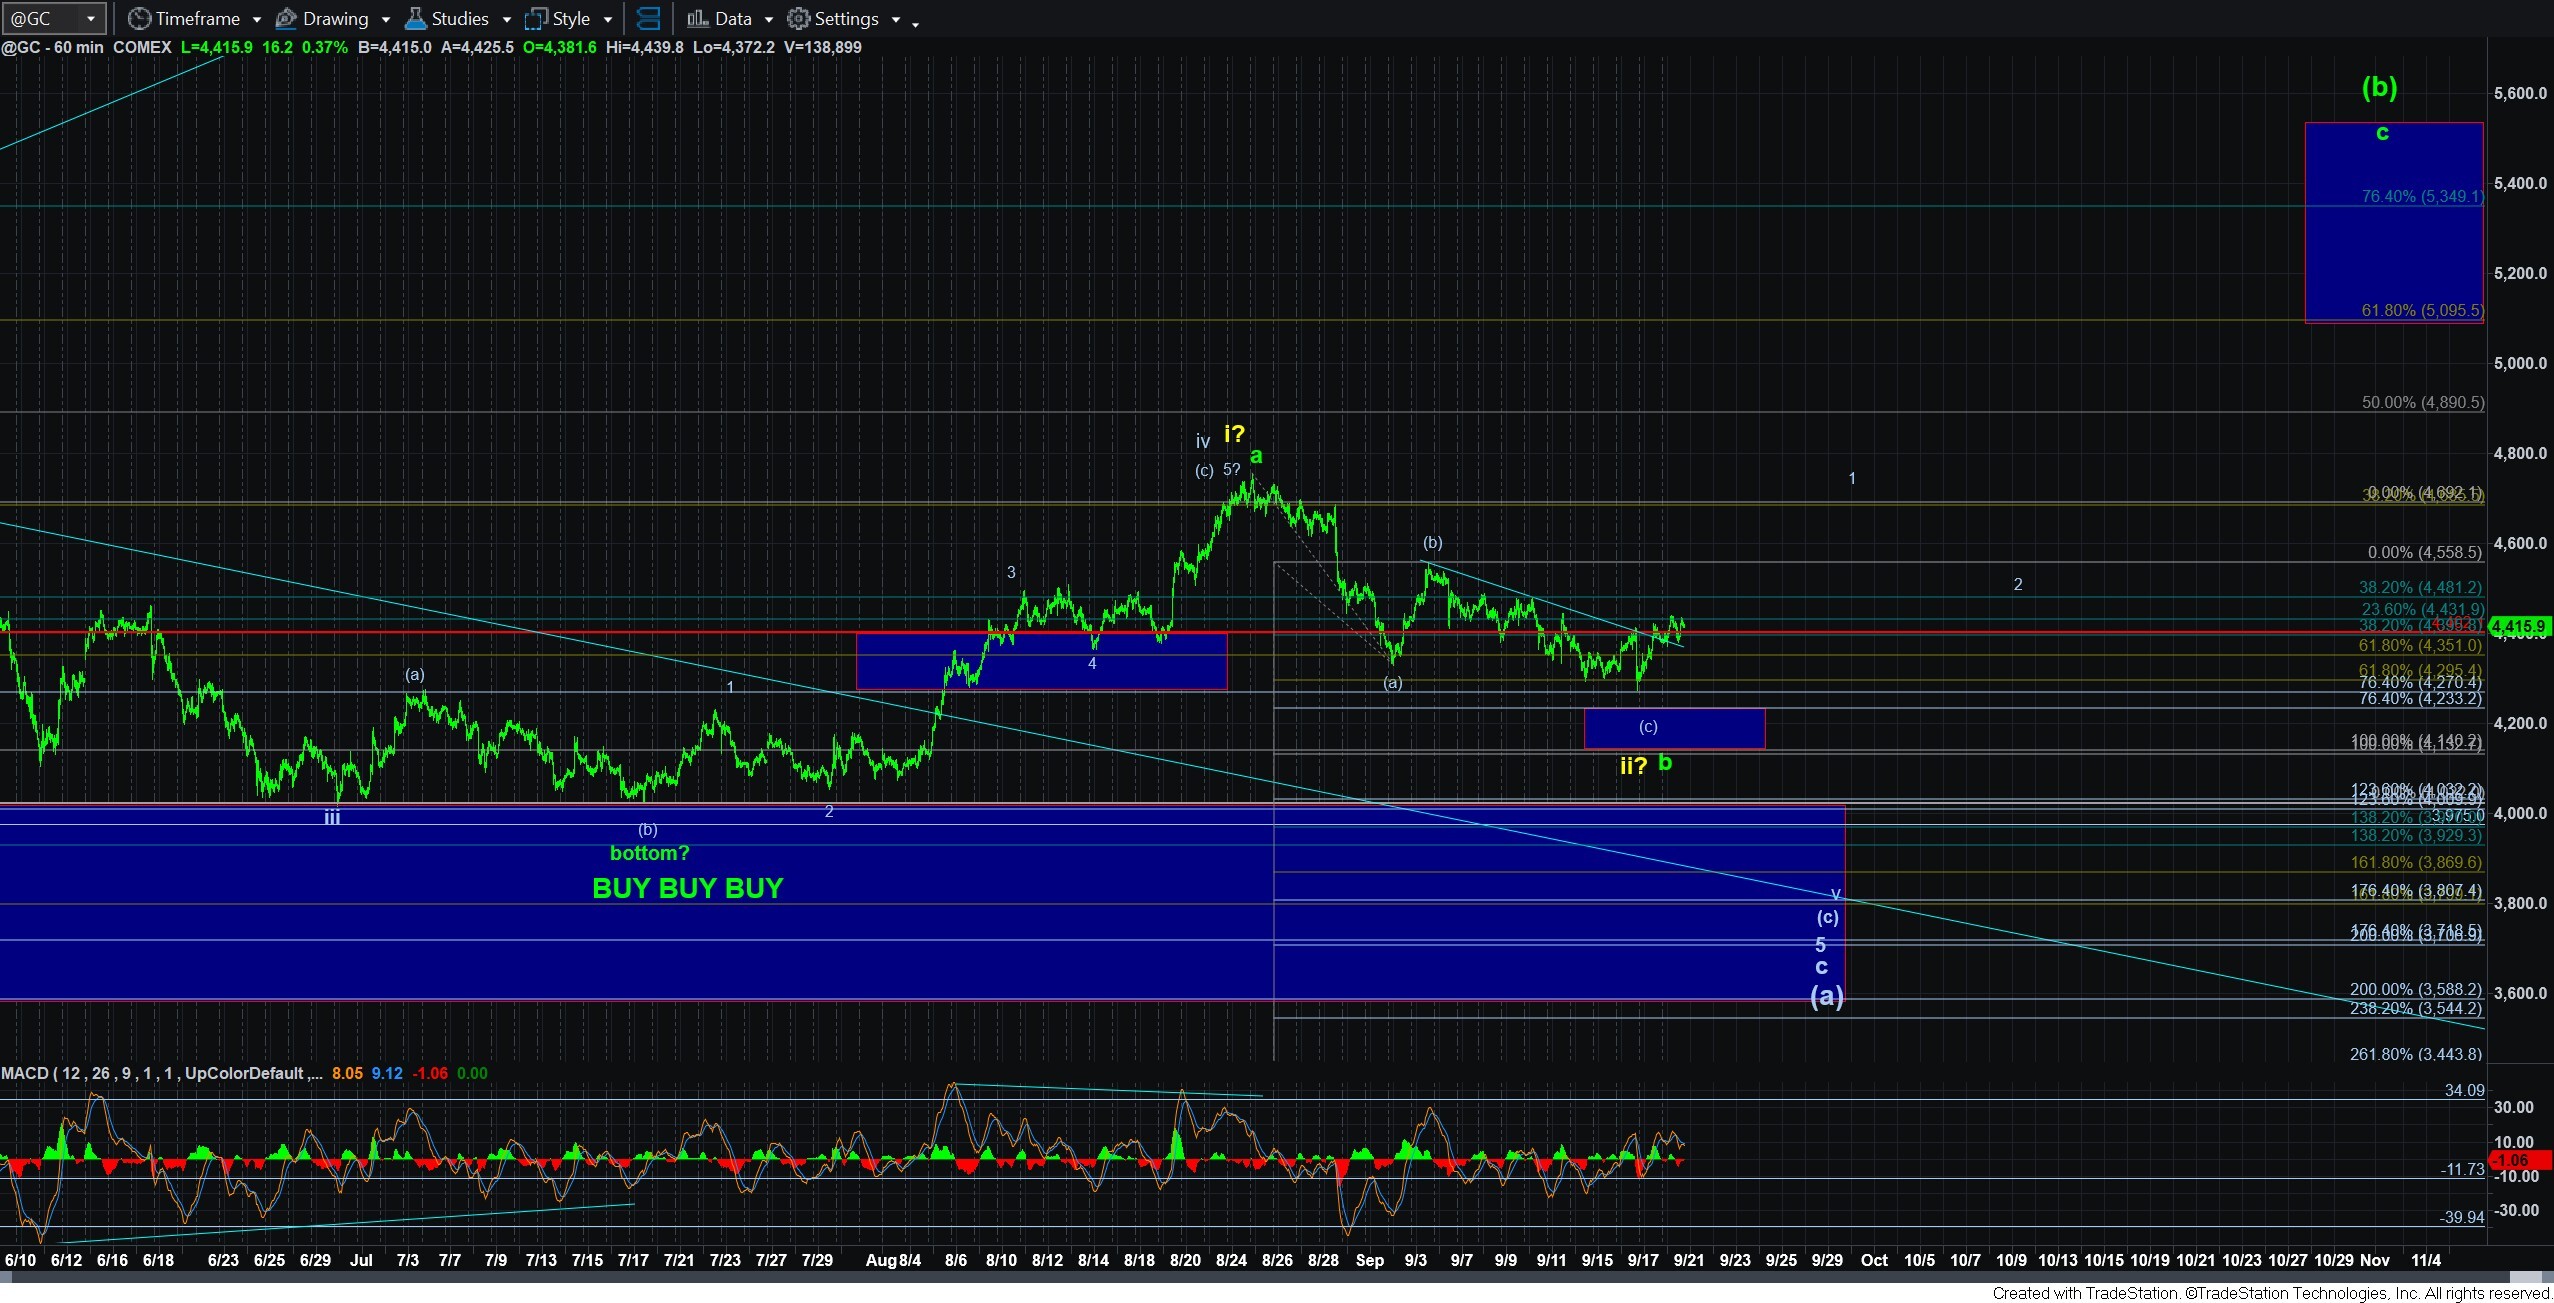
Starting with the 60-minute gold chart, you will see that we bottomed this past week just over the support box. And, off that low, while we do not have an ideal Fibonacci Pinball 5-wave structure, we can make out a leading diagonal. Yes, I know those are not terribly reliable. But, if the market continues to provide us with a corrective pullback off its wave (i) high, as outlined on the 13-minute gold chart, and then rallies back over that wave (i) high in impulsive fashion, that would greatly increase the potential that this pullback is done and the next larger degree rally has begun.
Ideally, I would much prefer to see a higher degree 5-wave structure complete wave 1, as outlined on the 60-minute chart, to make it likely that the next major rally has indeed begun, which would provide one more wave 2 pullback as a buying opportunity,
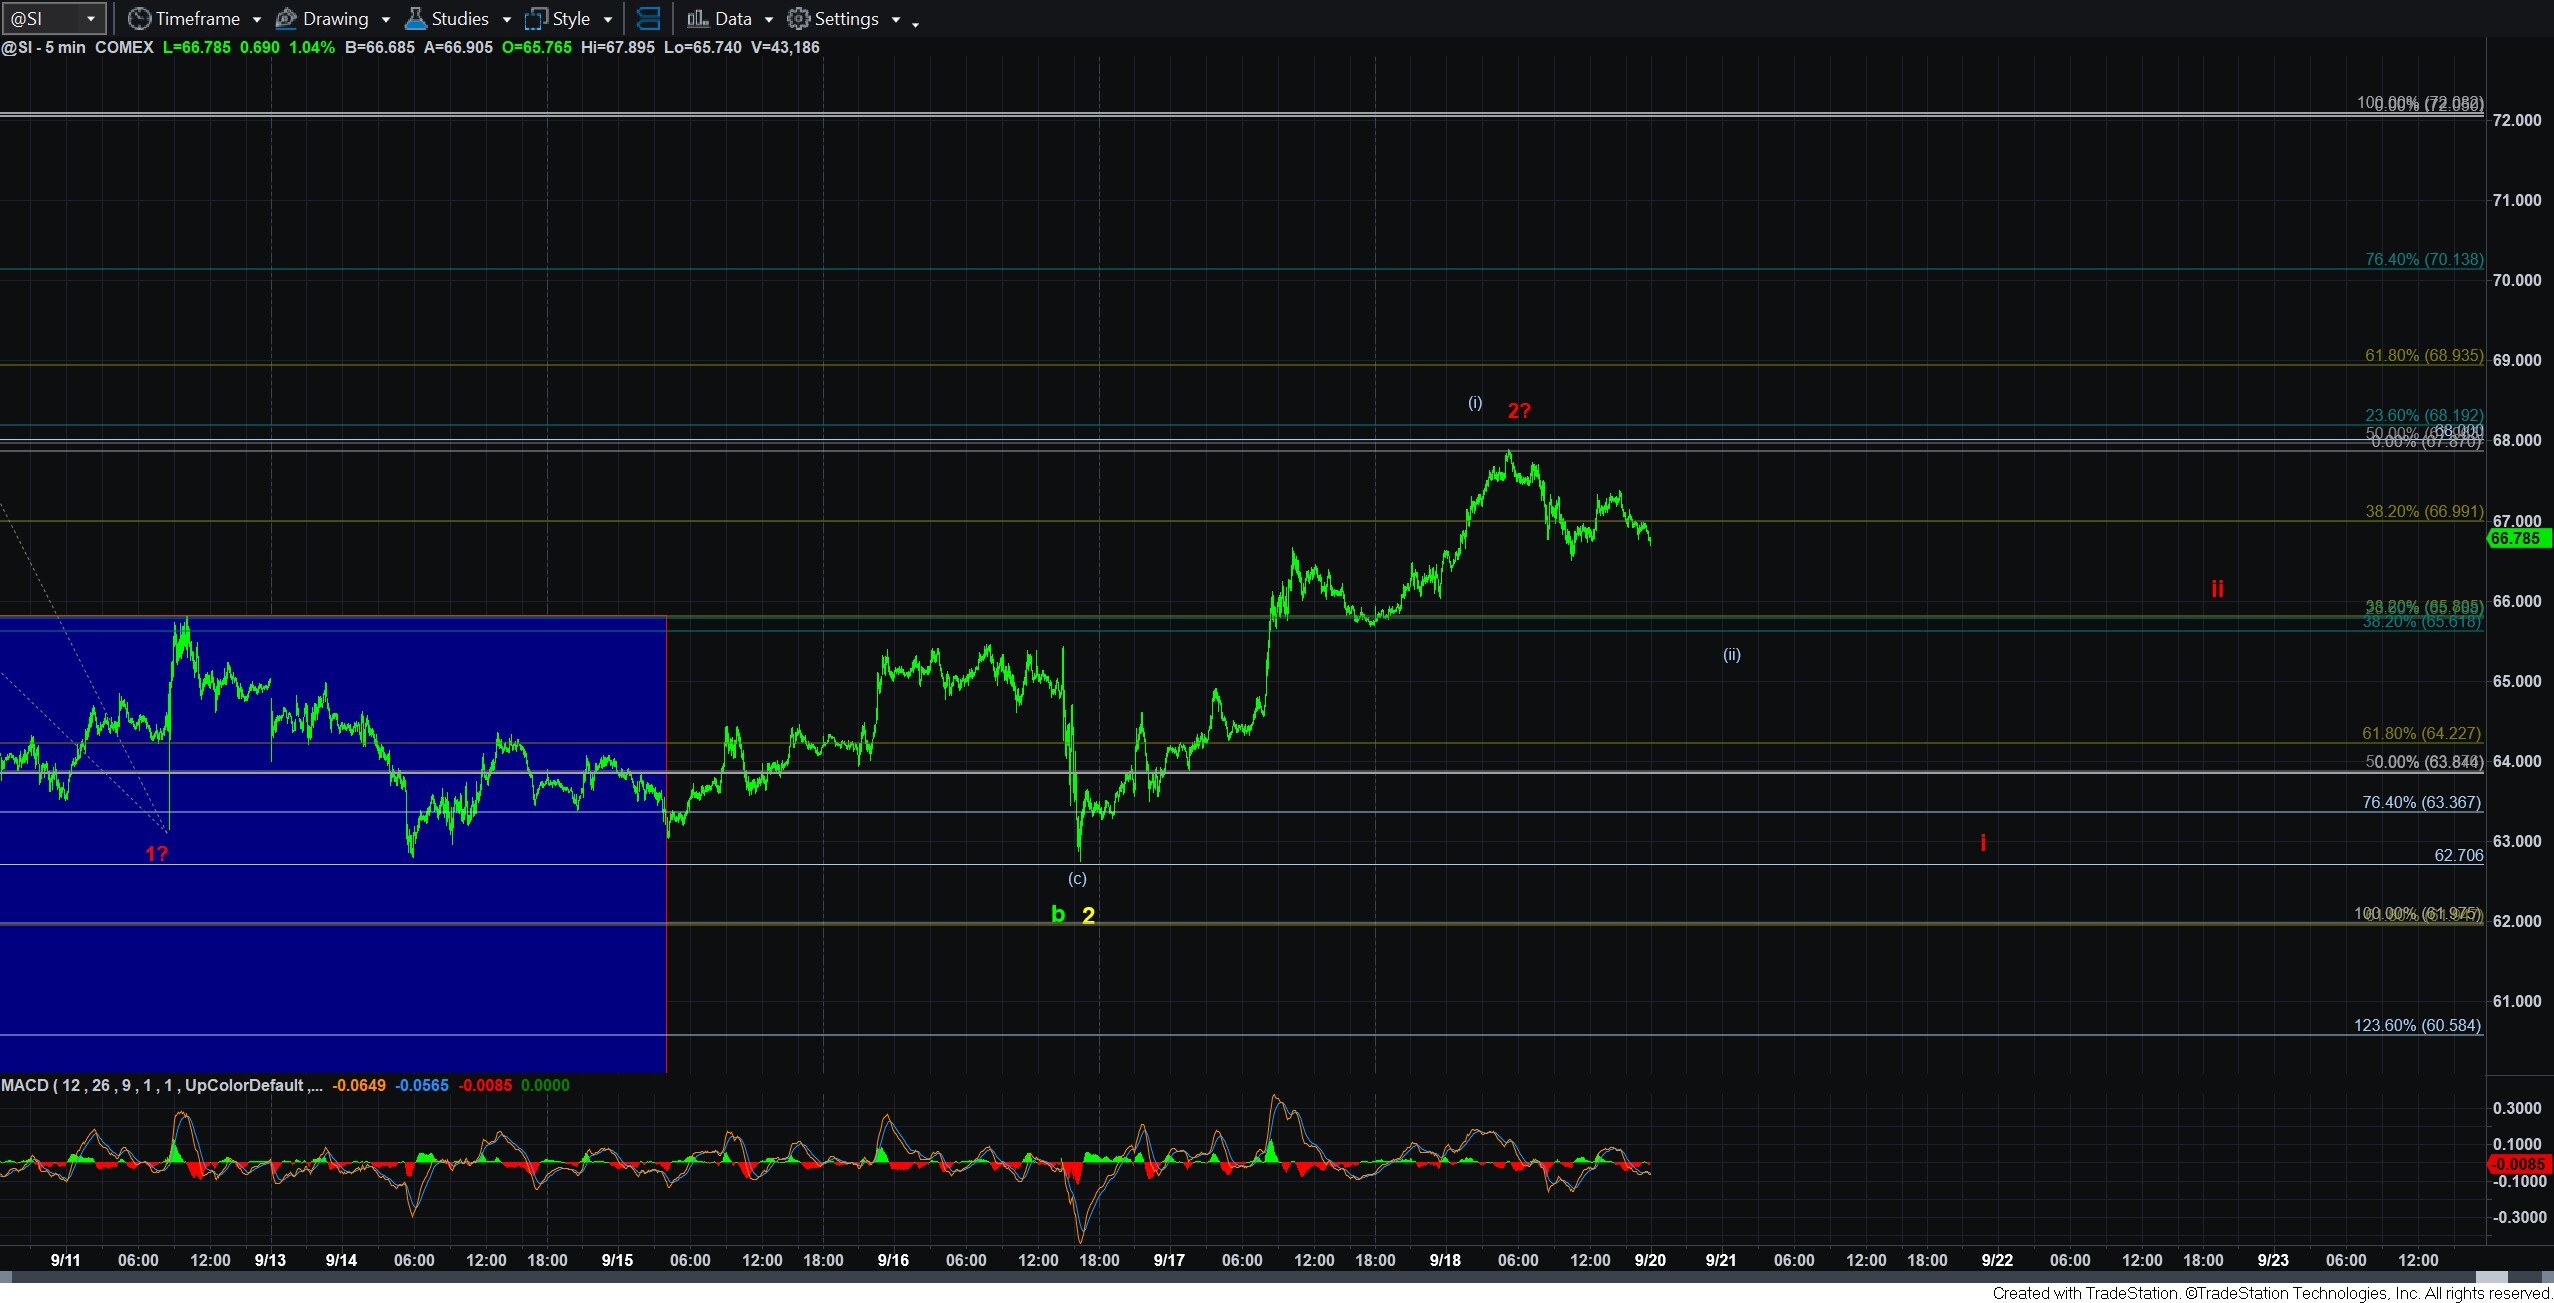
The same applies to the silver chart. The attached 5-minute silver chart gives us a clearer picture of the two paths we will be facing in the coming week. The more immediate bullish path is tracking the same (i)(ii) potential structure I just outlined in the gold analysis. And, should that trigger a break out in wave (iii) of wave 1, then probabilities begin to increase that the next major rally has begun.
However, the alternative path noted in red – which would suggest lower lows are likely – would see us drop back down towards last week’s lows to complete a 5-wave wave i of 3 to the downside within a (c) wave decline, which would point us towards those lower lows, with a minimum ideal target of 53.50.
Therefore, I think the 5-minute silver chart is probably going to be our key indicator over the coming week or two.
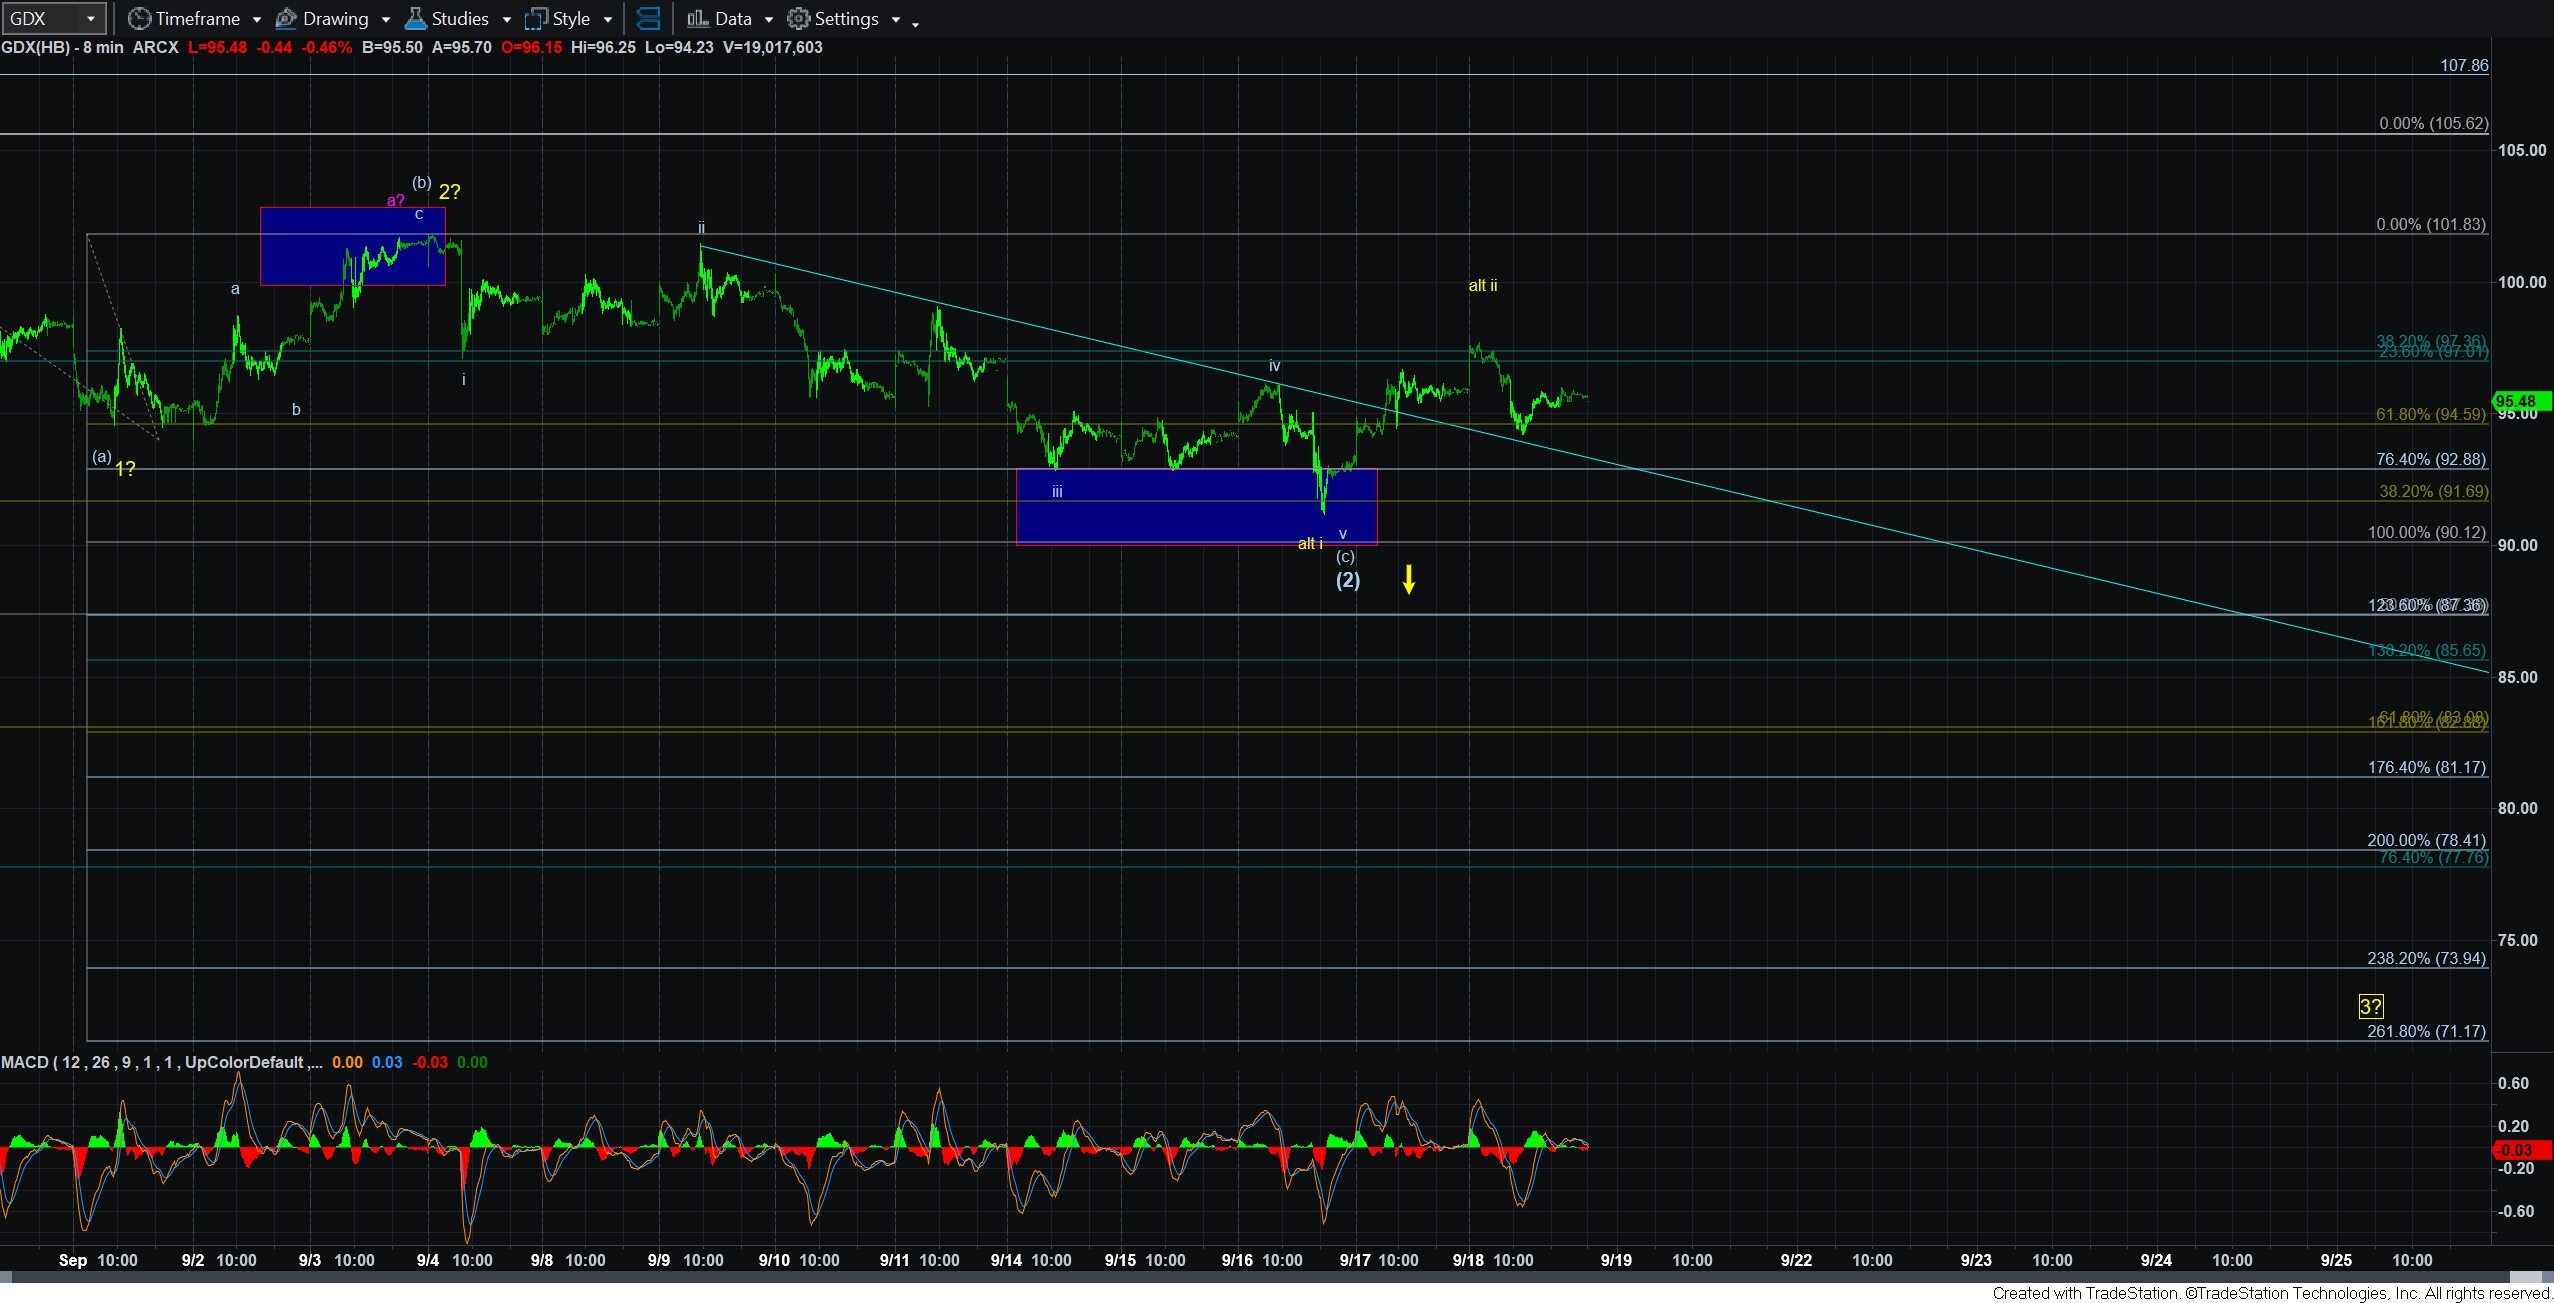
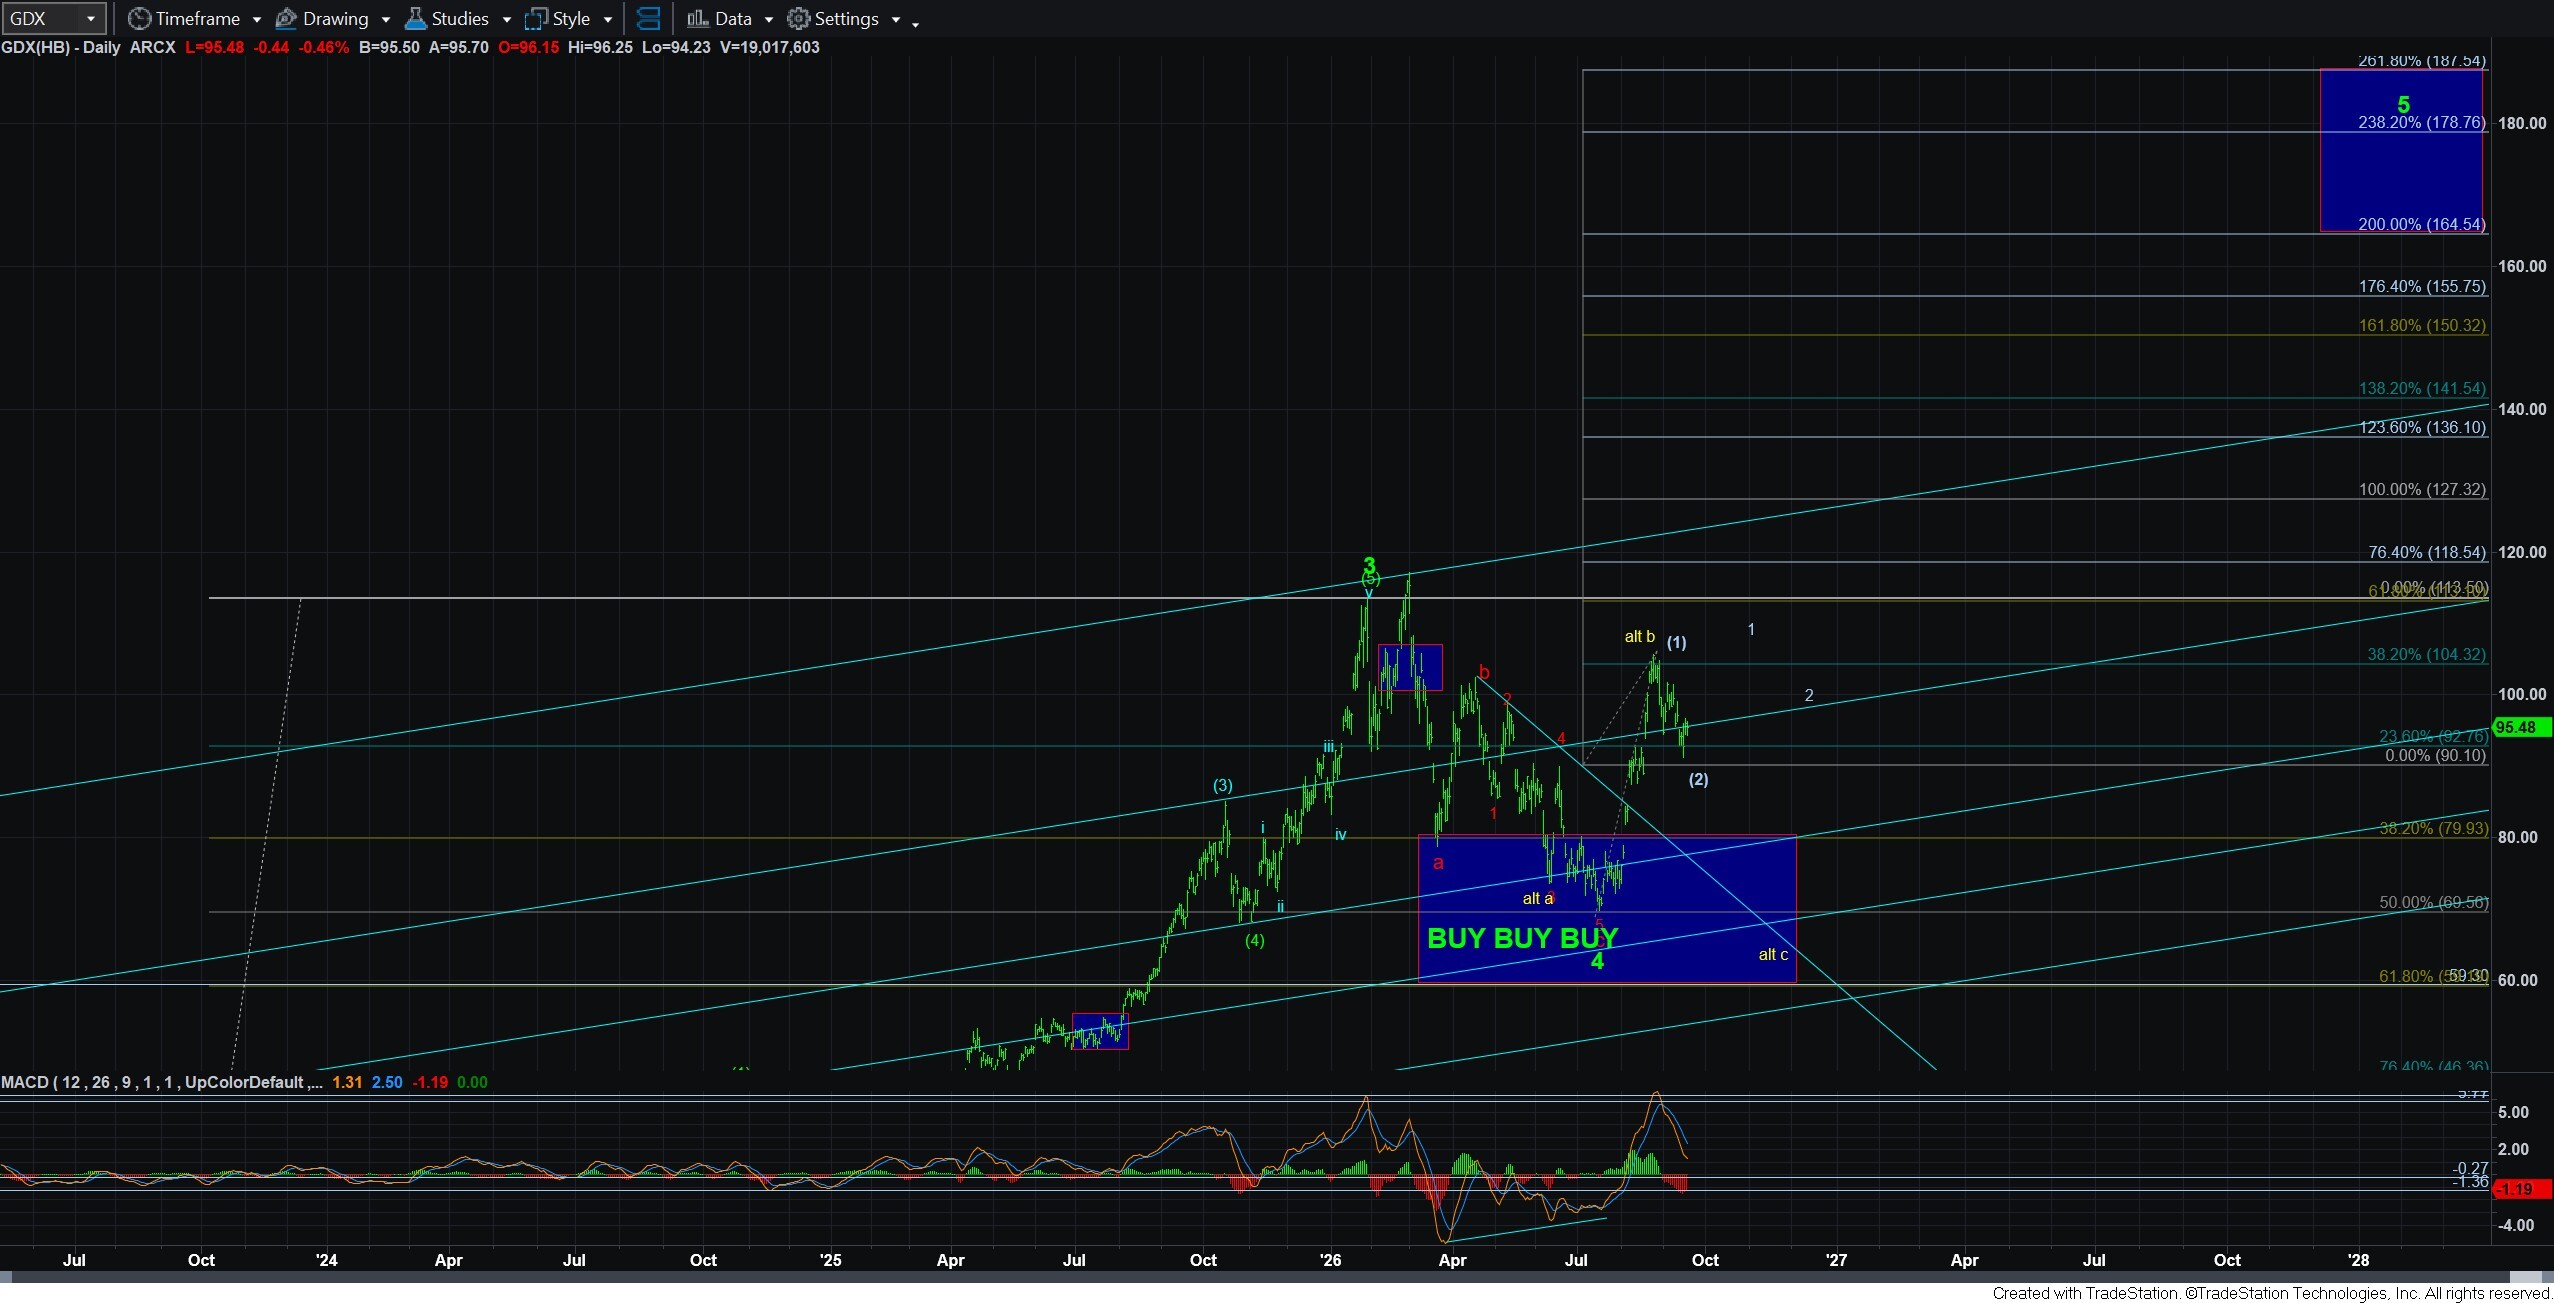
While GDX has completed a potential, yet VERY shallow, wave (2) at the .382 retracement of wave (1) and our target/support box we outlined on the 8-minute GDX chart, I am not yet confident that wave (3) has indeed begun. There is still too much risk inherent in the yellow count until we are able to exceed the yellow wave 2 high at the 101.83 region. Moving through that level and completing wave 1 of wave (3) back towards the recent highs, and potentially a bit higher, would make the ensuing wave 2 a very strong buying opportunity, with stops set at the wave (2) low.
For those that bought this pullback and would like a tight risk management plan in place, you can choose to set your stops at the low struck this past week. That is what I personally have done with the positions I added this past week.
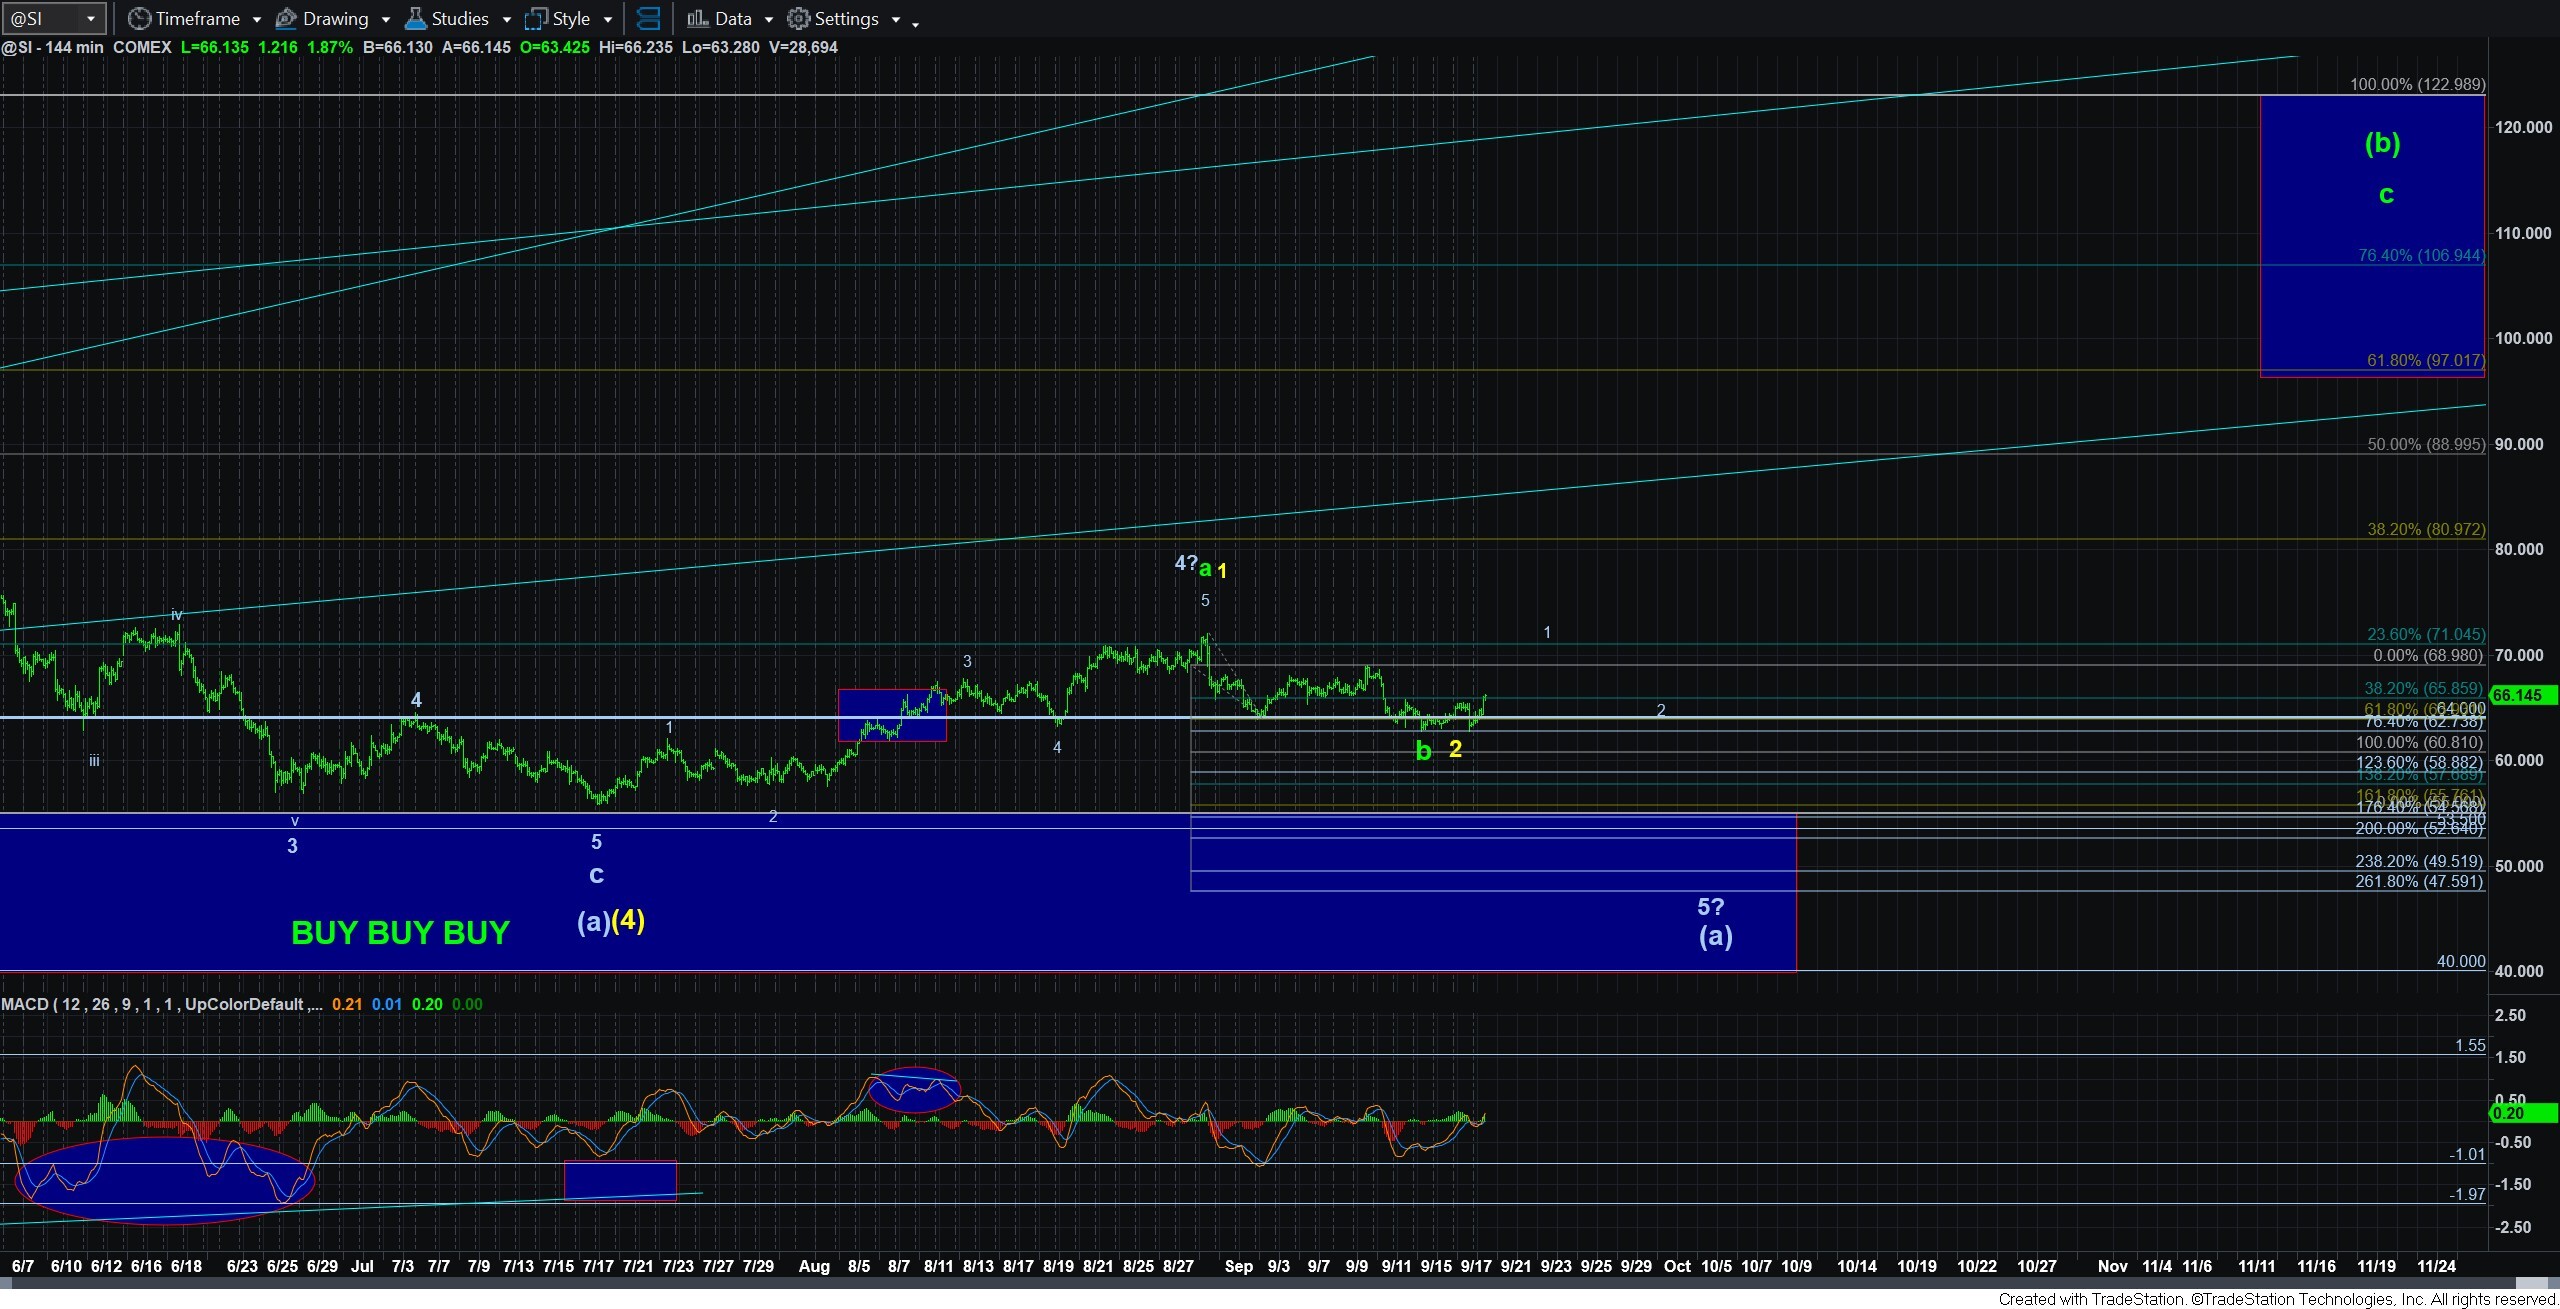
In summary, there is potential for wave (2) to have completed this past week. I cannot affirm this position with a high degree of confidence yet, as I would prefer to see a 5-wave rally take out the various resistance points noted on the charts and analysis above to provide us with such confidence. And, until we reach that point, I must view the potential for lower lows in the various charts as a reasonable probability. Should silver provide us with a 5-wave decline in the coming week as outlined in red, that probability rises dramatically. Until such time, I am giving the charts room to breathe, as I am siding with the more immediate bullish intent based upon the price action thus far.