Metals Are Bullish, But They Have A Choice To Make
I want to first start this update by reiterating something that I am not sure is sinking in for everyone reading my analysis: I am viewing the metals charts as bullish.
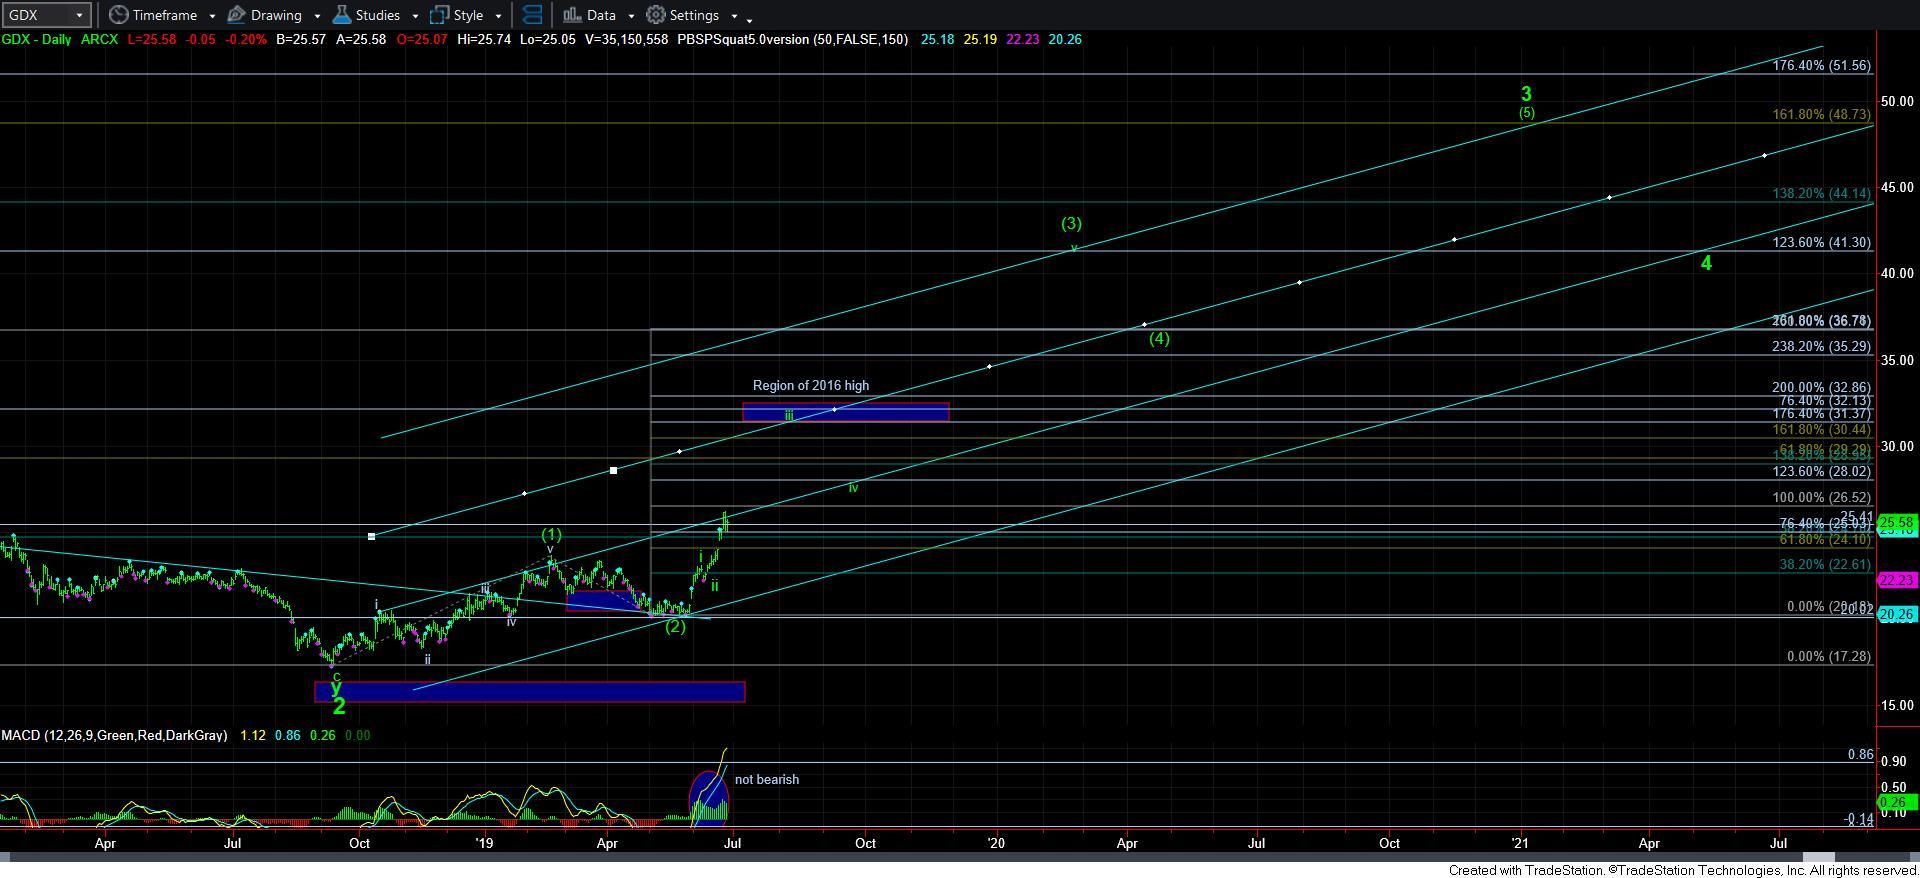
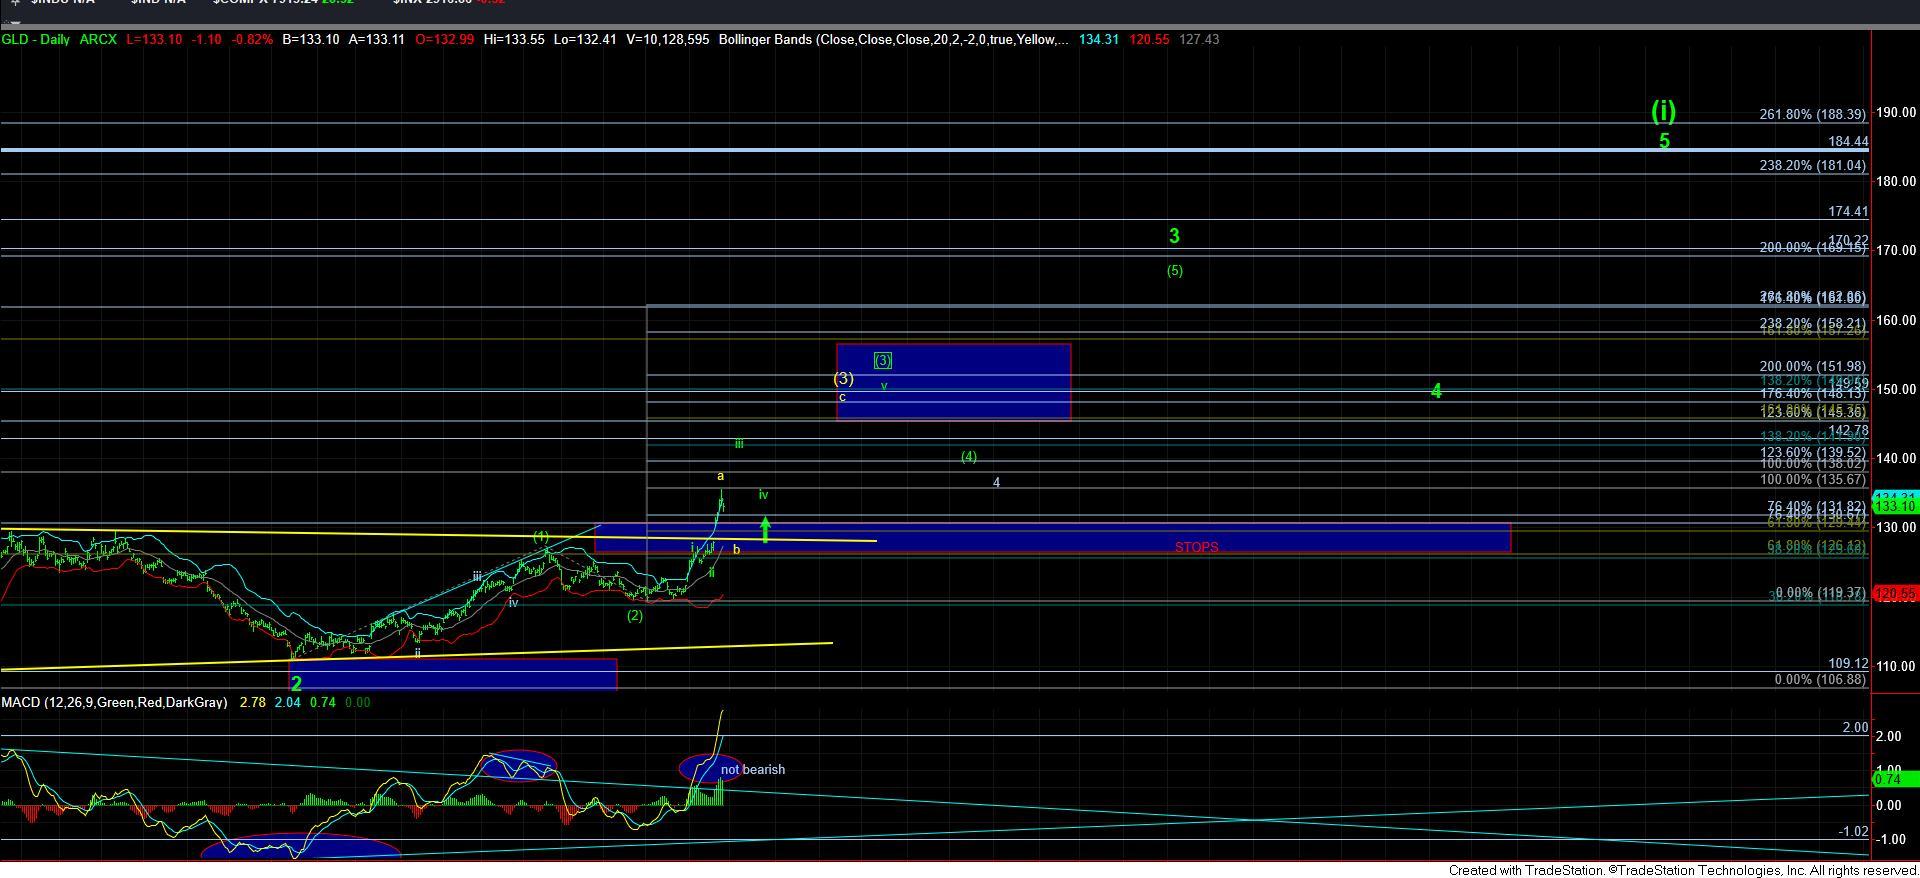
In fact, I do not have any reasonable way to view the GDX and GLD daily charts in a bearish fashion. They are both overwhelmingly bullish, especially with the postures we are seeing on their respective MACD break outs, along with their price break outs.
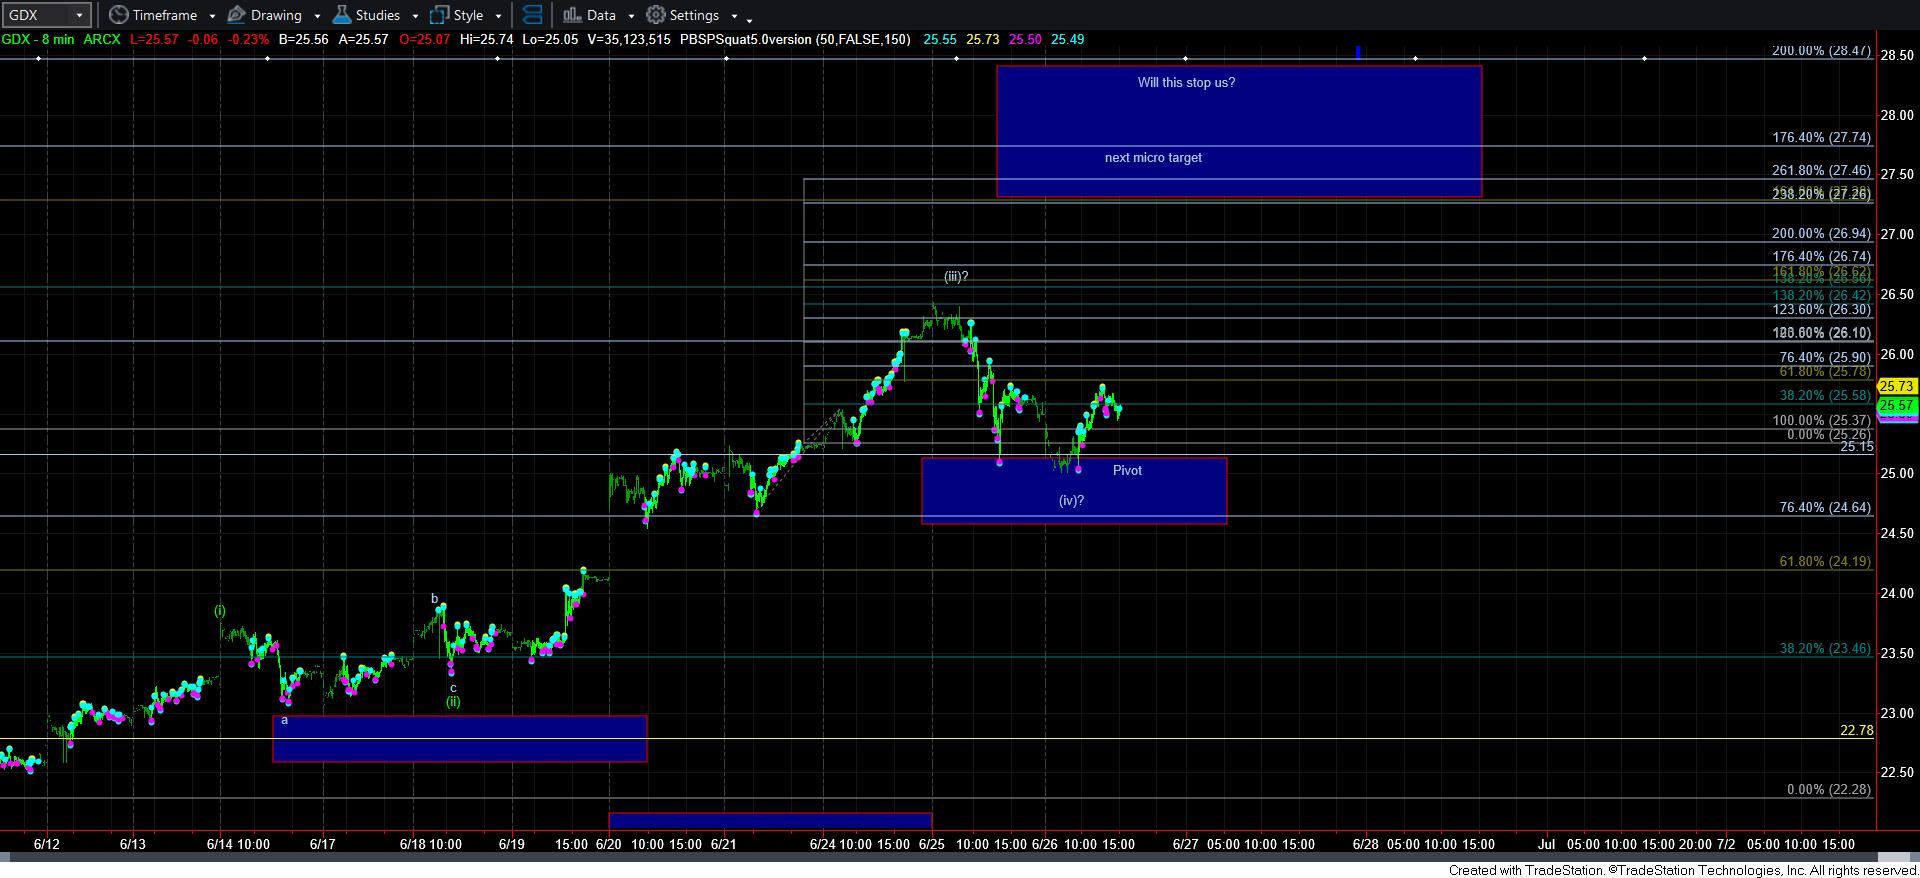
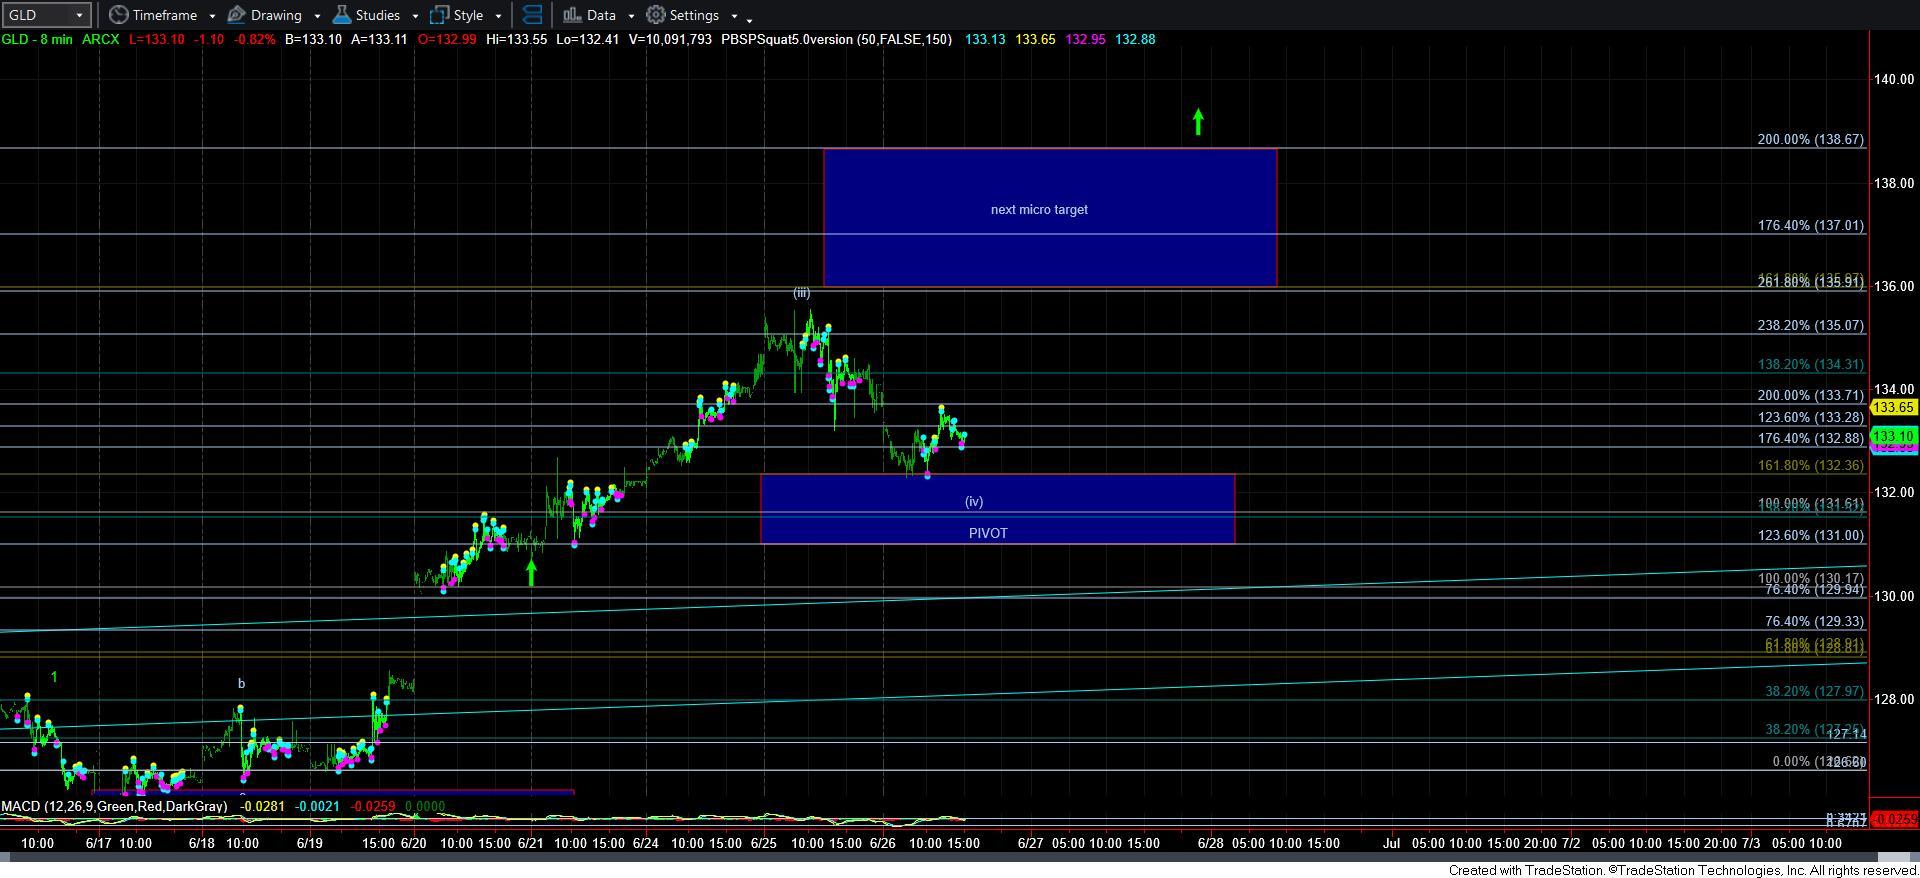
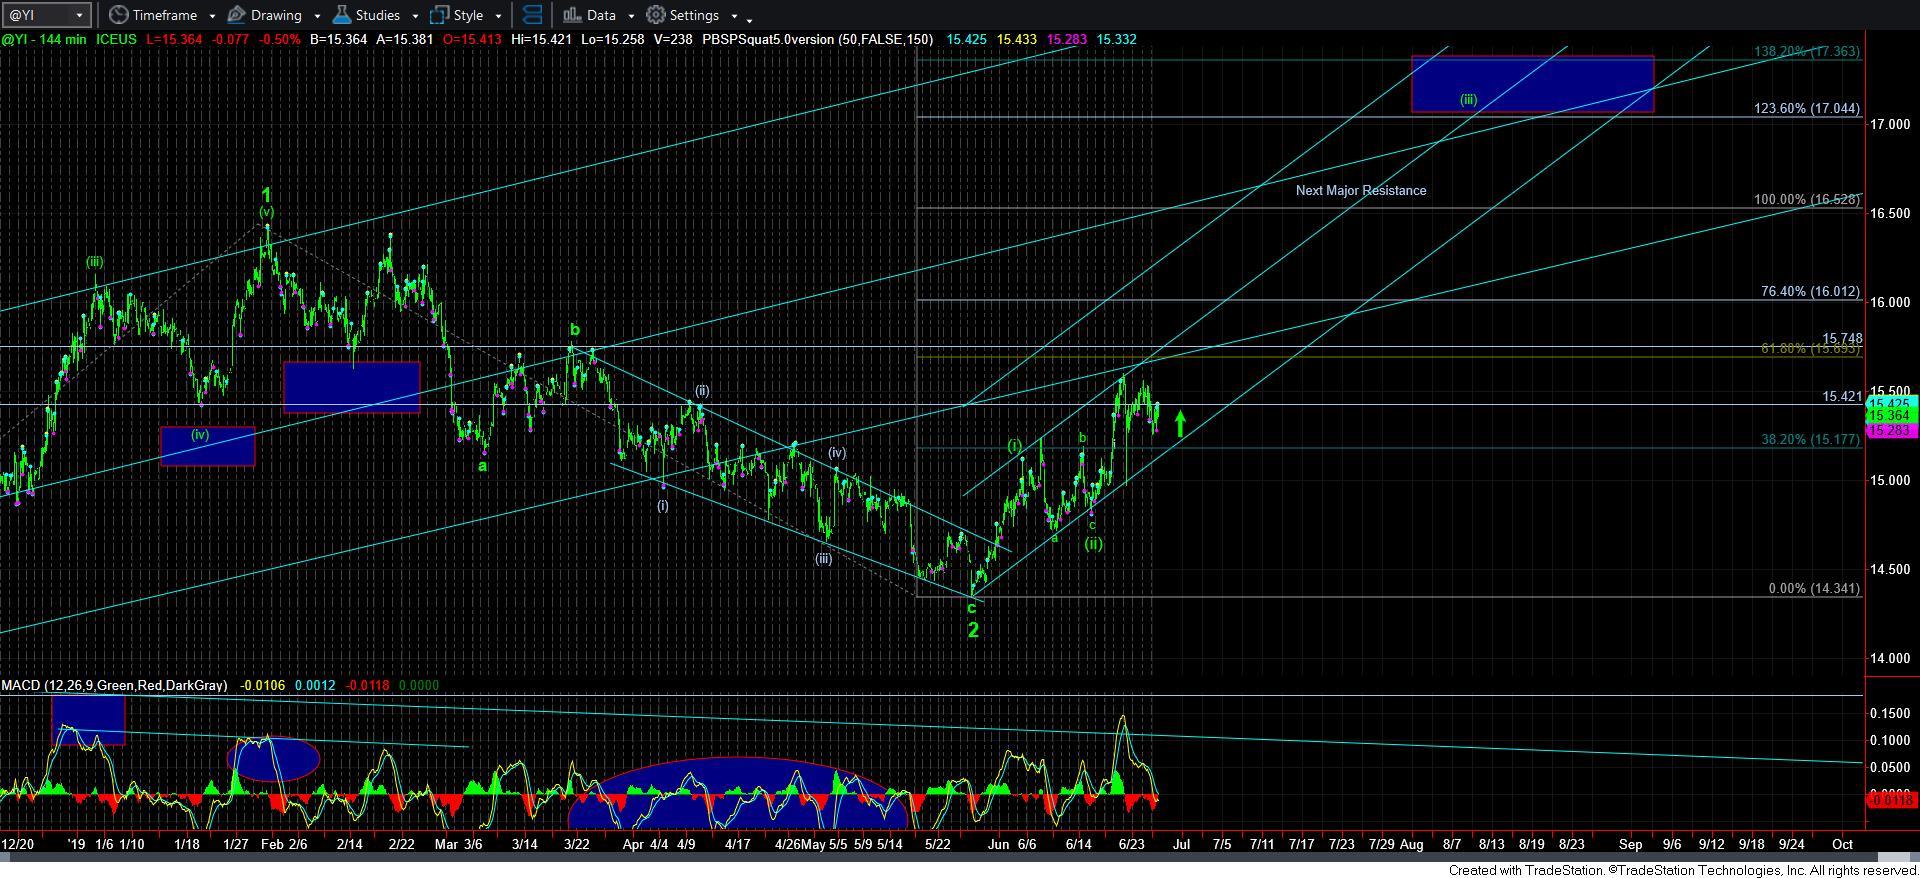
For those following our work closely, you would know that we had an opportunity to trade the long side earlier this week once the GDX and GLD broke out over their respective resistance pivots. And, yes, I personally stopped out on my leveraged long trade when GDX broke back below 25.90, as noted yesterday. And, as the market has moved higher, we have continually moved up those pivots. As you can see from the attached 8-minute charts, the market has pulled back to those raised pivots into today.
But, for now, the only question that I think remains is whether the market will continue higher in a standard impulsive structure as presented in green on the GDX and GLD daily charts, or if the market will morph into a leading diagonal for another 5-wave structure rally, as illustrated by the a-b-c structure in yellow. (Should we see the diagonal chart take precedence, then I will add the rest of the count).
But, for now, I am still going to give the market the opportunity to prove the more immediate bullish impulsive count presented in green. But, in order to prove this potential, the metals are going to have to stage a VERY strong rally for wave [v] of iii.
As you can see from the attached 8-minute charts of GLD and GDX, the market has now pulled back into their respective support pivots. As long as these pivots hold as support, I am expecting a rally to ensue which will provide us the answers for which we are looking. If the market can break us out over the blue boxes overhead on these charts on the next rally, then it keeps us strongly within that green count.
However, should the market break down below these pivots, or be unable to accelerate through the boxes overhead, then the diagonal pattern grows in probability.
But, I want to repeat again, neither of these patterns are suggestively bearish. Rather, they all suggest that higher levels will be seen in the coming months. The difference is only whether it is going to be “parabolically” higher now, or more up/down action that we see within a diagonal. Moreover, the diagonal will take longer to reach higher levels, and will not likely reach as high as the standard green count is projected.
And, as many of you have highlighted, the silver chart is a bit more perplexing. My “feeling” is that silver will soon catch up. In fact, silver can easily surprise everyone with a .75-1.00 move in a single day. And, should that occur imminently, then it would likely make it much clearer that the market will follow through to the upside in the standard impulsive structure presented in green. Anything less will likely suggest the diagonal pattern potential as outlined above.
In summary, I am still giving the metals the opportunity to prove to us that they are about to accelerate in the heart of a 3rd wave. They are simply consolidating over support at this time. And, as long as they can accelerate through their respective resistances overhead on their next rally attempt, they can retain the green counts presented on the attached charts. Yet, if they fail to do so, it simply means more pullback/consolidation in the complex before heading higher.