Metals Are At Different Stages Of Correction
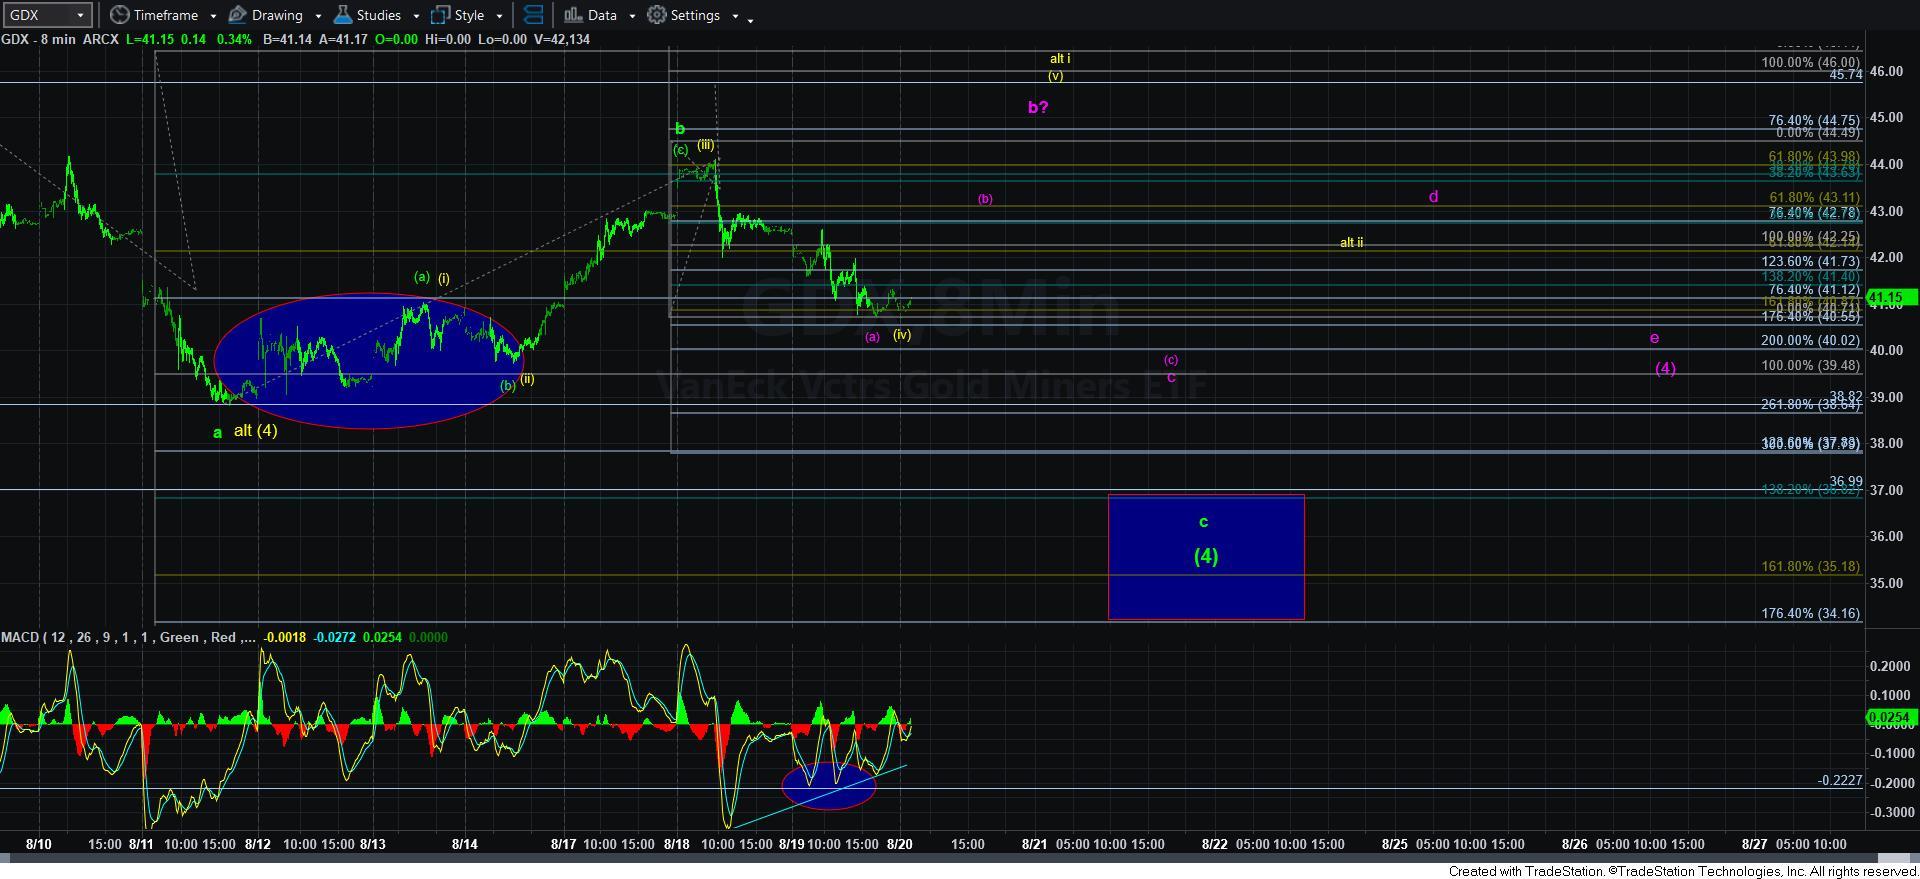
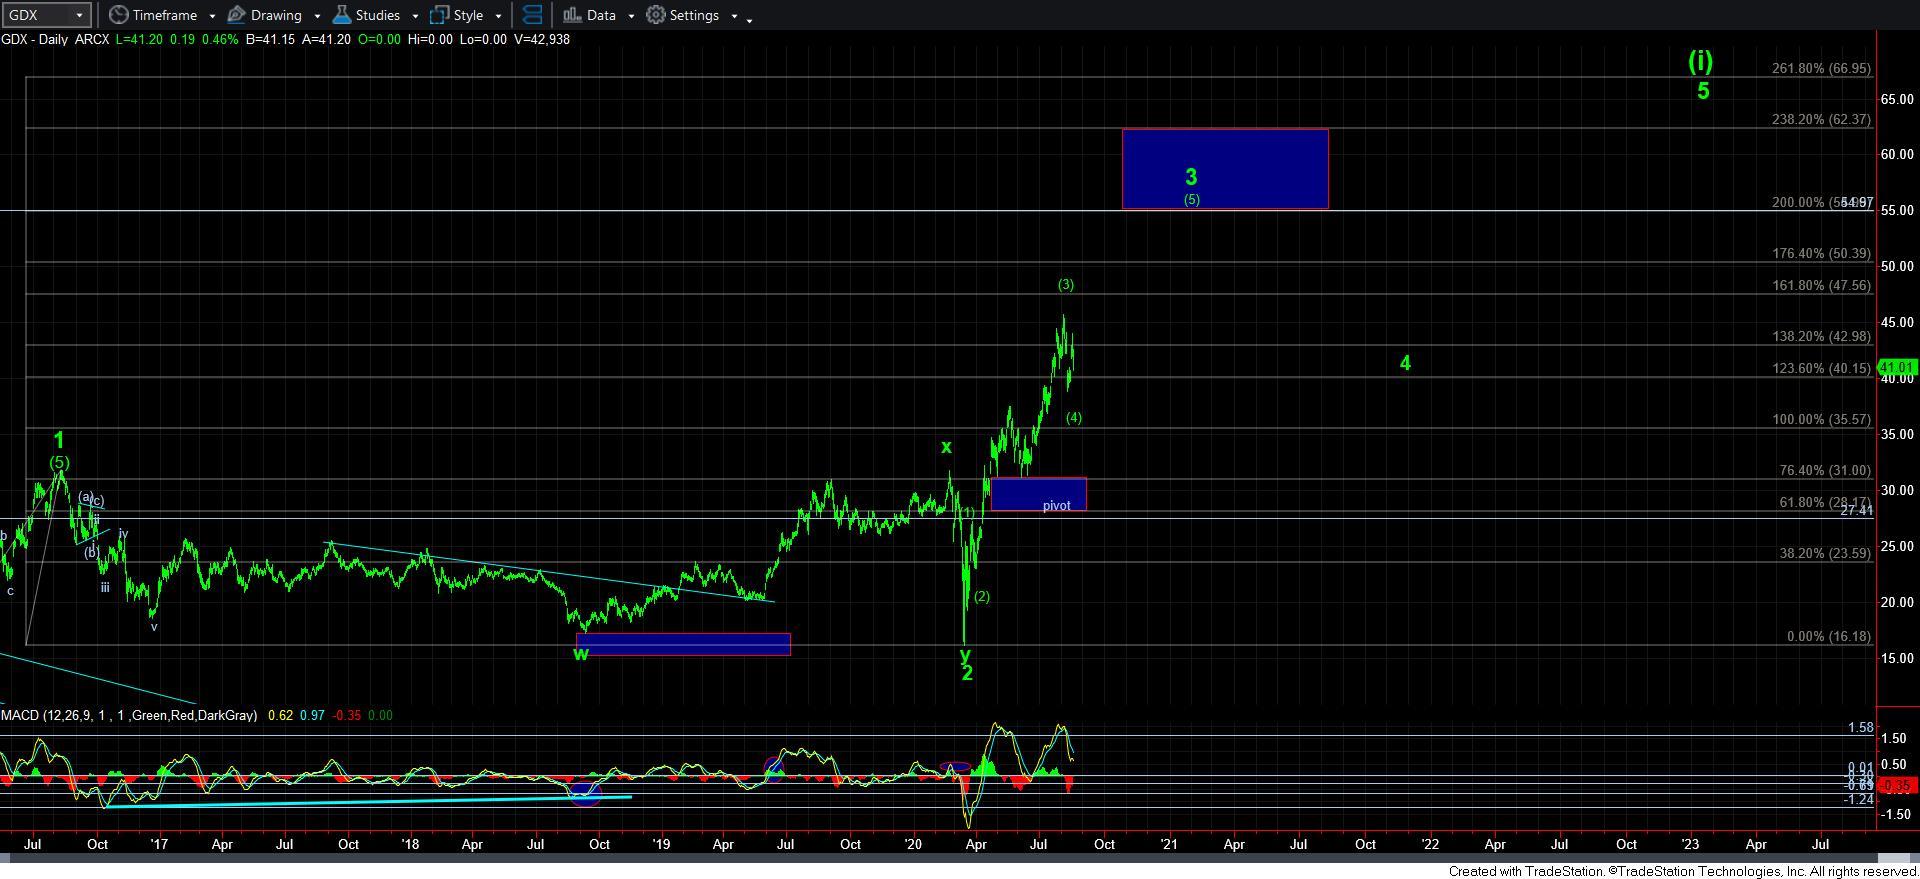
Earlier this week, I sent out a mid-week update warning you to protect your positions as we are setting up for more weakness in the complex. The main tell for me was the GDX chart, wherein I was looking for a rally high in the 44 region, to be potentially followed by a decline to the .382 retracement of wave [3] in the 37 region.
Yesterday, the market begin to follow through to the downside in an almost textbook Fibonacci Pinball manner. However, as we were approaching our first hurdle – the 40.70 support – the MACD on the 8-minute chart began to diverge in a manner in which it should not during a heart of a 3rd wave down. This alerted me to the potential that something else may be playing out, which then caused me to alert you of the same.
Currently, I cannot view the structure we are viewing in the GDX as a standard Fibonacci Pinball c-wave targeting the 37 region. The structure has become quite sloppy for what should have been a 3rd wave decline, and the divergences are also not clearly suggestive of a 3rd wave decline.
So, unfortunately, this opens the door to several options. Of course, the market can always continue down to the ideal target of the 37 region in an ending diagonal. But, that will be quite difficult to trade with all the whipsaw. And, a break down below 40.70 would make this a bit of a higher probability.
However, for as long as we remain over the 40.70 region, the market leaves too many paths open to make me comfortable to trade to the short side aggressively. For this reason, I personally took profits on all the positions I added this week to the short side, but still retain that original 35% left of my short position I started two weeks ago.
The potentials I am seeing in GDX include the triangle presented in purple, the yellow count, which suggests this is just a wave [iv] pullback in wave i of [5] off the recent low, or it has potential to even be starting an ending diagonal for wave [5].
Now that I have provided the potentials, I want to narrow them down a bit. First, the ending diagonal for wave [5] is not something I am willing to accept since GDX really has much higher targets to strike, and an ending diagonal would really not fit well to be able to get to those targets.
Second, I don’t like the yellow count, as it really does not fit well with the GLD structure – which I will get to a bit lower in the update.
Third, the triangle count would make the most sense to me here, assuming we stay over the 40.70 region. However, I must warn you that even in the triangle count, we can still rally higher than where we struck today in the b-wave of this count. That is something that would fit well with the GLD chart.
So, all in all, I have to conclude that it is LIKELY that wave [4] has not yet completed and we could see more consolidation that can last us at least another week and maybe even two if the triangle count is what the market has in store. But, I am still of the opinion that we are likely going to see much higher levels in this complex in the coming months, as this is still only a 4th wave consolidation based upon my wave counts.
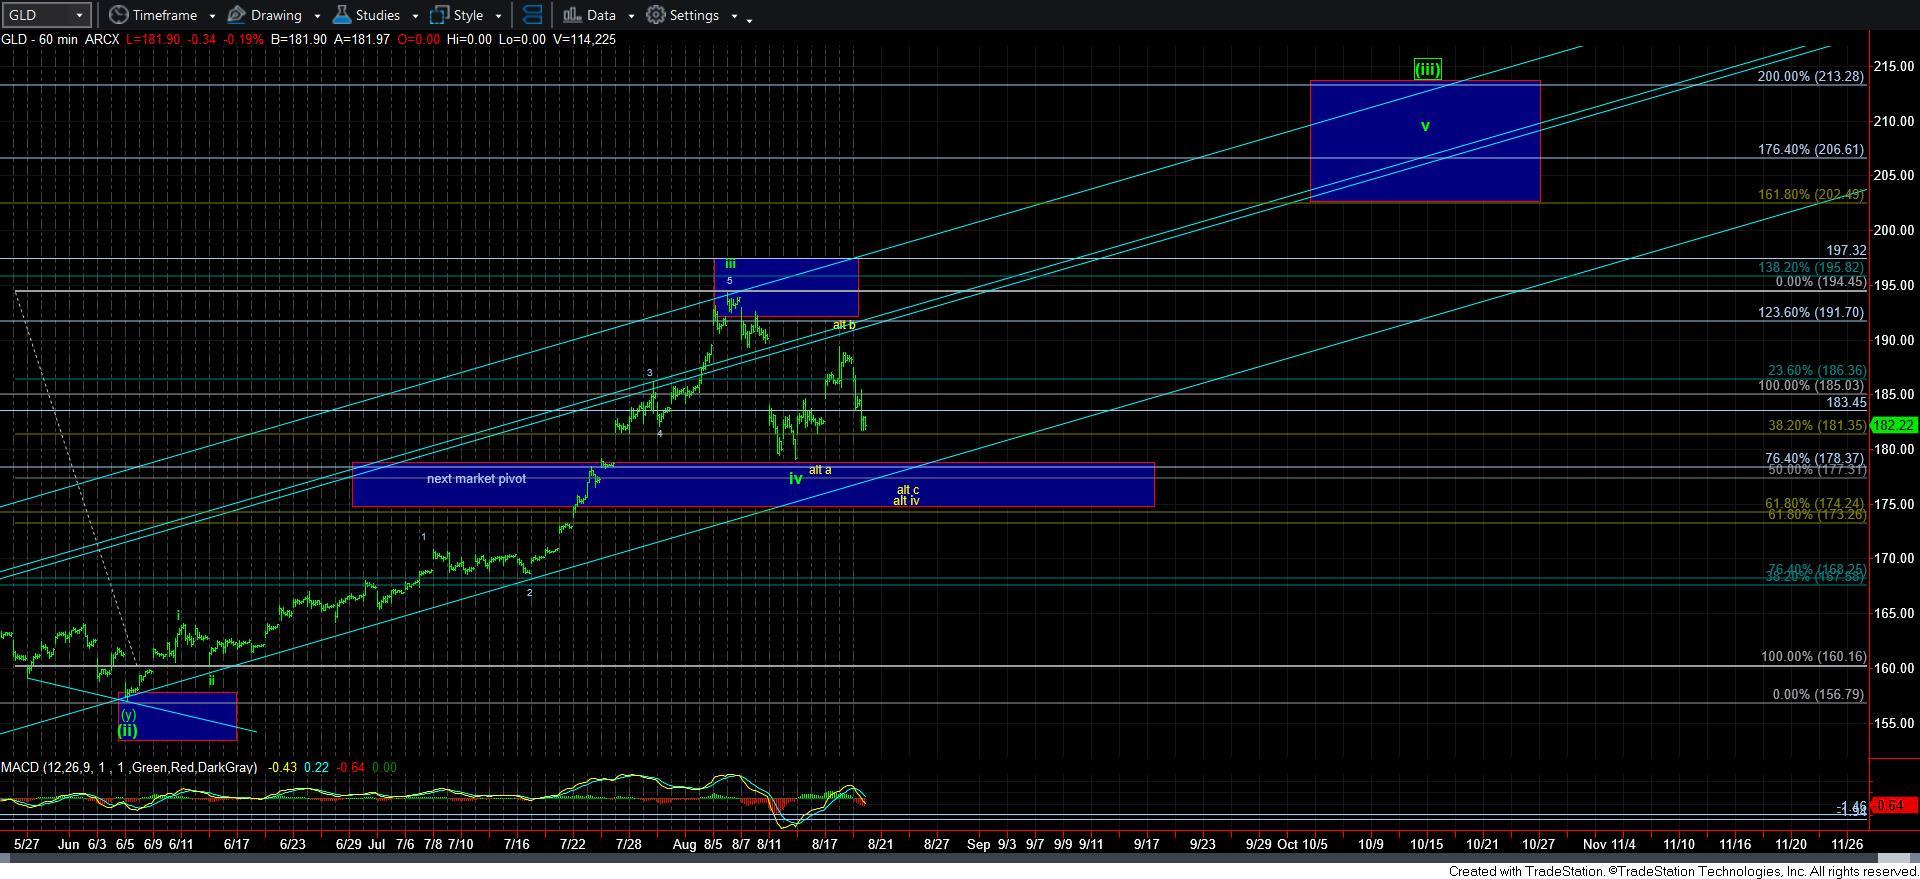
As far as GLD is concerned, it clearly can head directly lower to complete the yellow count which I have been highlighting. While it says its an “alt” on my chart, it is certainly more likely that having wave iv completed already, but I have not had the chance to change the labeling yet.
Should we continue lower, then there is potential that we can drop as deep as the bottom of the blue support box, which is where the a=c would target.
That being said, if we find a bottom today, and move back up through the 185 region, then the triangle count for the GLD would come into focus rather strongly, as that would make the current rally off last week’s low an a-b-c rally to complete a b-wave within that triangle. I do not have this on my chart, as it is really too premature to present this just yet and make the chart look too busy. But, I wanted to at least mention the potential.
Overall, I am still quite bullish of GLD, but it seems that it is quite likely that we have not yet completed wave iv.
Lastly, silver is a bit tougher. I wrote this yesterday in an update:
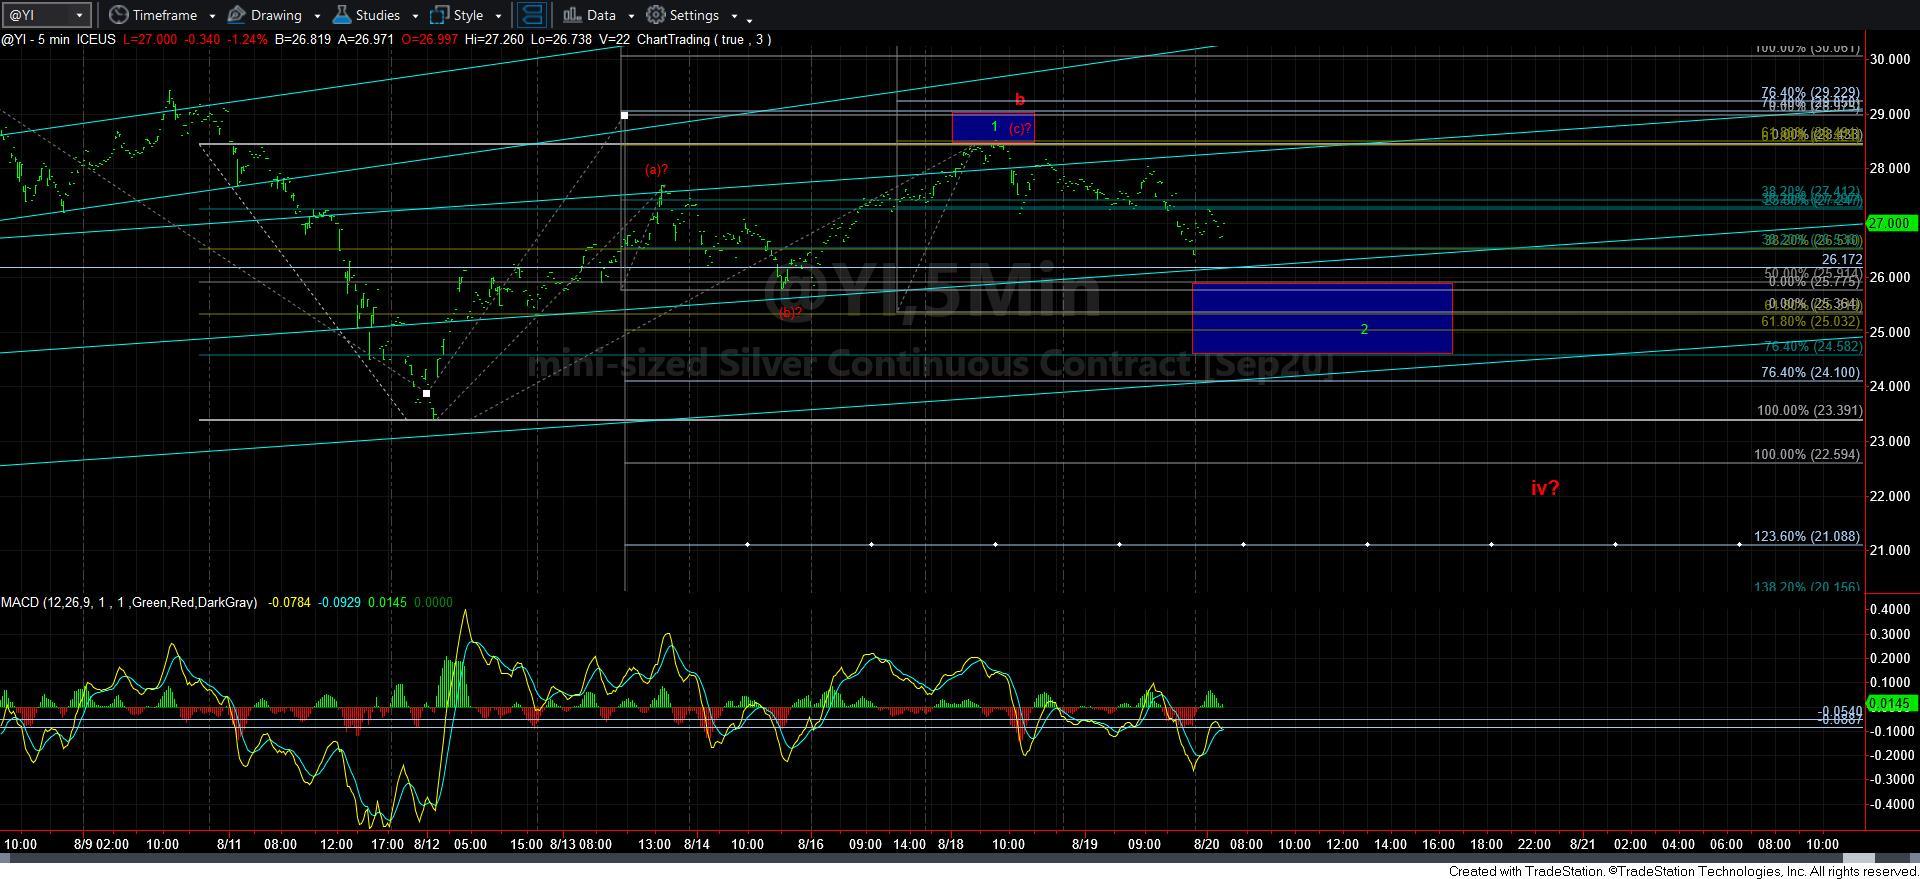
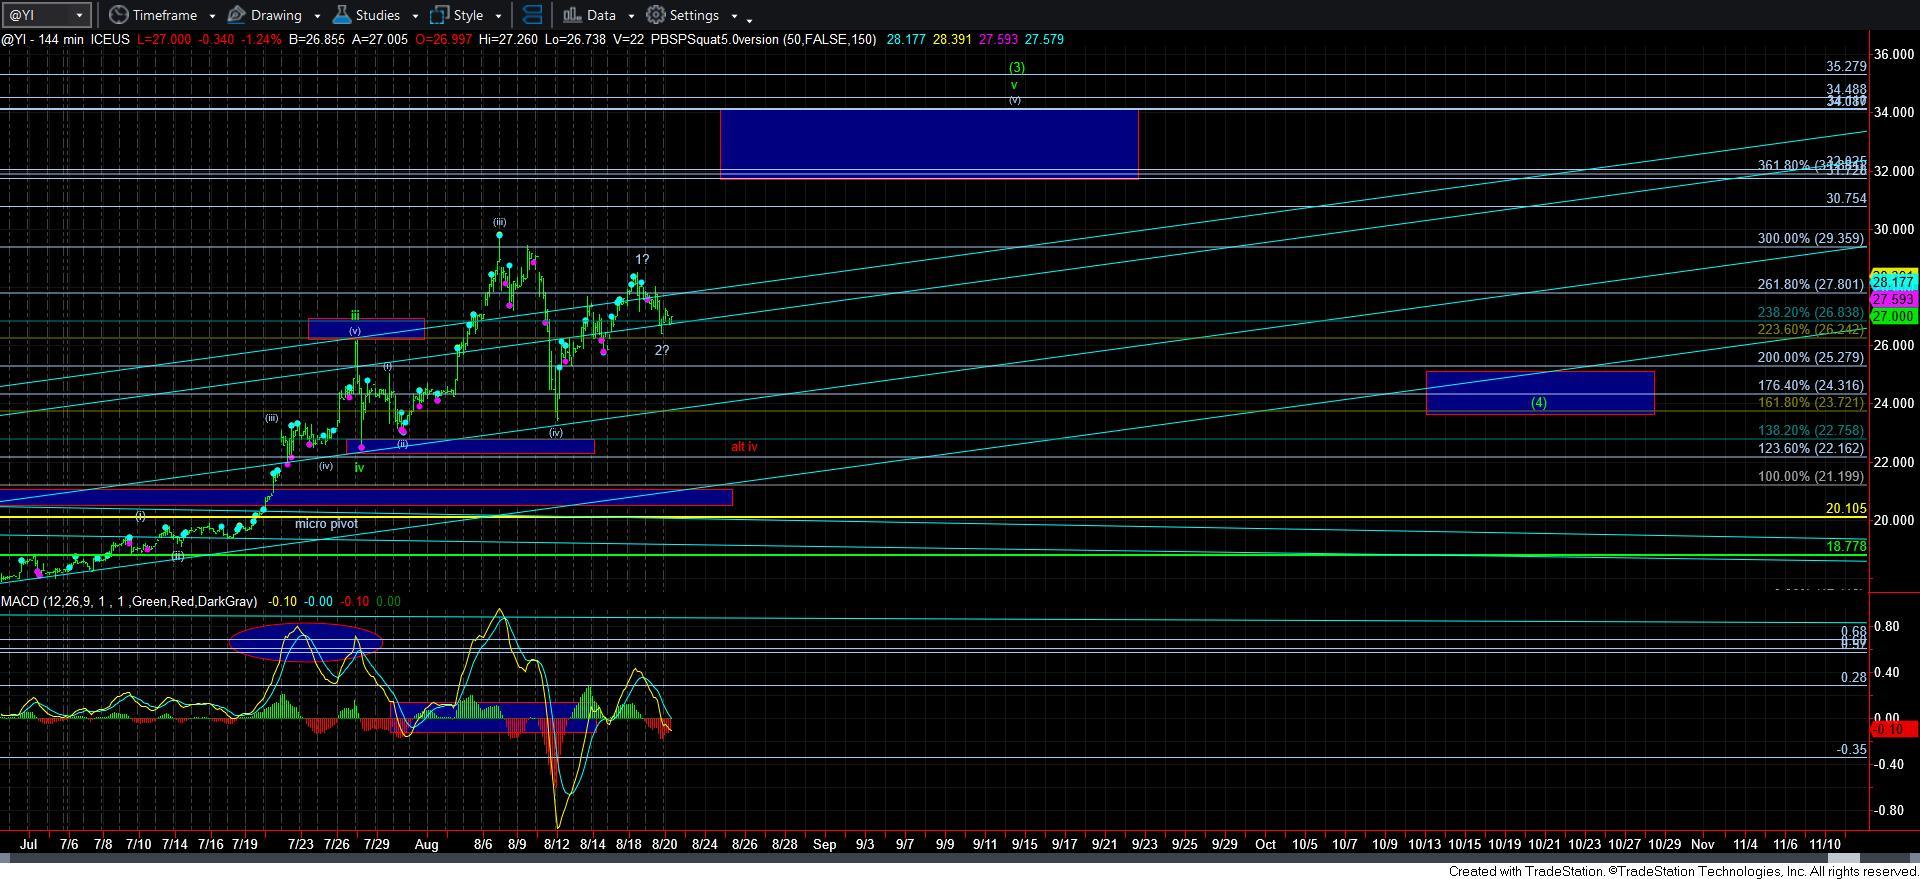
“Silver is more of a question to me at this time. While the initial move up has the proportions for a 5-wave wave 1 in green, I have to note that the (a) wave in red looks like a more applicable count. Yet, the (c) wave would be terribly short and not provide us with the normally a-b-c type of proportions. So, I am really at a 50/50 point here in silver as to whether this pullback will be shallow - as in the support box for 2 below . . . or if we get the deeper iv back to 22. Will need a bit more information to clarify.”
As we speak, silver is now hovering just over the wave 2 support. This would make silver a much more immediate bullish potential than either of the other two charts. And, as long as we hold over the 25 region, this could be projecting us up towards the 35 region sooner rather than later. While I would love to take this trade to the long side at this time, the posture in the other two charts make this a higher risk proposition at this point in time. Moreover, if I am to view silver as the 1-2 potential, it would suggest that it is playing out as a diagonal, with the legs of the diagonal being 5-wave structures. I think I have maybe seen one or two of those types in my entire career, so it makes me strongly question this potential. Therefore, I am probably going to give this a bit more time to sort out before I get aggressively long on silver in the near term.
In conclusion, I think we are still within a corrective phase in the metals complex, and I do not see anything in the GLD or GDX charts to suggest that it is highly likely we are ready to begin the next rally phase. While silver is presenting such a possibility, I am going to remain a bit more patient as I think there will be a wonderful opportunity on both GLD and GDX on the long side once the market makes it clear that this 4th wave has run its course in both those charts.